English II 2020
Korea is located between 33˚ and 43˚ north latitude in a temperate climate region with four seasons. Precipitation in Korea is abundant, and each season shows diverse climate characteristics. Mountain areas, which are mostly distributed around the northern and eastern regions, covered about 64% of the land of South Korea in 2015. In the southern and western areas, large rivers run, and various erosional or sedimentary landforms surround the rivers. Three sides of the Peninsula are surrounded by the sea, with a coastline with narrow inlets and many islands along the South Sea; vast tidal flats along the Yellow Sea; and sand dunes and lagoons alongside a smooth coastline along the East Sea.
The complexity and variety of ecosystems formed by the diverse climate and complicated topography affect the biodiversity inhabiting the Peninsula. Subalpine coniferous forests are common in the northern region, deciduous broadleaf forests are common in the central region, and warm, sub-temperate evergreen forests are common in the southern and island regions. The natural conditions and variety of vegetation also lead to variations in ecosystem productivity, resulting in distinct micro-habitats for a wide diversity of faunal communities.
The rich and diverse ecosystems in the Korean Peninsula have attracted people for centuries. People of Korea have been provided with abundant ecosystem services. They have developed a unique lifestyle that merges the marine culture of the Pacific with the continental culture of Eurasia. They have also established a catchment area-based traditional view of nature with the Baekdudaegan mountain ridge as the backbone of the Peninsula. They have developed numerous unique ecological cultures such as village forest, acorn jello, Songgye (traditional social institution for sustainable forest management), and Hyangyak (local rules).
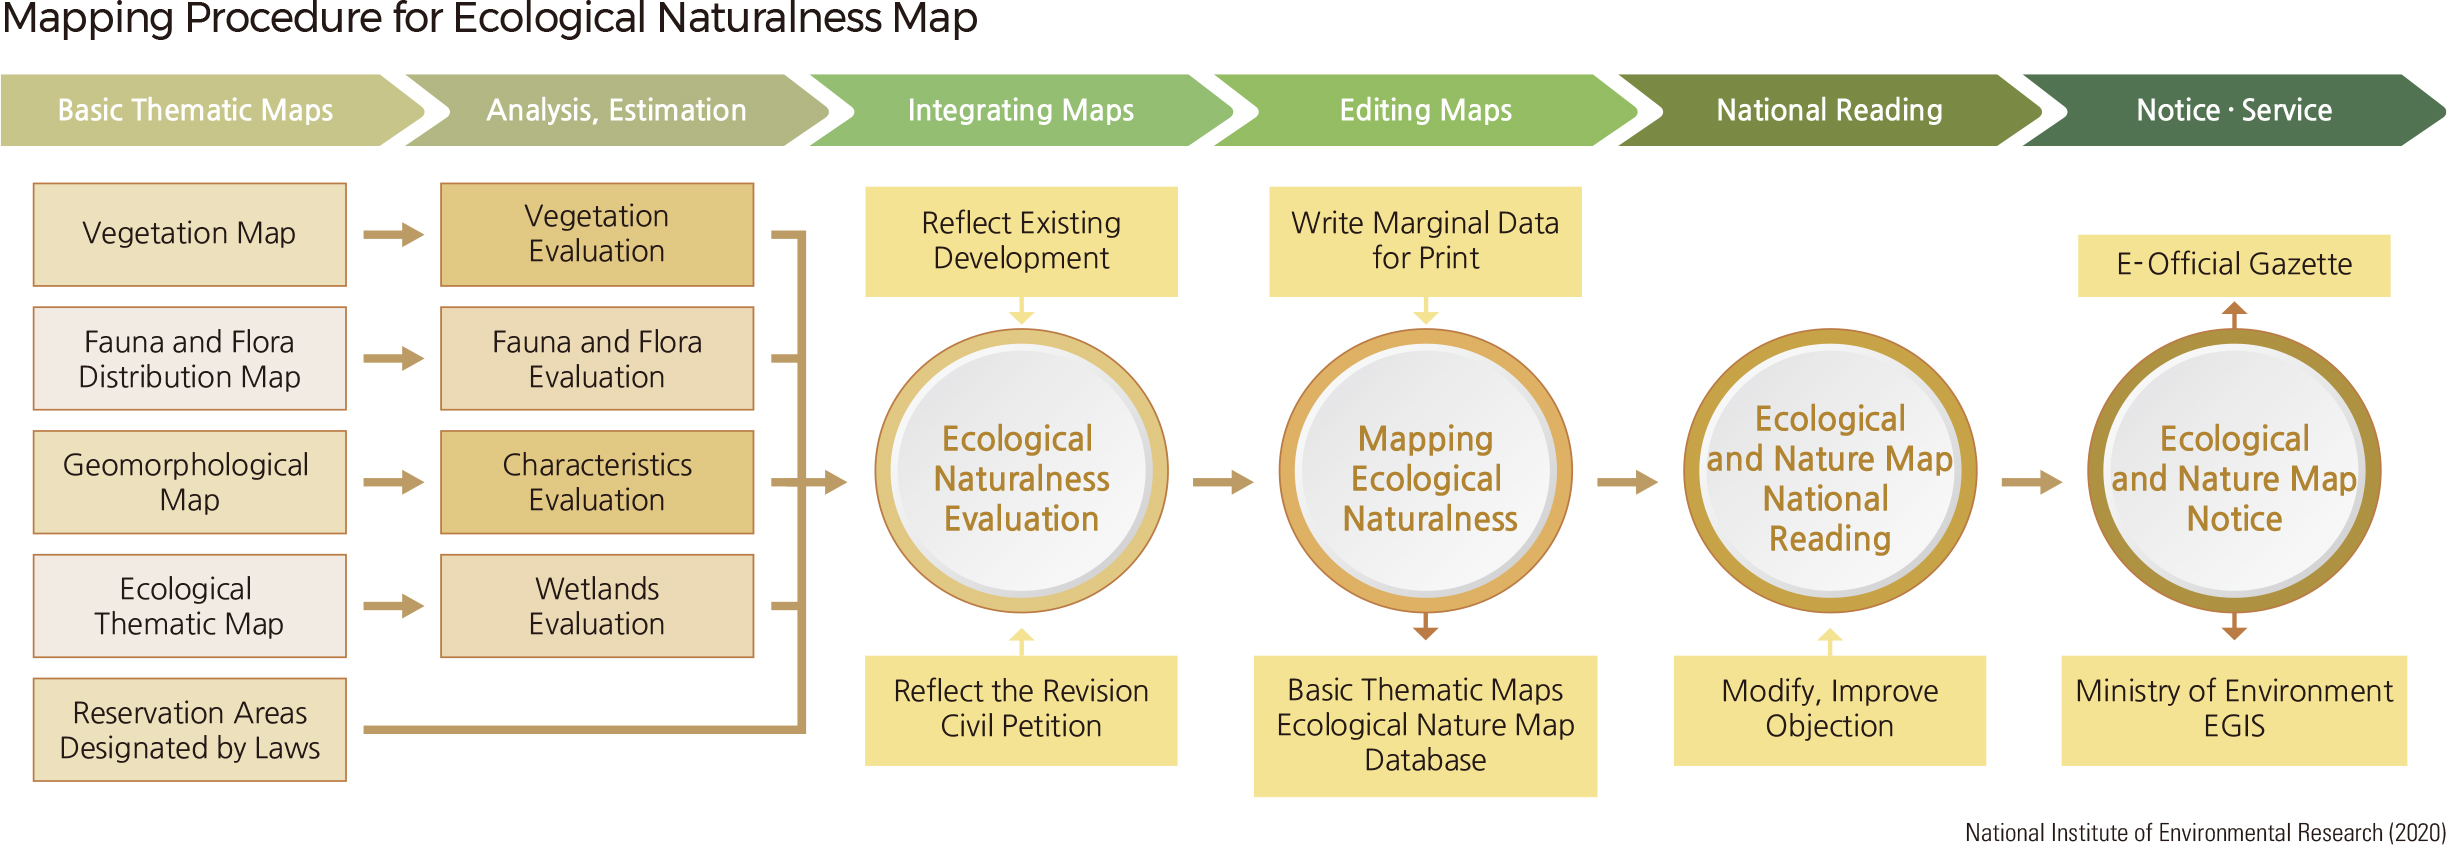
Although rapid industrialization and urbanization have expanded the national economy, Korea now faces significant environmental issues such as pollution of air, water, and soil, reduction of biodiversity, and ecosystem degradation. Natural environments and biota have been investigated nationwide to take action against these issues. The collected data have been comprehensively assessed and used for the formation of Ecological Naturalness Maps. Ecological Naturalness Maps visualize the ecological value of each spatial unit—mountains, rivers, inland wetlands, lakes, farmland, and urban areas—according to a rating system.
For the Ecological Naturalness Maps, environmental investi-gations are carried out to evaluate ecological naturalness through field surveys under nine categories (geographical features, vegetation, flora, benthic macroinvertebrates, insects, freshwater fish, reptiles, birds, and mammals). The results are stored in the GIS database. Based on this data, assessments of the value of vegetation, habitats of animals and plants, topography, and wetlands are carried out. The value of vegetation is evaluated through the conservation level of the vegetation, the value of habitats of animals and plants through the presence of endangered wildlife, and the value of the topography through the conservation level of the topography. The value of the wetlands is evaluated as a habitat for species and as a place for migratory birds. These values are put together to assess the ecological soundness of an ecosystem.
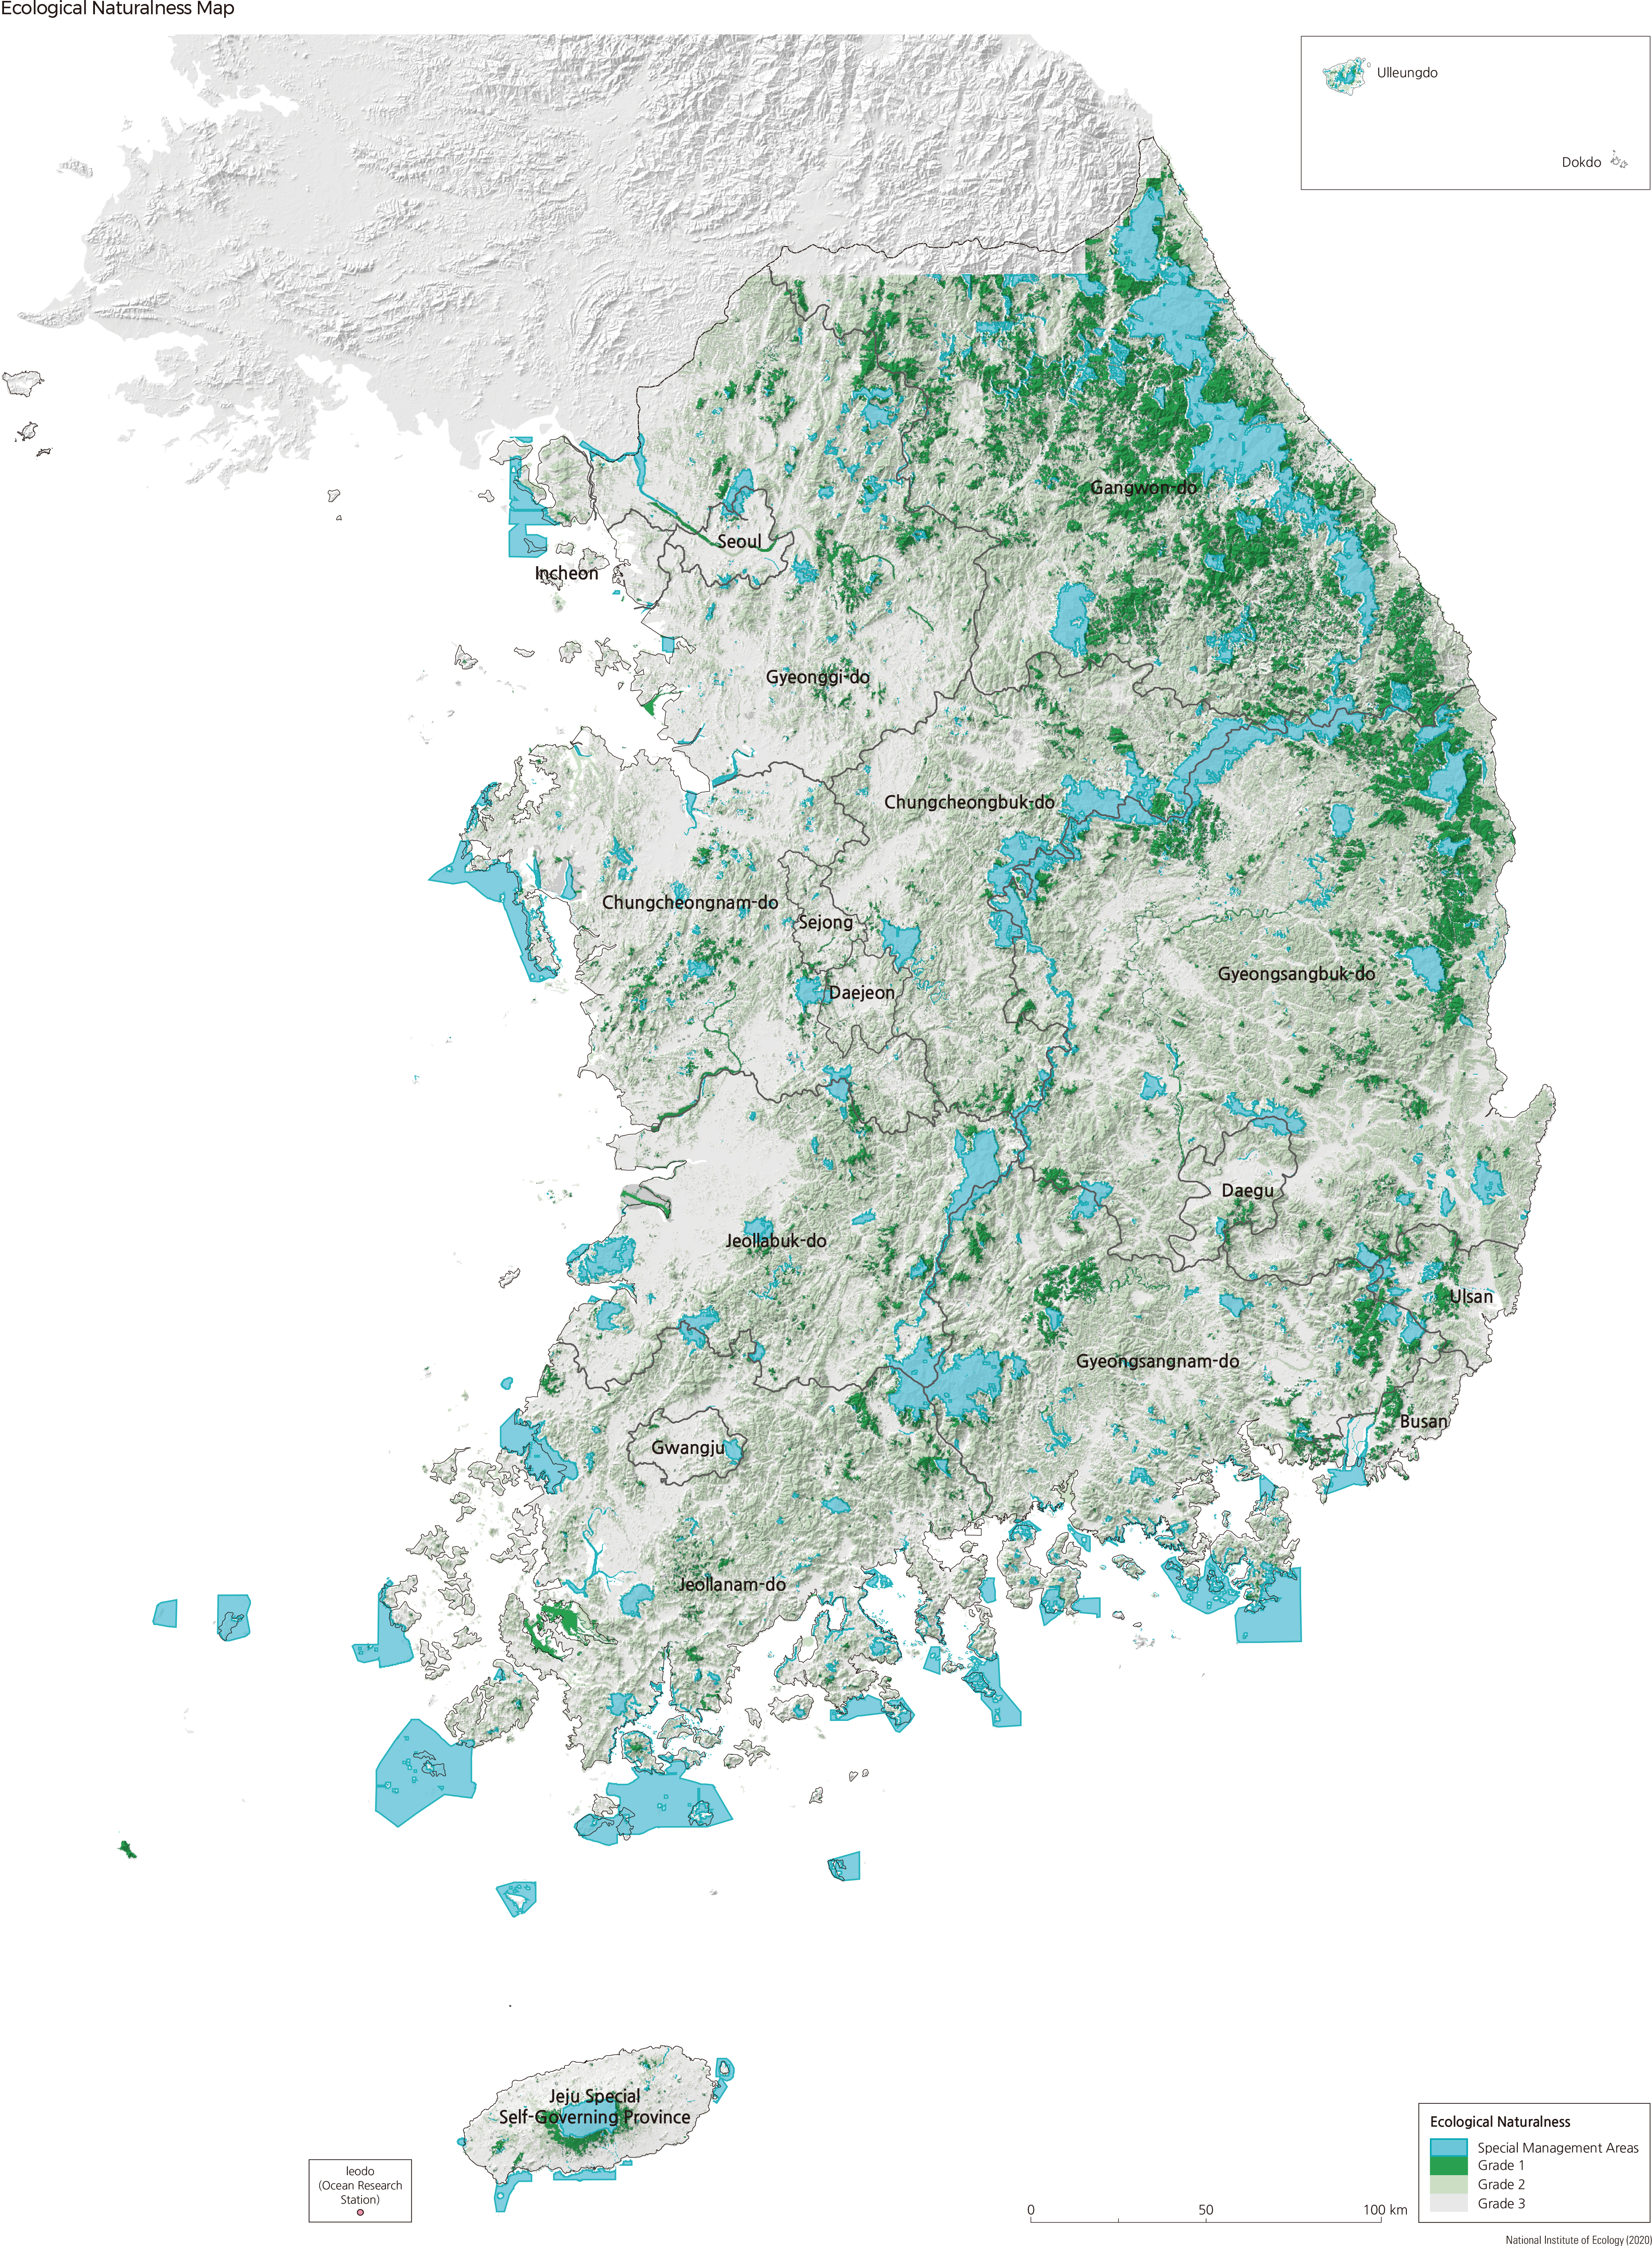
Final results are illustrated on the maps according to a 4-grade ranking system. In Grade 1 areas, the highest grade, development activities are limited to preserve or restore the natural environment. In Grade 2 areas, measures are required to minimize impacts on the natural environment due to development and land use. In Grade 3 areas, systematic development and land use are permitted. Reservation areas such as national parks and cultural heritage protection sites designated as reservation areas by laws such as the Natural Environment Conservation Act are classified as special management areas. Ecological Naturalness Maps are announced by the Minister of Environment and open to the public. Ecological Naturalness Maps are used in national and local environmental plans, as well as in the process of making and implementing development plans, environmental impact assessments, and in consultations requiring referential data. |