English II 2020
In the late Joseon Dynasty, modern topographic maps were introduced into the nation and coexisted with traditional maps. Modern mapmaking can be traced to the Korean Empire Period with the publication of Daehan jeondo in 1899. This map was the nation’s first attempt to utilize latitude and longitude as its coordinate system. Efforts to make cadastral maps and topographic maps based on land surveys in 1909 were thwarted by the Japanese occupation. From 1914, the Japanese Governor-General of Korea made 722 1: 50,000 scale topographic maps of the whole Korean territory and 143 1: 25,000 scale topographic maps of major urban regions for land exploitation and military purposes.
After independence, the democratic Korean government was formally established in August 1948, and the surveying troops from the Korean Army Headquarters were in charge of mapping. In 1958, the Ministry of National Defense established the National Geographic Research Institute, the first formal mapmaking governmental organization. From 1961 to 1963, the institute converted and revised 350 military topographic maps (1: 50,000 scale) covering South Korea and made them available to the public.
Experiencing fast economic growth and increased demand for maps, the Korean government tried to develop a Cooperative Survey Program between Korea and the Netherlands to meet the request for precise topographic maps on a large scale. From 1967 to 1974, most parts of South Korea were mapped at a scale of 1: 25,000 to produce 765 new maps. The National Geographic Information Institute was established under the Ministry of Construction in 1974, and has since consecutively produced 1: 5,000 scale topographic maps and 1: 250,000 scale thematic maps that include coastal base maps, land use maps, artificial satellite imagery maps, and aerial photo maps.
Automated map production was first introduced in the mid-1980s. Using data from the National Geographic Information System (NGIS), digital topographic maps at scales of 1: 1,000, 1: 5,000, and 1: 25,000 were being produced by the late 1990s. Since 2001, the maps have been continuously updated and revised. By 2003, the second set of digital maps (topographic maps 2.0) was completed, and the fully automated production process of maps at a scale of 1: 5,000 fueled its commercialization. New mapping technologies are now being developed with the Mobile Mapping System (MMS), aerial photography, and construction drawings.
Satellite imagery is utilized for a wide range of applications, such as monitoring potential natural disasters and analyzing resource use. Information collected from satellite images serves as basic data for geographic information systems and ultimately contributes to balanced national development.
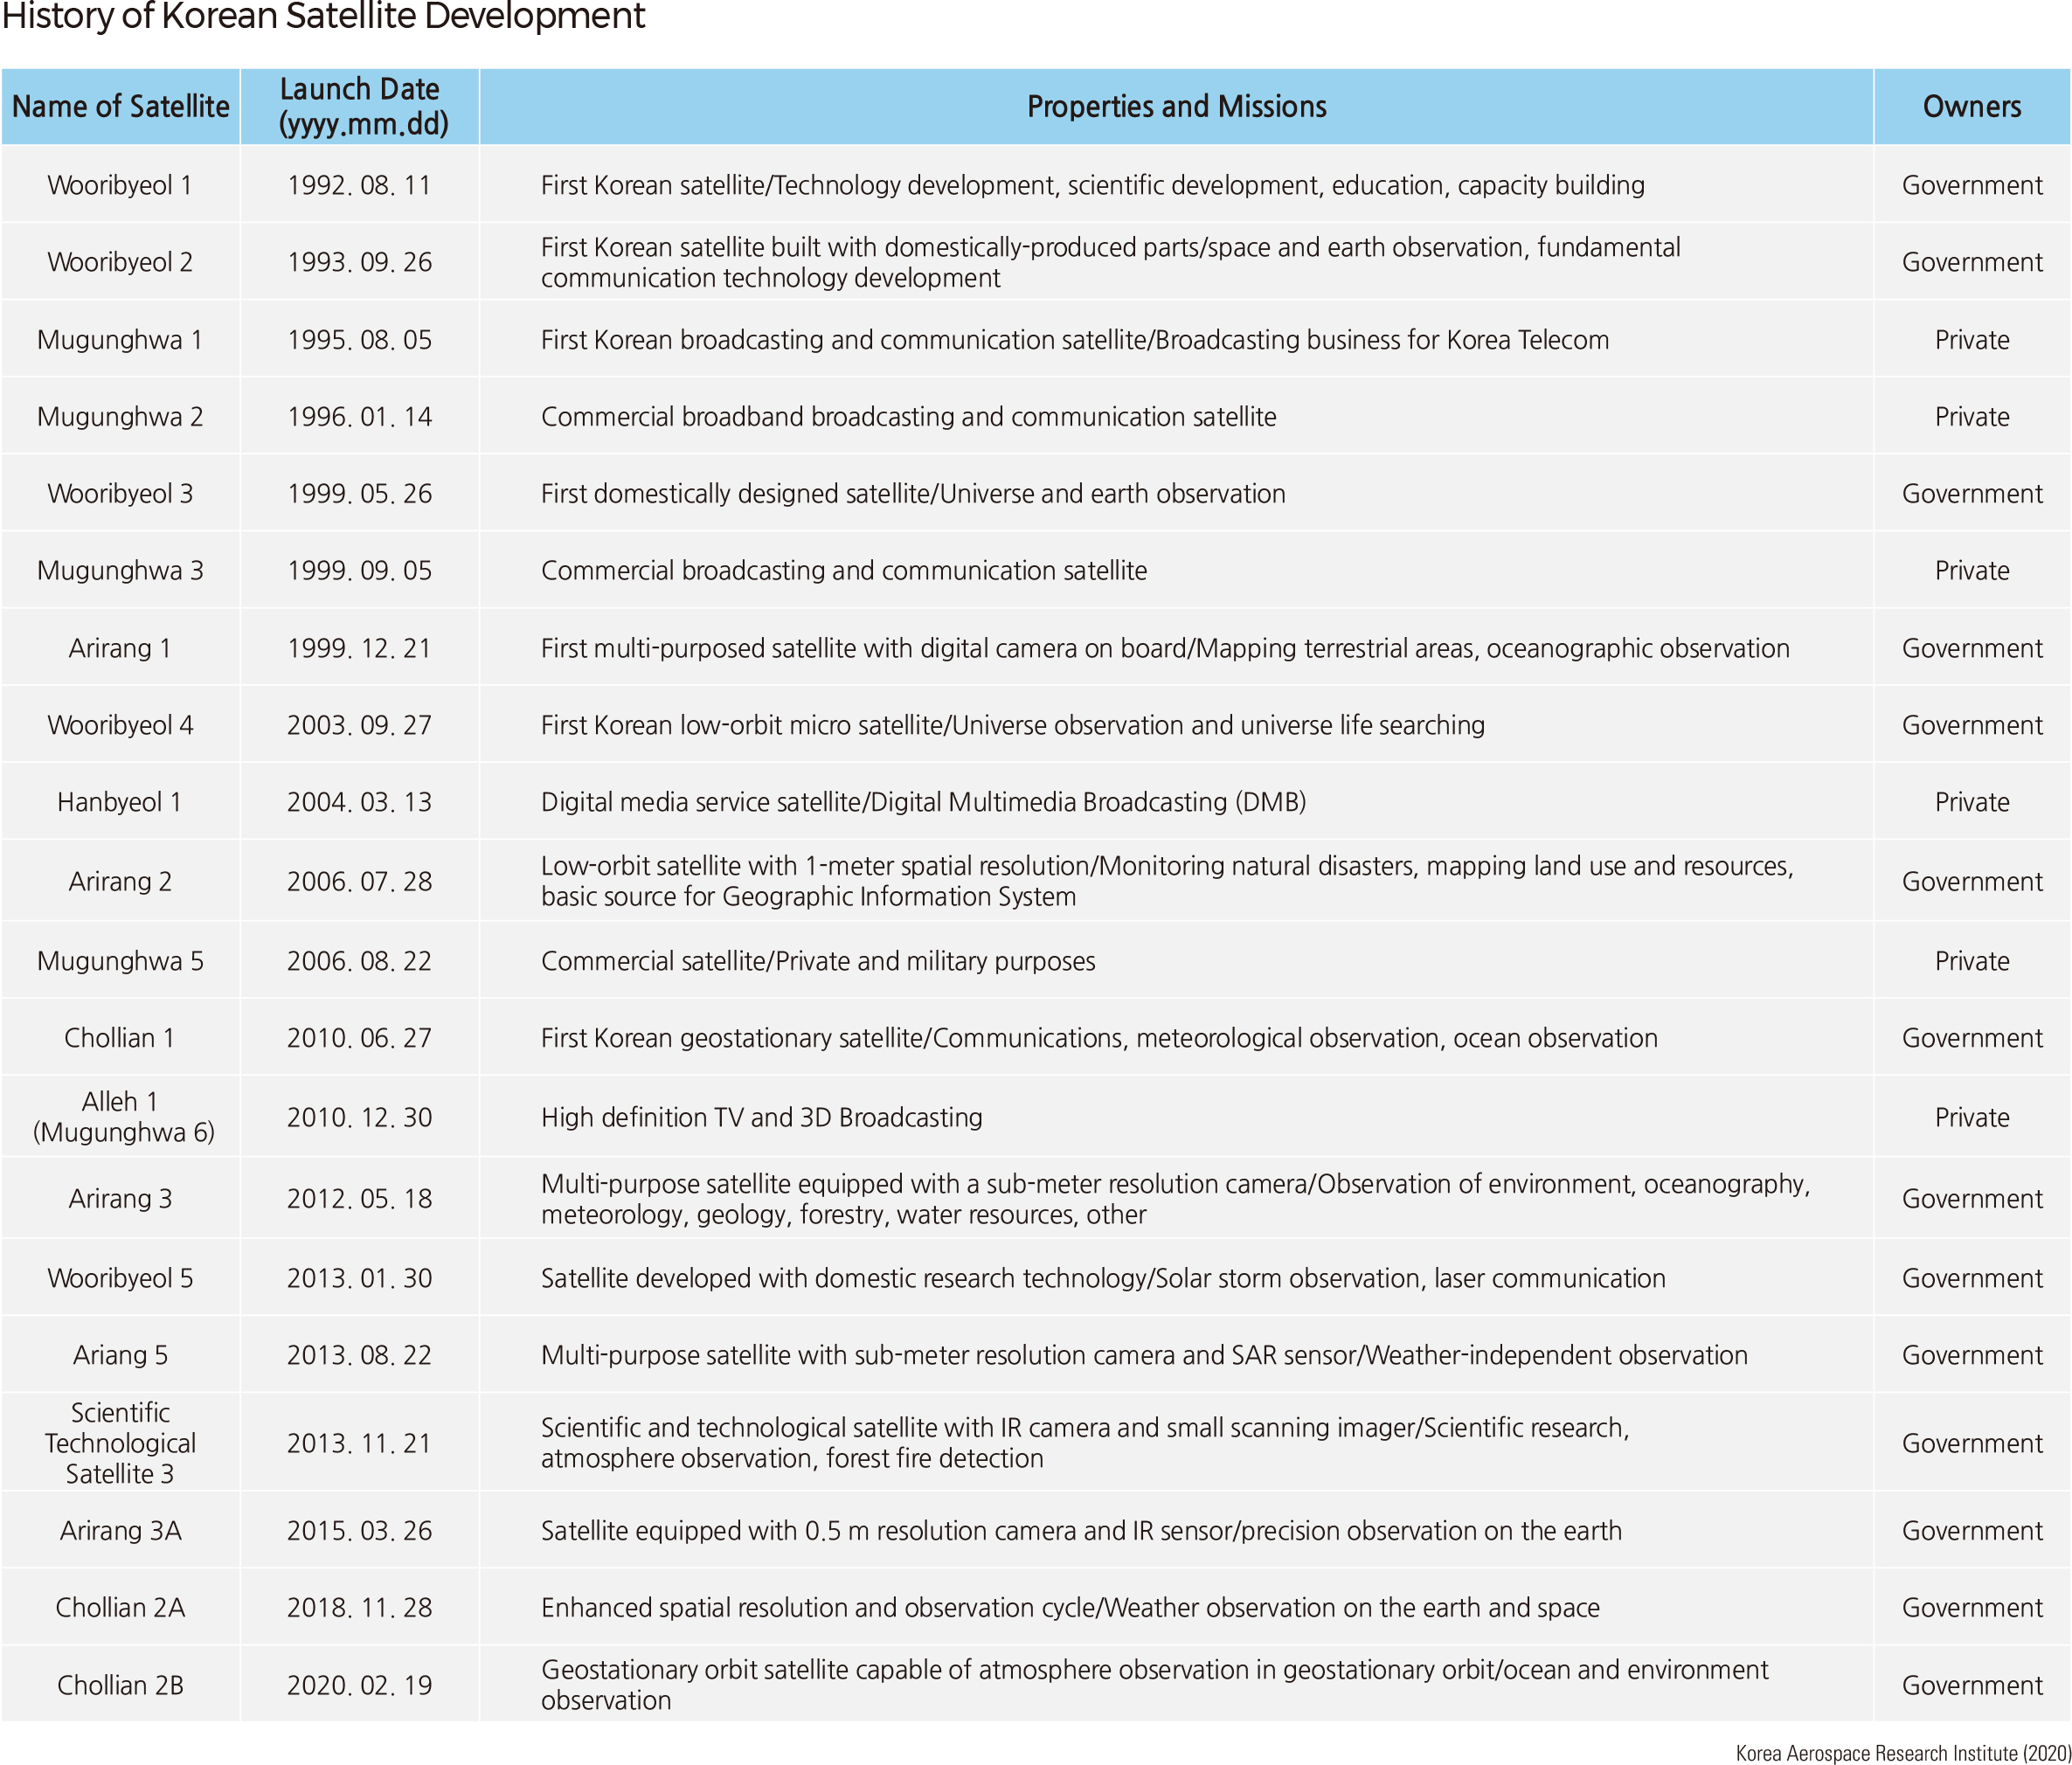
Korea began its Space Development Plan at the end of the 1980s to promote cutting-edge technology. Based on the master plan for long-term national space industry development, various initiatives were launched in the 1990s, including the development of artificial satellites. The first artificial satellite, KITSAT-1, was launched on August 11, 1992, successfully drawing public attention and support for the national space industry. Many fields have benefited from artificial satellites; broadcasting and communications services, marine observation, natural disaster prediction, and weather forecasting are just some of a continuously expanding range.
Korea created its third long-term plan for national space development and expects to launch twenty more satellites. It strives to further develop space technology and forge international partnerships to participate in the space station project. Korea aims to become a front-runner in the global space industry within the next ten years.
Korea conducts a national ecosystem survey that inspects the comprehensive status of the natural environment. It covers abiotic components (topography, geology, land, and soil) and biotic components (plants and animals). This survey enhances the understanding of topological features, the distribution of plant and animal species, the level of environmental destruction, conservational value, and more by analyzing the characteristics of each element.
The national ecosystem survey has three components: first, a comprehensive national environment survey as a basic investigation of the natural environment; second, a targeted survey of key ecological landscapes that include inland wetlands, uninhabited islands, coastal sand dunes, estuaries, and other landscapes of outstanding ecological importance; and lastly, a species survey on legally protected, rare, and endangered wild flora and fauna.
This survey is the largest of its kind conducted annually in Korea, involving around 500 researchers in various fields, including landforms and taxonomic groups of plant and animal species. The nation’s first survey (1986 to 1990) covered terrestrial, freshwater, and coastal ecosystems and was based on the “Basic Plan for the National Ecosystem Survey (1986).” The landform survey was included in the second-phase survey (1997 to 2003) and has been continuously updated. The fifth survey began in 2019.
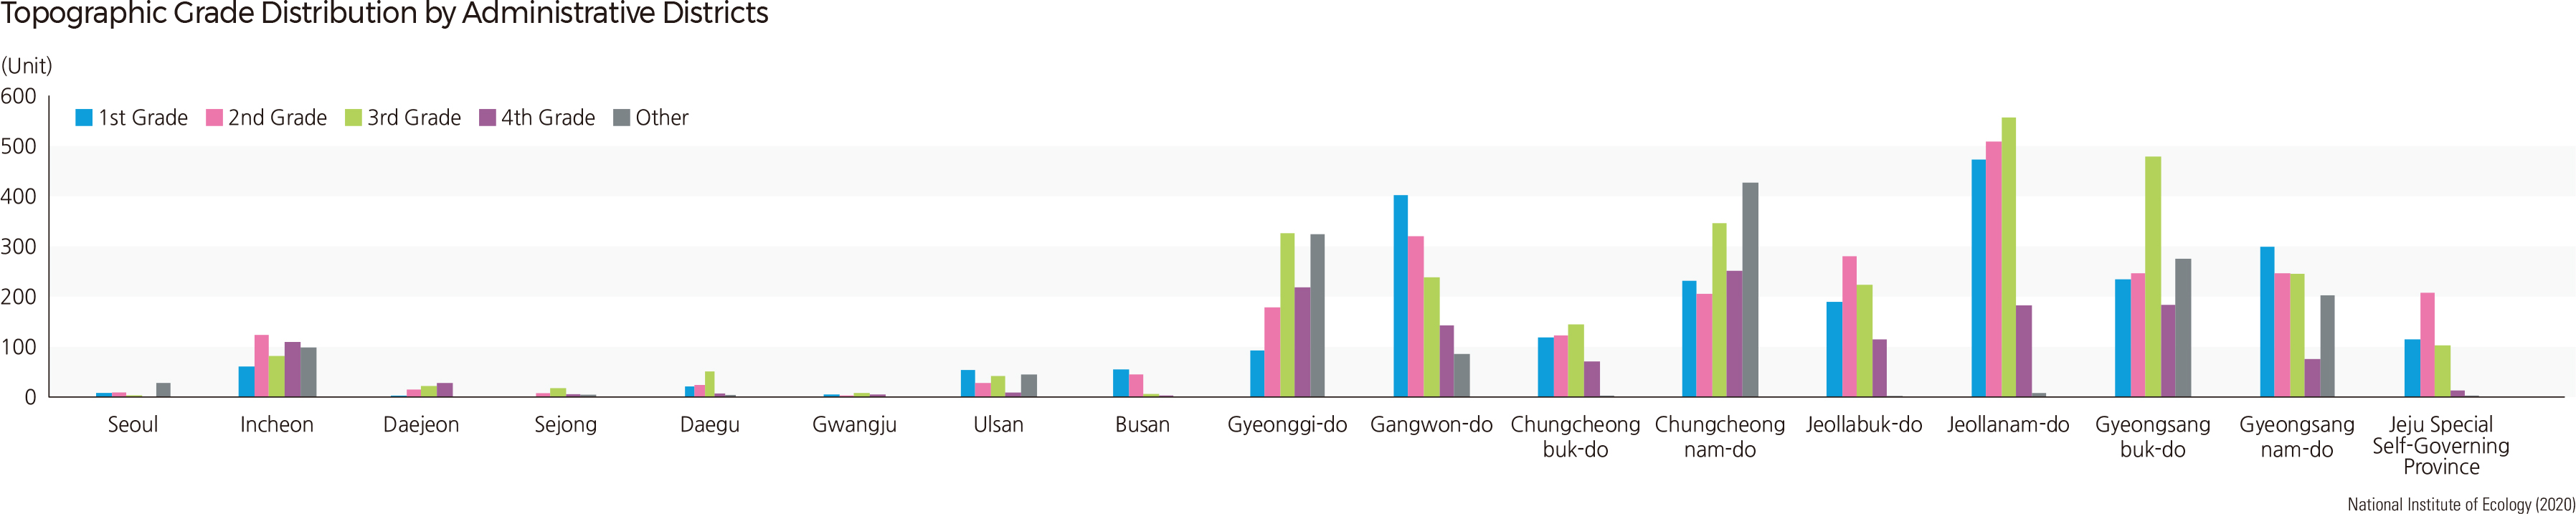
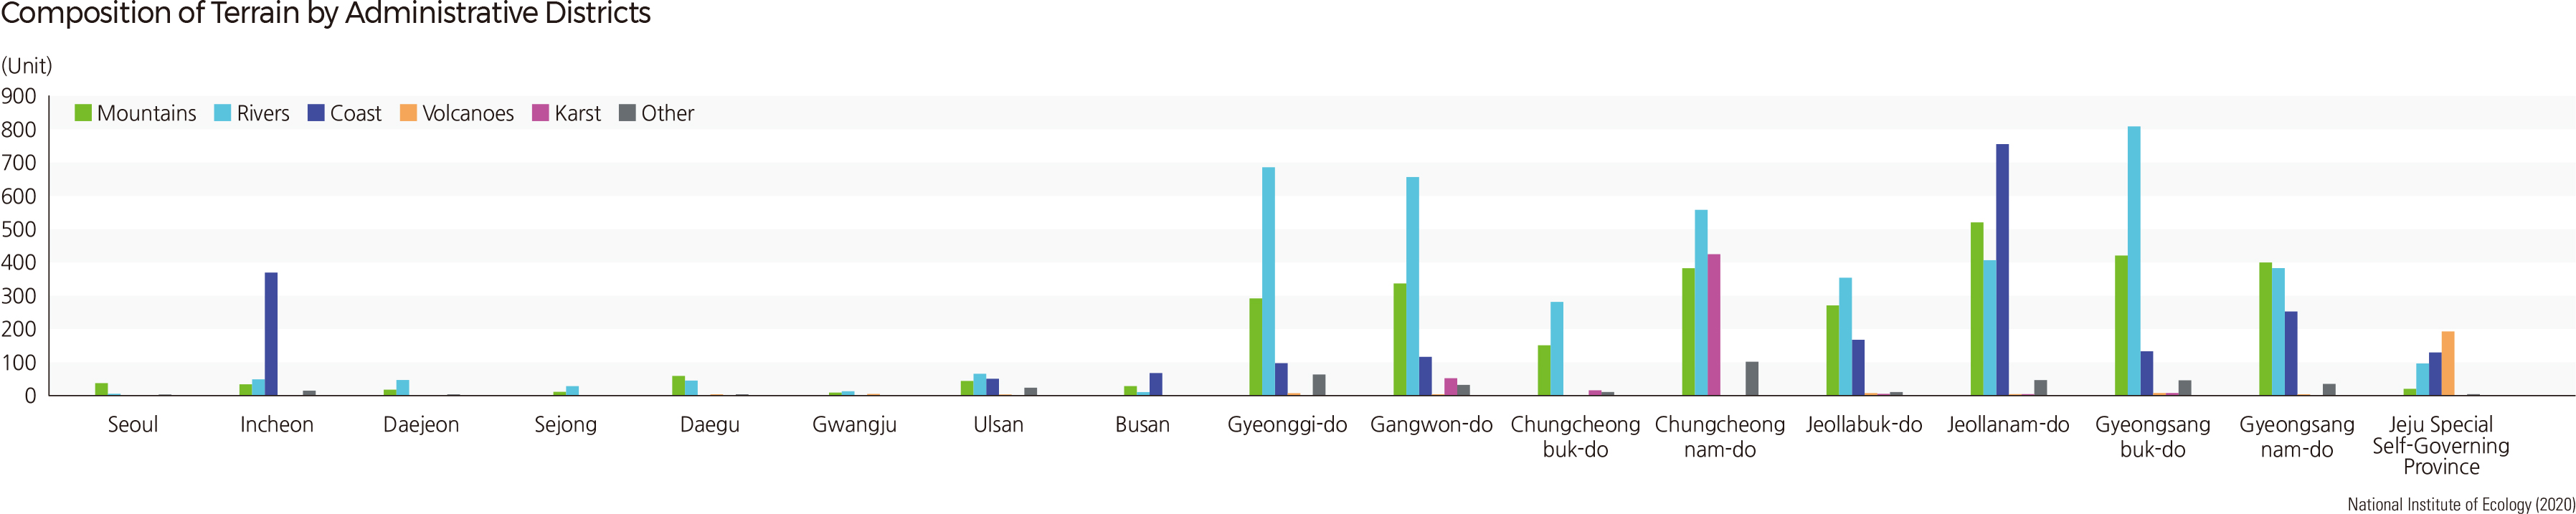
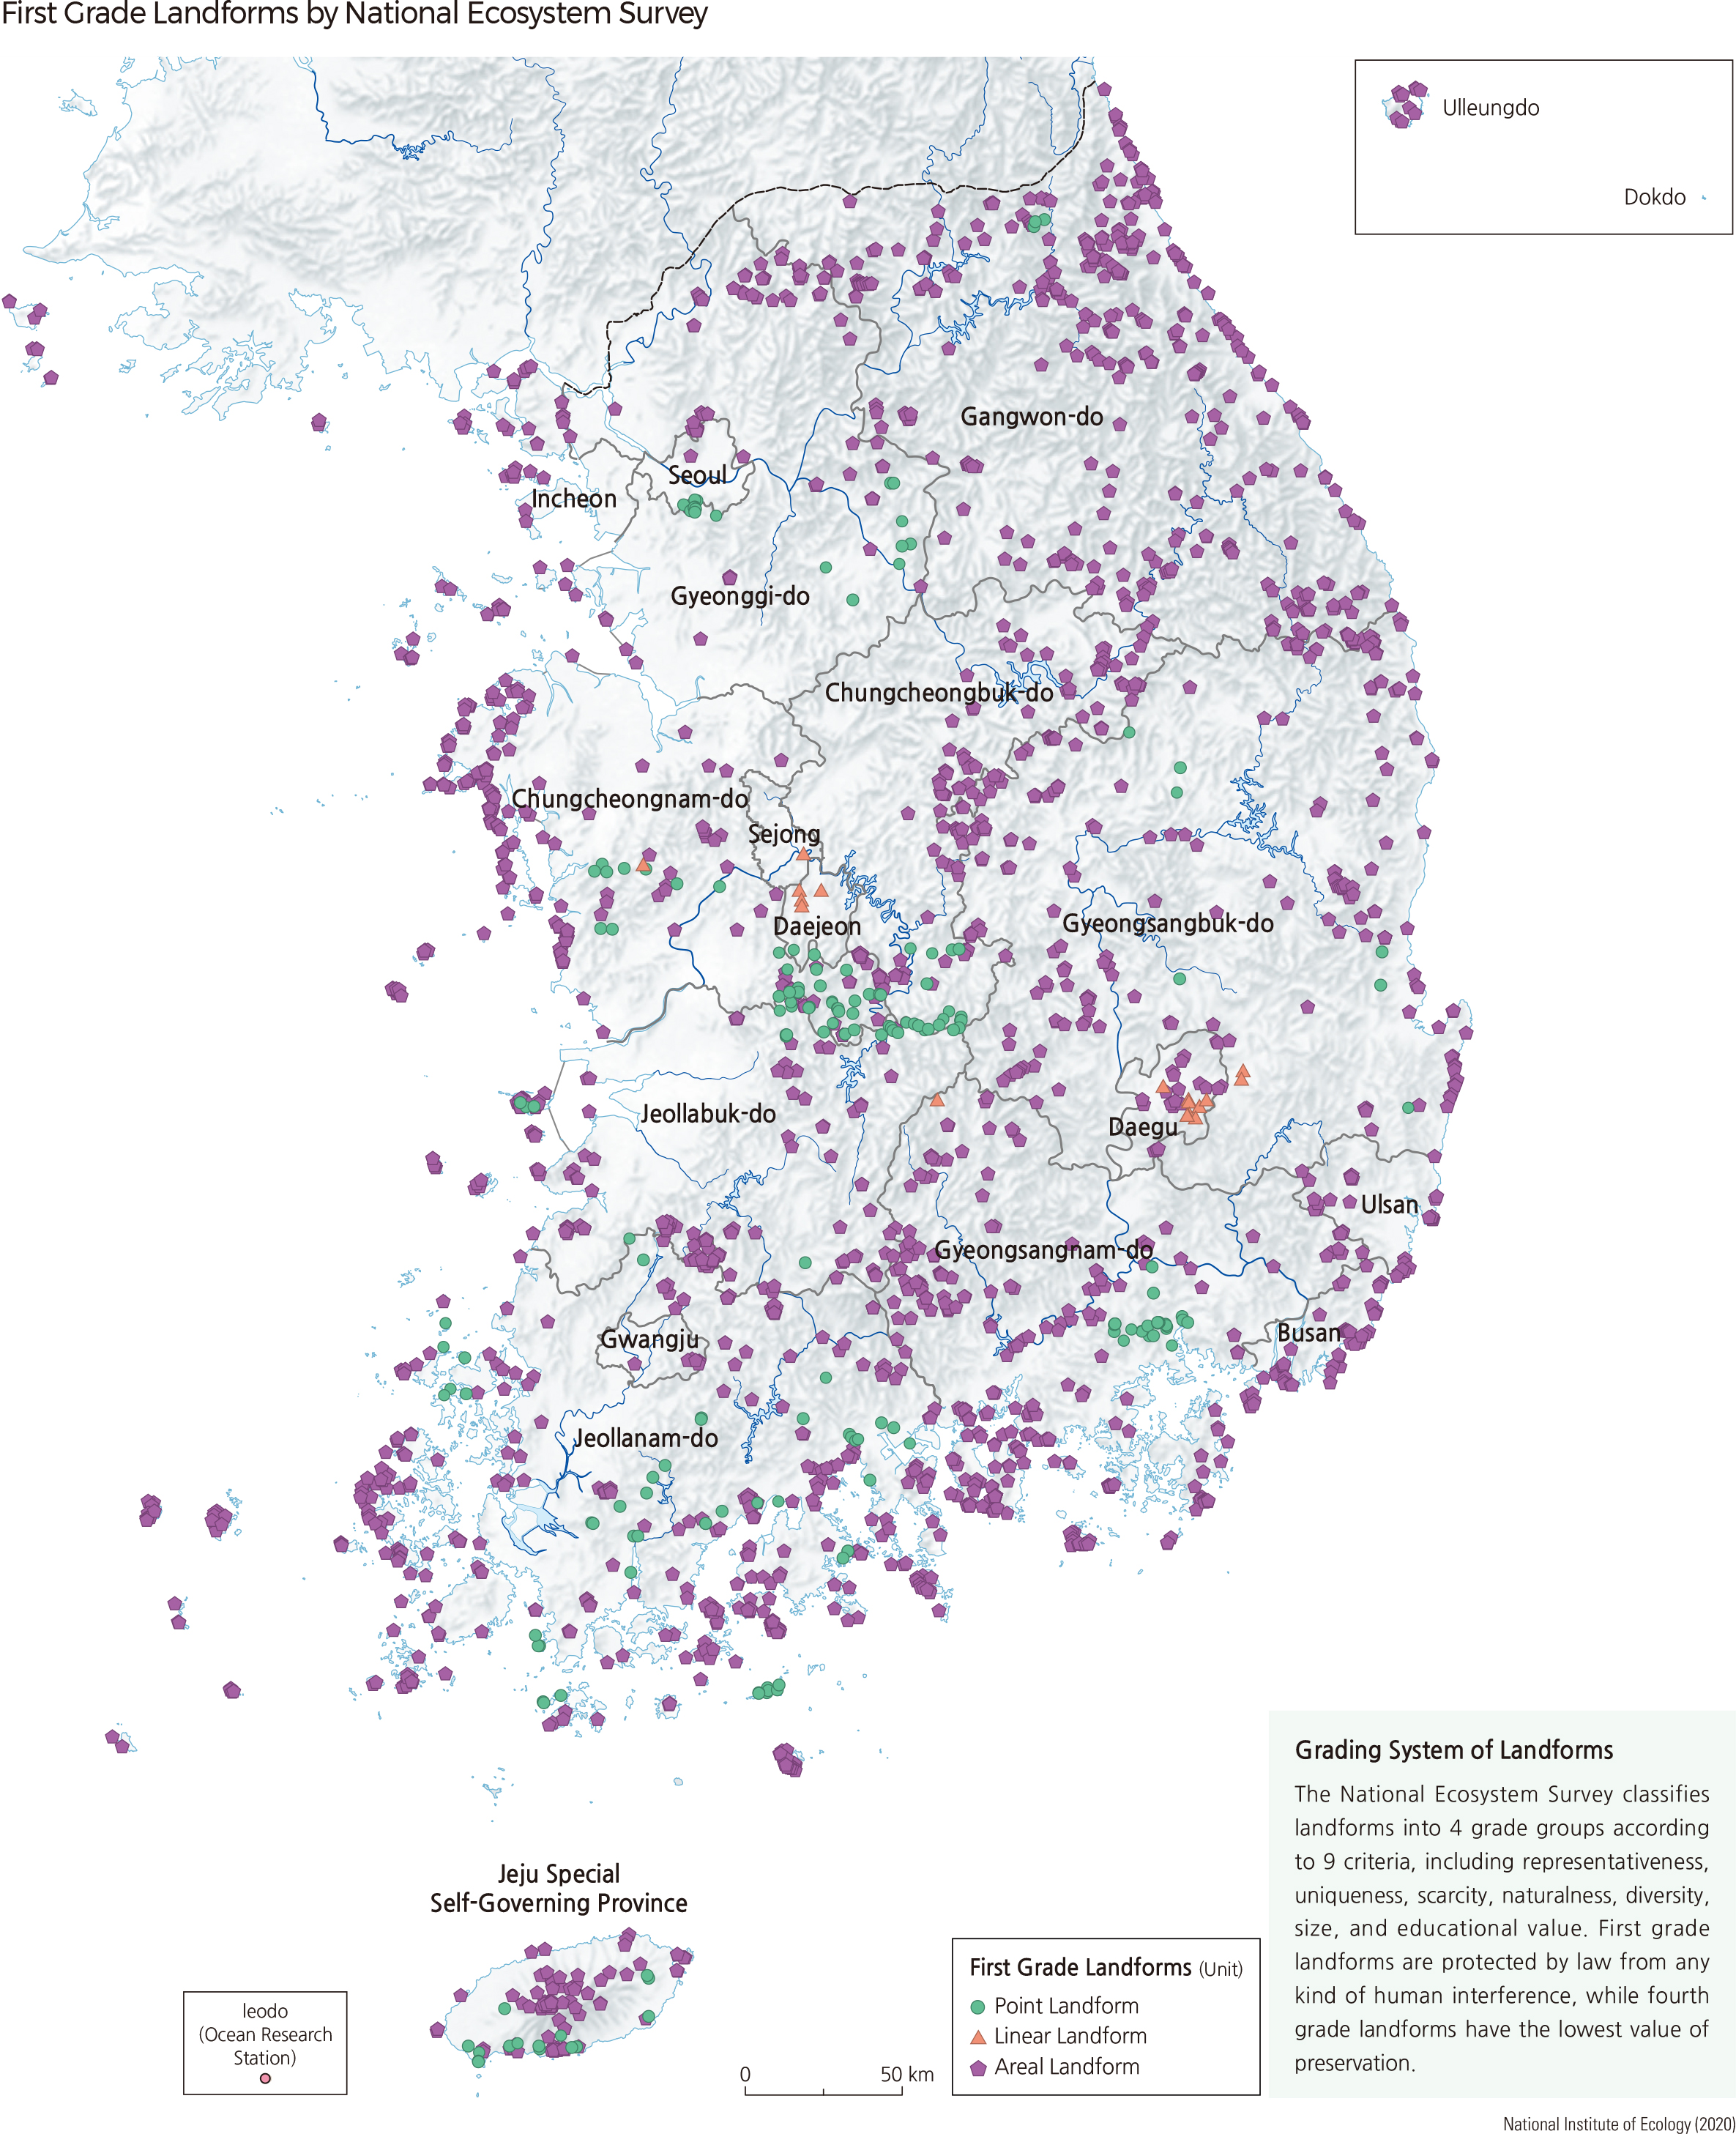
Geomorphological and landscape features are some of the most fundamental components of the natural ecosystem. Topographic features directly influence surface geology, soil distribution, groundwater status, and growth and reproduction of plant and animal species. The national landform survey comprises two different surveys: one is a general survey of features such as mountains, river landforms, and coastal landforms; the other is a special survey of volcanic and karst landforms. The results of the topographic survey are categorized into points, lines, and polygons based on their attributes. The fourth phase survey has reported that valuable topographic features of the first grade comprise 191 points, 19 lines, and 2,170 polygons in Korea.
The data collected through the national ecosystem survey enhances our understanding of the landscape and is foundational to understanding the natural resource potential and the distribution of biodiversity. Experts such as environmental managers, development planners, and government officials may utilize the comprehensive overview of the survey as it is incorporated into ecological maps to understand the distribution of biological diversity, establish development plans, carry out environmental impact evaluations, and conduct natural environment assessments. |