Comprehensive Edition
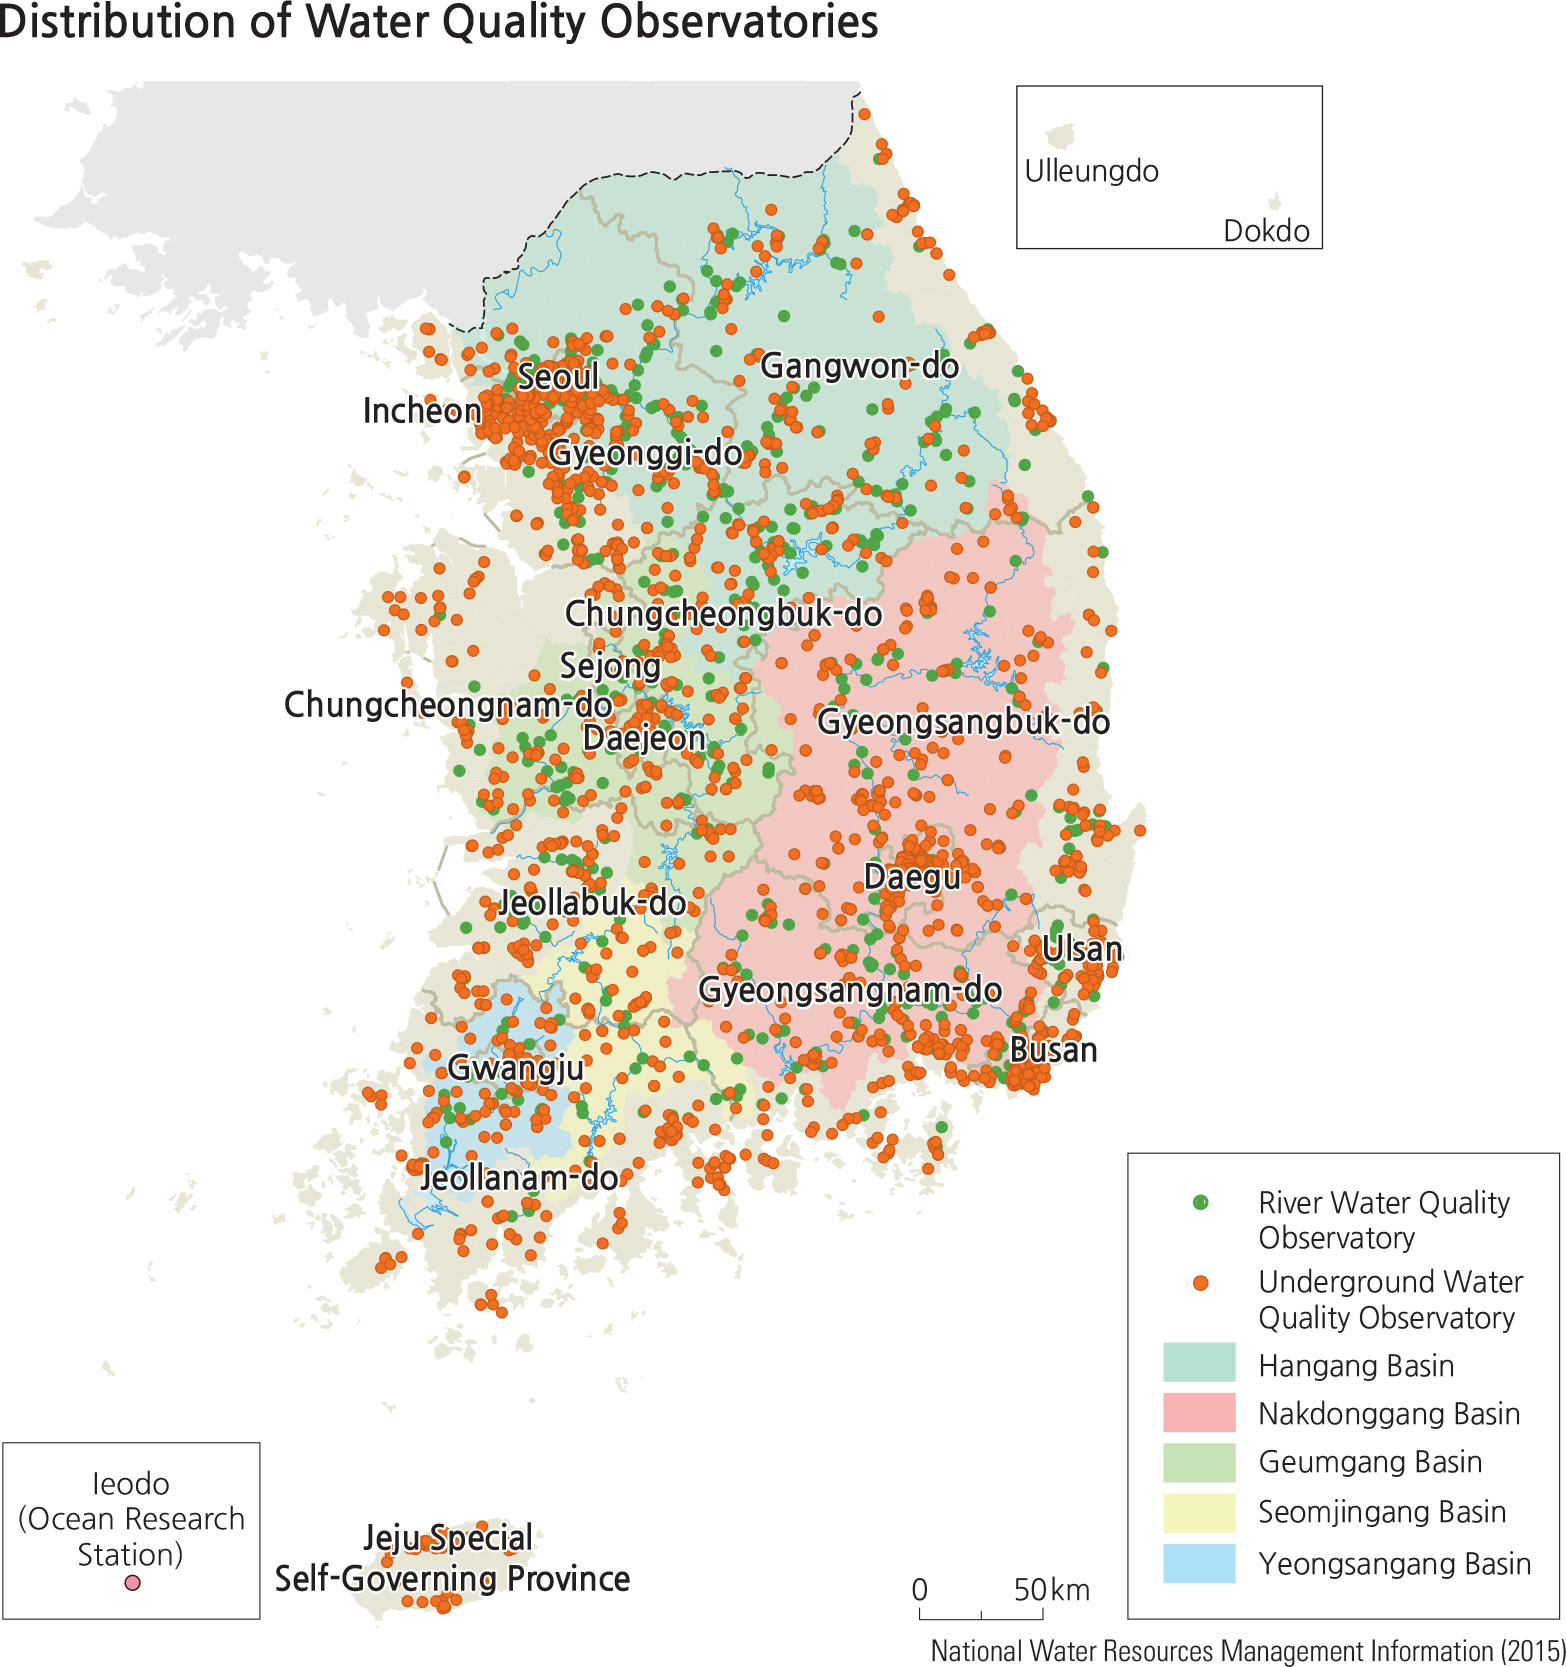
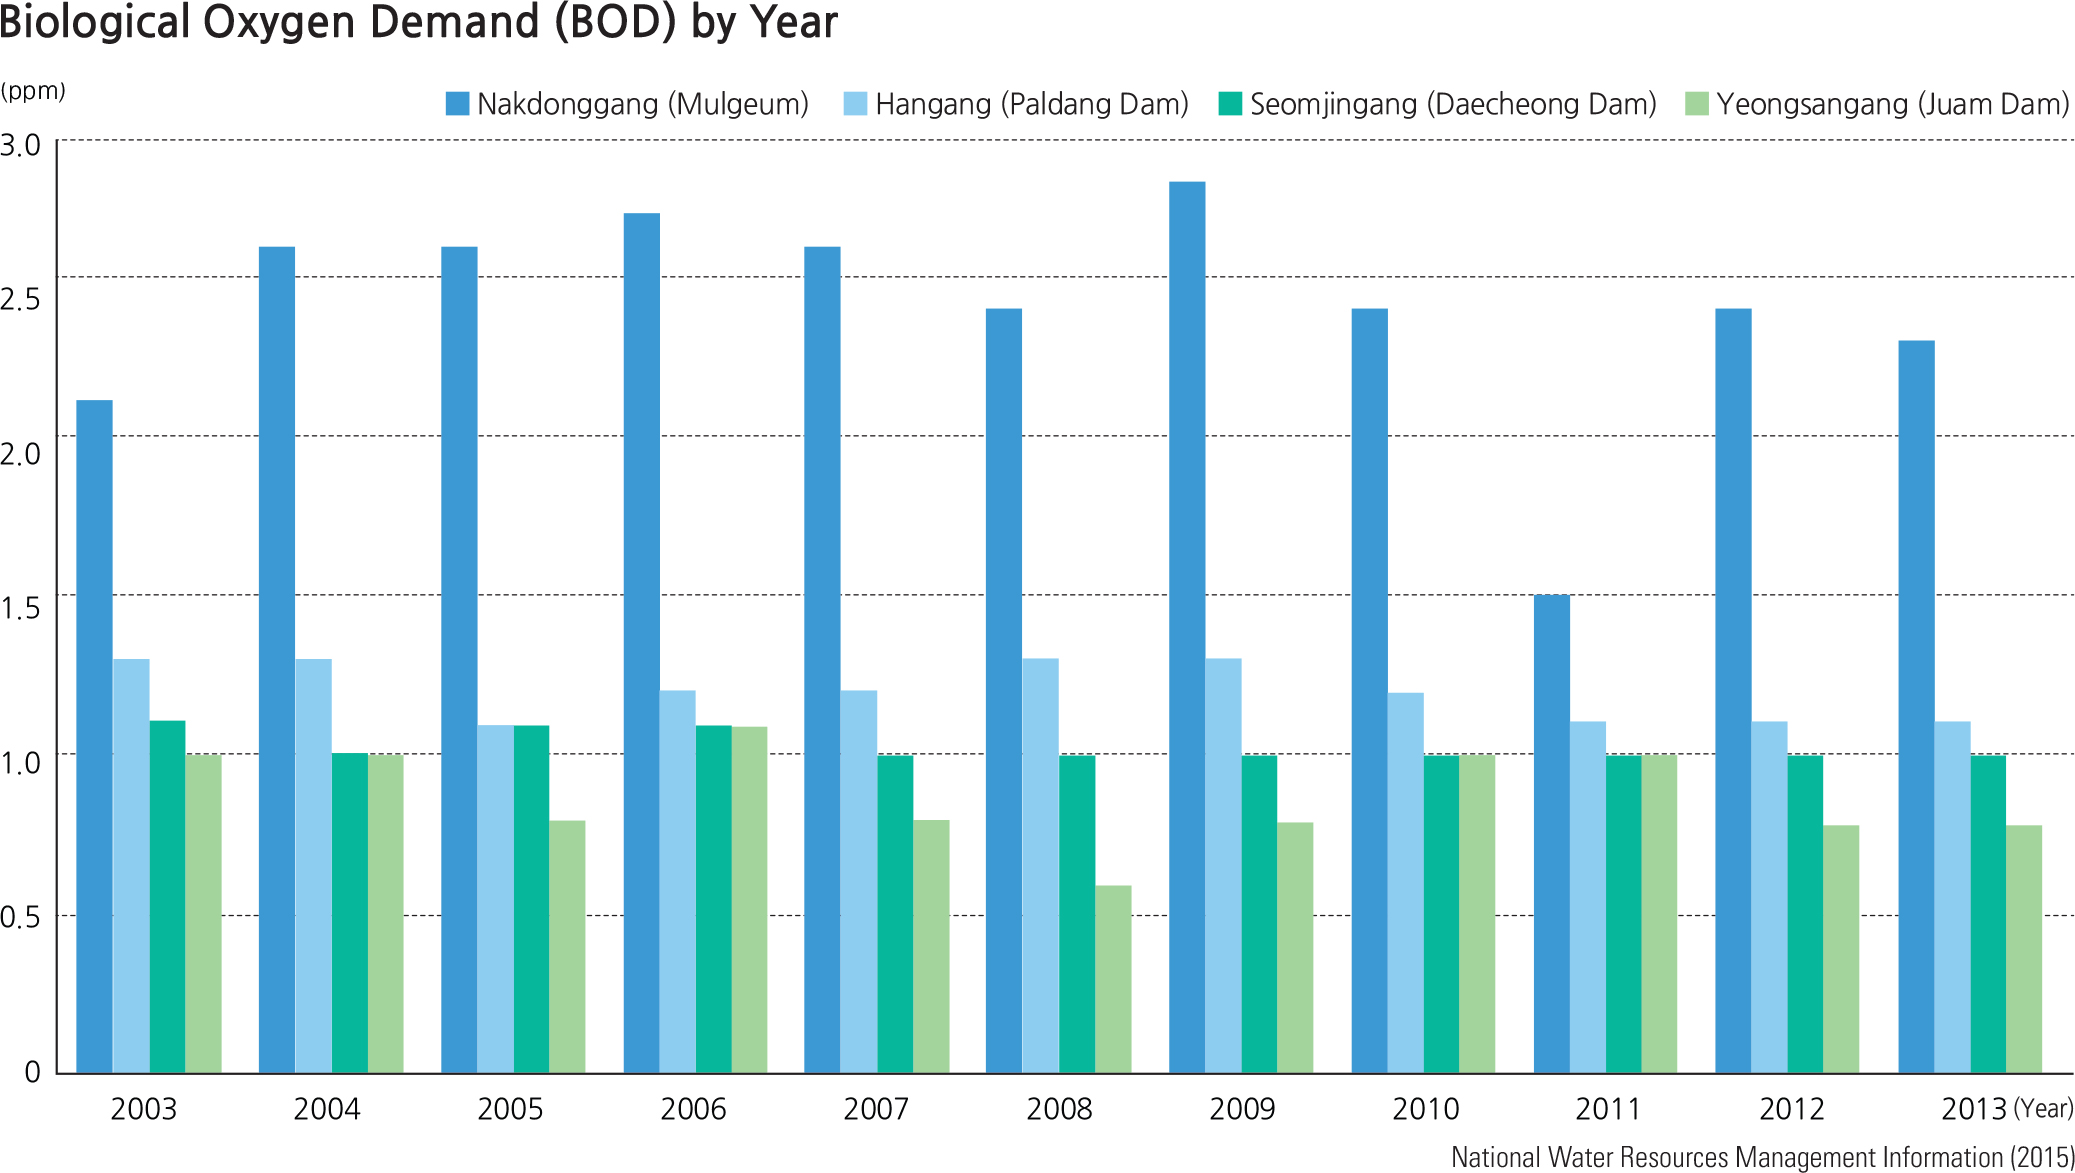
Water pollution may be caused by many human activities Biological Oxygen Demand (BOD) by Year such as industrial wastes, agricultural fertilizer runoff, illegal dumping of materials into water bodies, and leaching of chemicals into the soil and underground aquifers.Scientifically, there are two ways that water pollution can occur: chemicals that dissolve in water and physical suspension or settling of materials in water. In order to understand the status of the water quality of a nation, numerous monitoring stations that are spatially distributed over the country are needed. Water samples must be taken and analyzed in order to understand the quality of the supply of drinking water and all the water assets for both fresh water and sea water along coastal areas. Understanding the existing water quality is the first step to protecting these water resources. In Korea, several ministries and even corporations are involved in monitoring water quality in order to prevent water pollution. The water quality monitoring network is operated to understand the status of water quality and aquatic ecosystems in public water bodies such as rivers and lakes. Water quality monitoring sites are selected based on the following criteria: sites for which water quality conditions must be addressed; sites to preserve good water quality; sites to identify changes in water quality status and pollution trends; sites to analyze contaminant inflow into rivers and their effects on the rivers; and sites to investigate pollution loads due to freshwater and seawater mixing. Currently, water quality monitoring is carried out at a total of 2,188 sites. Data on water pollution is disseminated through the “Water Resources Management Information System (www.wamis. go.kr).” While inert (chemically inactive) materials (such as glass and ceramics) in the water do not cause as much damage, chemically active materials may change chemical composition of the water. One of the greatest concerns in surface water habitats is the depletion of oxygen, which suffocates fish and other organisms. When too much organic material is suspended in water, decomposers (such as algae) rapidly proliferate and use oxygen to decompose the organic matter, robbing oxygen from fish. A typical example is the growth of algae. Excessive growth of green algae turns the water green. Green tides occur when suspended algae proliferate in slow-flowing rivers or eutrophic (rich in minerals and nutrients) lakes that contain high concentrations of carbon, nitrogen, and phosphorus. (Nitrogen and phosphorous are major components of agricultural fertilizers and become nutrients When green tides occur, green algal blooms can cover the water surface and shut out sunlight. Existing shallow water plants in affected areas have difficulty in absorbing enough sunlight to maintain photosynthesis, so they may begin to die off. This adds to the amount of organic matter available to the decomposers. All of these factors accelerate the water quality degradation. Natural surface water habitats maintain an equilibrium between species compositions, with normal input of nutrients and organic matter. When excessive nutrients are released to such waters, the system becomes imbalanced. Although green tides are found in oceans all across the world, they are generally small and confined to coastal areas. Since 2000, green tides have been forming in the Yellow Sea and the East China Sea every year, usually appearing in coastal areas such as Qingdao and the Yangtze River estuary. Small patches of green algae have also been found in the open sea. In Korea, green algae mainly appear in rivers; those that form in the sea are usually not harmful to the Korean coast. Biological oxygen demand (BOD) and chemical oxygen demand (COD) are carefully monitored. BOD refers to the amount of dissolved oxygen in the water that is consumed by decomposing organic materials such as tree leaves, branches and dead algae. COD refers to both organic and inorganic materials that consume dissolved oxygen, such as the rusting of ferrous materials (iron). Brief Interpretation of the Maps and Graph The Water Pollution Monitoring map classifies the monitoring observatories of stations into river water observatories and underground water observatories. Their locations are also classified based on the five major river systems basins. It is very clear that many stations are distributed throughout the whole country, but less clear that their densities are lower in high mountain areas (refer to the physical map of Korea on page 42). Despite the title, data for the Effluent Quality Standards for Pollutants by Province map is actually by sub-districts (-si/-gun/-gu) divisions. These standards are classified into four categories: Clean Zone, Clean A-Level Zone, A-B Level Zone, and B-Level Zone. However, the map does not specify the criteria for these classifications; because of this, the map can only be used in a subjective interpretation. The lowest B-Level Zone areas correlate with sub-district units in the heart of Busan, Ulsan, Daegu, the entire capital region of Seoul and other units to its south and northwest. In other words, Why do you think that there are fewer water quality observatories or stations near mountain ridgelines and higher slopes? Why do you think that green tides and algal blooms occur in coastal regions, eutrophic lakes, and backwaters instead of main channels of rivers? Why is it a general practice to install an air pump in home and in commercial aquariums? Monitoring the Marine Environment Korea regularly monitors its coastal waters. The marine environment monitoring network aims to comprehensively understand the marine environment, and the collected information is used to establish national management and conservation policies. This monitoring network is composed of four different network types: port, coastal and offshore, environmental management waters, and estuaries. The monitoring is carried out in February, May, August, and November of every year at a total of 417 stations. In addition, the automatic seawater quality monitoring network collects data from Sihwaho, Masanman, Ulsanman, Yeosu New Harbor, and the coastal areas of Busan in order to measure the water quality of estuaries, pollution hot spots, and coastal pollution. The information from these monitoring networks is provided through the “arine Environment Information System (www.meis.go.kr).” Red tides refer to the situation when seawater is discolored red due to a mass bloom of phytoplankton—mainly cyanobacteria, diatoms, and dinoflagellates—n the ocean. Depending on the species of plankton, the color of the water can show tinges of yellowish brown, yellow, or grass green. Red tides can cause great damage to marine ecosystems as they may initiate mass kills of coastal fish species all across the globe. While diatoms were widely responsible for red tides along the Korean southern coast in the early 1990s, Cochlodinium polykrikoides (a species of dinoflagellates) has primarily been the cause since 1995. Red tides from Cochlodinium polykrikoides blooms often occur in the waters between Narodo and Namhaedo and spread throughout the South Sea of Korea. In some years, they spread to the west coast and the East Sea as well. Rising sea surface temperature is one of the causes of a more frequent occurrence of red tides. Brief Interpretation of the Maps and Graph The Distribution of Marine Environmental Observatories map is a basic locational map that shows the spatial network of these observatories. The entire coastline of South Korea is dotted with these stations; in addition, a lattice of stations is placed far off the west, south, and east coasts to collect information about marine water quality in the Yellow Sea, South Sea, and East Sea. The graph on Chemical Oxygen Demand (COD) of National Coasts by Year clearly shows a much higher rate of COD along the west consistently through the years while the lowest rates are found along the east coast. Compare the COD graph with the Environmental Issues of Northeast Asia map on page 116, and suggest a reason why COD is highest along the west coast of Korea. Which sector(s) of the Korean economy could most likely be affected by red tide or marine pollution? Also compare the COD graph with the currents and tides maps on pages 56–7 and offer some reasons why east coast waters consistently have much lower COD rates.
|