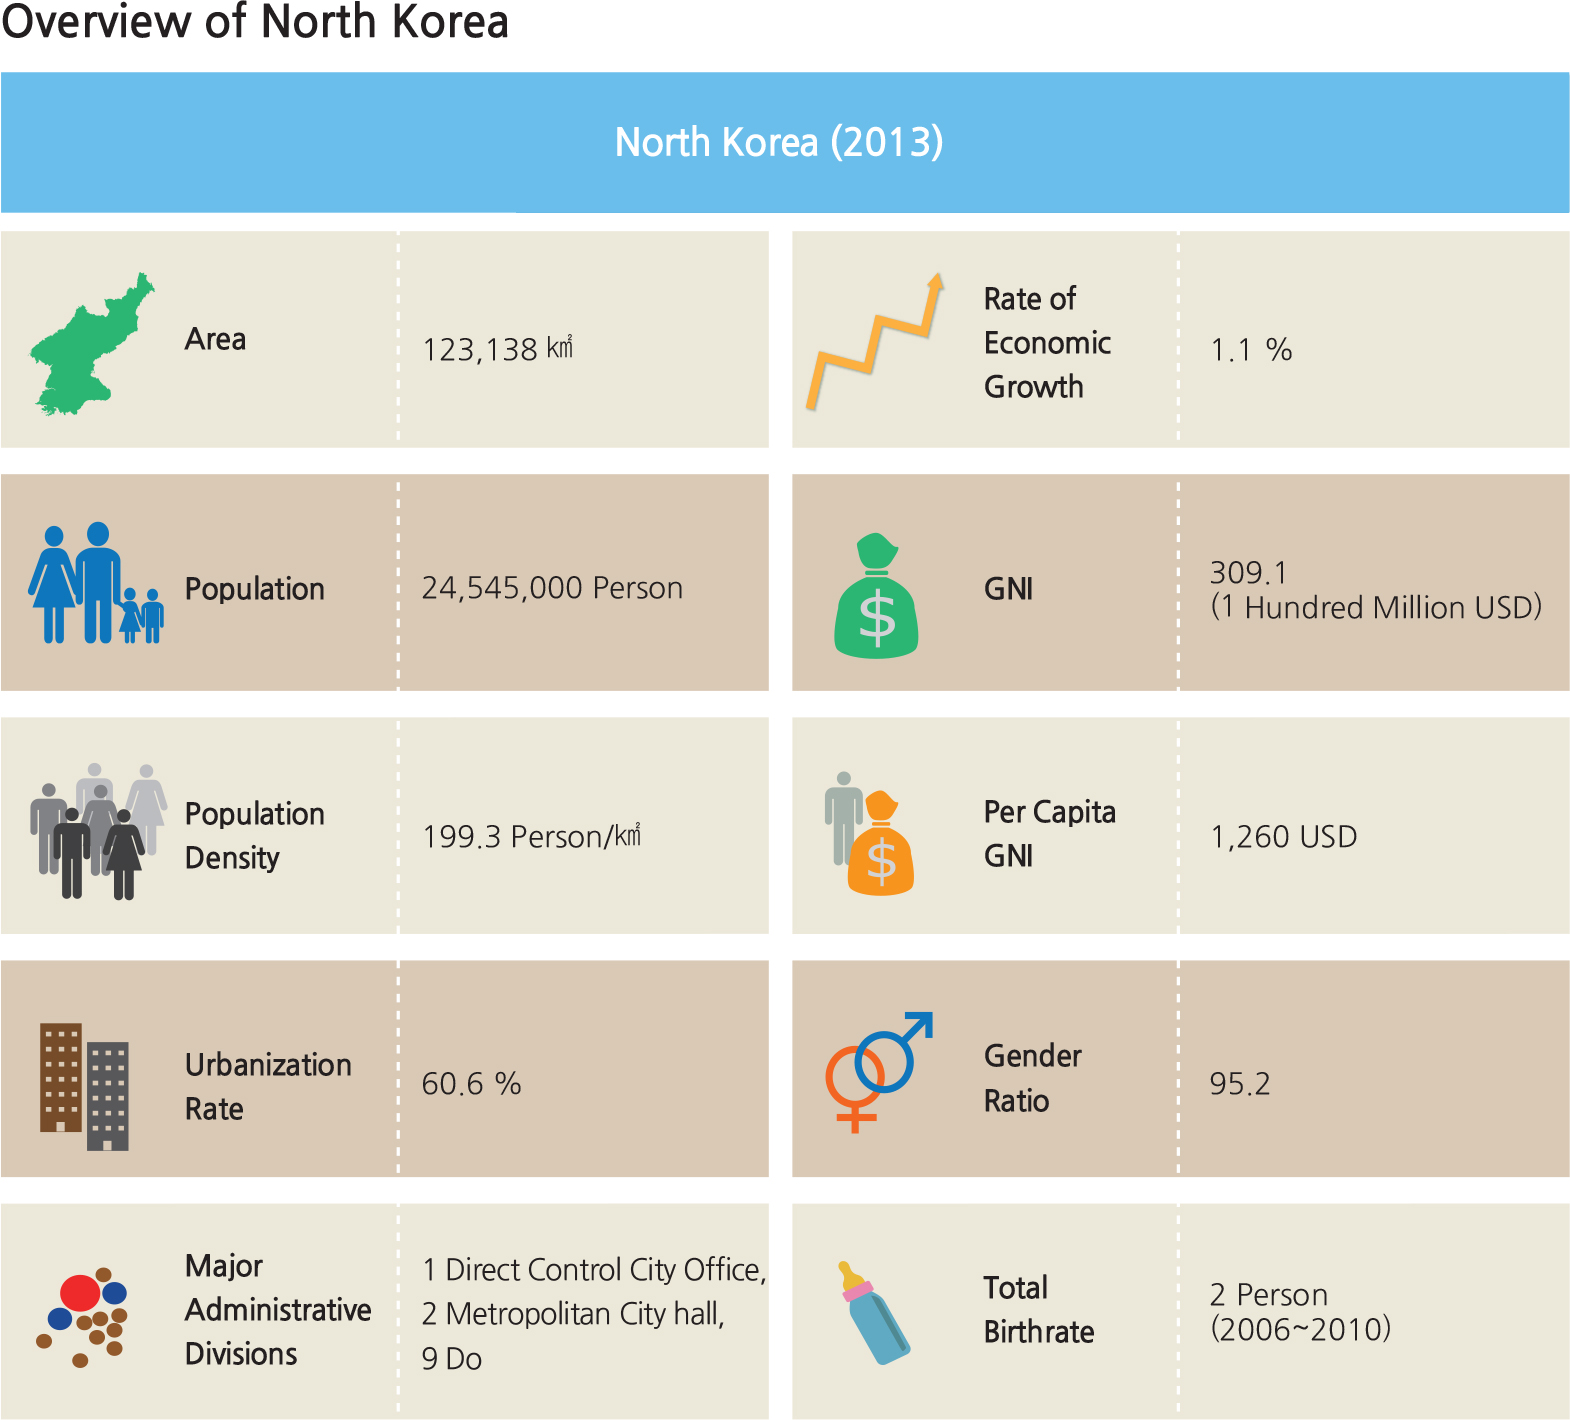
North Korea, officially known as the Democratic People’s Republic of Korea (DPRK), is north of the demarcation line set by the Korean Armistice Agreement in July 1953. Its total area is 123,138 square kilometers, accounting for approximately 55.8% of the entire Korean Peninsula, which is 223,404 square kilometers. The population of North Korea is about 25,115,000 (2016 estimate), and its population density is 199.3 persons per square kilometer. This is close to 40% of that of South Korea, whose population density is 499.1 persons per square kilometer.
North Korea faces the East Sea on the east coast and the Yellow Sea on the west coast, and shares a border with the northeastern part of China along the Amnokgang (Yalu River) and Dumangang (Tumen River), and with Russia’ Siberia along the Dumangang. The boundary with China is 1,353.2 kilometers long and features bridges such as the Amnokgang Bridge, which enables road and railway traffic to flow between Sinuiju in North Korea and Dandong in China. North Korea shares a border with Russia that is 16.2 kilometers long and is connected by a railroad bridge between North Korea’ Dumangang Station in Naseon (Rason) and the Khasan Station just across the border in Russia. To the south, North Korea’ border with South Korea is at the Military Demarcation Line inside the DMZ. Since 1945 when Korea was liberated from Japan, North Korea has undergone several administrative reforms. As of 2014, it consists of one district-controlled city, Pyongyang, two special cities (Naseon and Nampo, both promoted for economic purposes), and nine provinces.
One of North Korea’ prominent geographical features is the North-South running Nangrimsanmaek (Nangrim Mountain Range), which is part of the Baekdudaegan (a traditional way of representing backbone mountain ranges on the Korean Peninsula). The following ranges are also part of Baekdudaegan: the Gangnamsanmaek, Jeoguryeongsanmaek, and Myohyangsanmaek located to the west, and the Hamgyeongsanmaek and Bujeollyeongsanmaek located to the east in Hamgyeongbukdo and Hamgyeongnam-do. The northern and eastern parts of North Korea are mostly dominated by mountains and uplands whereas the southern and western parts generally consist of plains and lowlands.
Due to this topography, the rivers that run toward the Yellow Sea, including the Amnokgang, Daedonggang, Cheongcheongang, and Yeseonggang, tend to wind through the mountains and meander on gentle slopes once they reach the plains. In contrast, rivers that move toward the East Sea, such as the Dumangang and Namdaecheon, are straighter and much shorter in length than those of westbound rivers. Consequently, North Korea’ major plains are located on alluvial deposits supplied by the larger rivers that drain toward the Yellow Sea.
Many of the bedrock strata were formed between the pre-Cambrian and Cenozoic Eras, providing the country with a wide range of mineral resources. North Korea is one of the top ten countries in the world with the largest reserves of magnesite, tungsten, molybdenum, graphite, barite, gold, mica, and fluorspar, in addition to 40 kinds of natural mineral resources that have economic value.
North Korea is in a temperate climate region and has a continental climate. Its winters are very cold as a result of northwestern winds that blow from Siberia, and its summers are hot and humid due to the southeastern monsoon winds that bring moist air from the Pacific Ocean. The average annual rainfall is between 600–,500 mm; 53–3% of all precipitation occurs from June to September. The overall rainfall is less than that of South Korea and varies widely depending on the region.
In the past, North Korea had an abundance of natural resources that had ecological value. However, its forests have been consistently damaged due to programs such as “ationwide Fortification,”one of the four military campaigns that began in the 1960s; “erraced Field Farming,” one of the five nature reformation campaigns that began in the 1970s; and the “ew Field Finding Project,” which began in the 1980s. Particularly in the 1990s, forests were devastated as financial difficulties forced people to find food and fuel in the mountains.
Known to many as a hermit state, North Korea is closed to most countries in the world. It trades mostly with China. With some natural resources, minerals, and ores, North Korea elected to invest heavily in the military, especially in nuclear arms and intercontinental ballistic missiles, while it has only limited investments in infrastructure, manufacturing, trade, education, and human resources. As a result, its economy is far worse than that of South Korea. The strength of a nation’ economy is often measured by an index called Gross Domestic Product (GDP). It refers to the total value of manufactured goods and services rendered in a country in one year. Sometimes, it is also measured as Gross Domestic Product per capita, meaning the total GDP value divided by the country’ total population. While economic data about North Korea may not be very accurate, its 2015 GDP per capita is estimated at $1,700, compared to $37,100 per capita in South Korea, and $56,800 per capita for the United States for the same year.
Situated in the temperate zone, its agriculture has not been particularly productive, partly because of devastating weather conditions and partly because of lack of arable land, poor soil, and lack of fertilizers. In the 2000s, food supply diminished to famine levels until an international humanitarian food supply began in 2009. Since then, agricultural productivity has increased somewhat as international assistance has decreased. Rice production increased but it is far from the self-sufficient level.
With a young new president, North Korea embarked on a path to become a nuclear power. Its leaders believe that achieving nuclear weapon capabilities will guarantee it from being attacked. This belief is contrary to beliefs held by other nations of the world that has nuclear weapon capabilities. In 2016 and 2017, North Korea accelerated its testing of intercontinental ballistic missiles and nuclear bomb development while the rest of the world and the United Nations closely monitor and prepare for further economic sanctions. This situation is fast becoming a global concern as there is the possibility of escalating to a nuclear war confrontation.
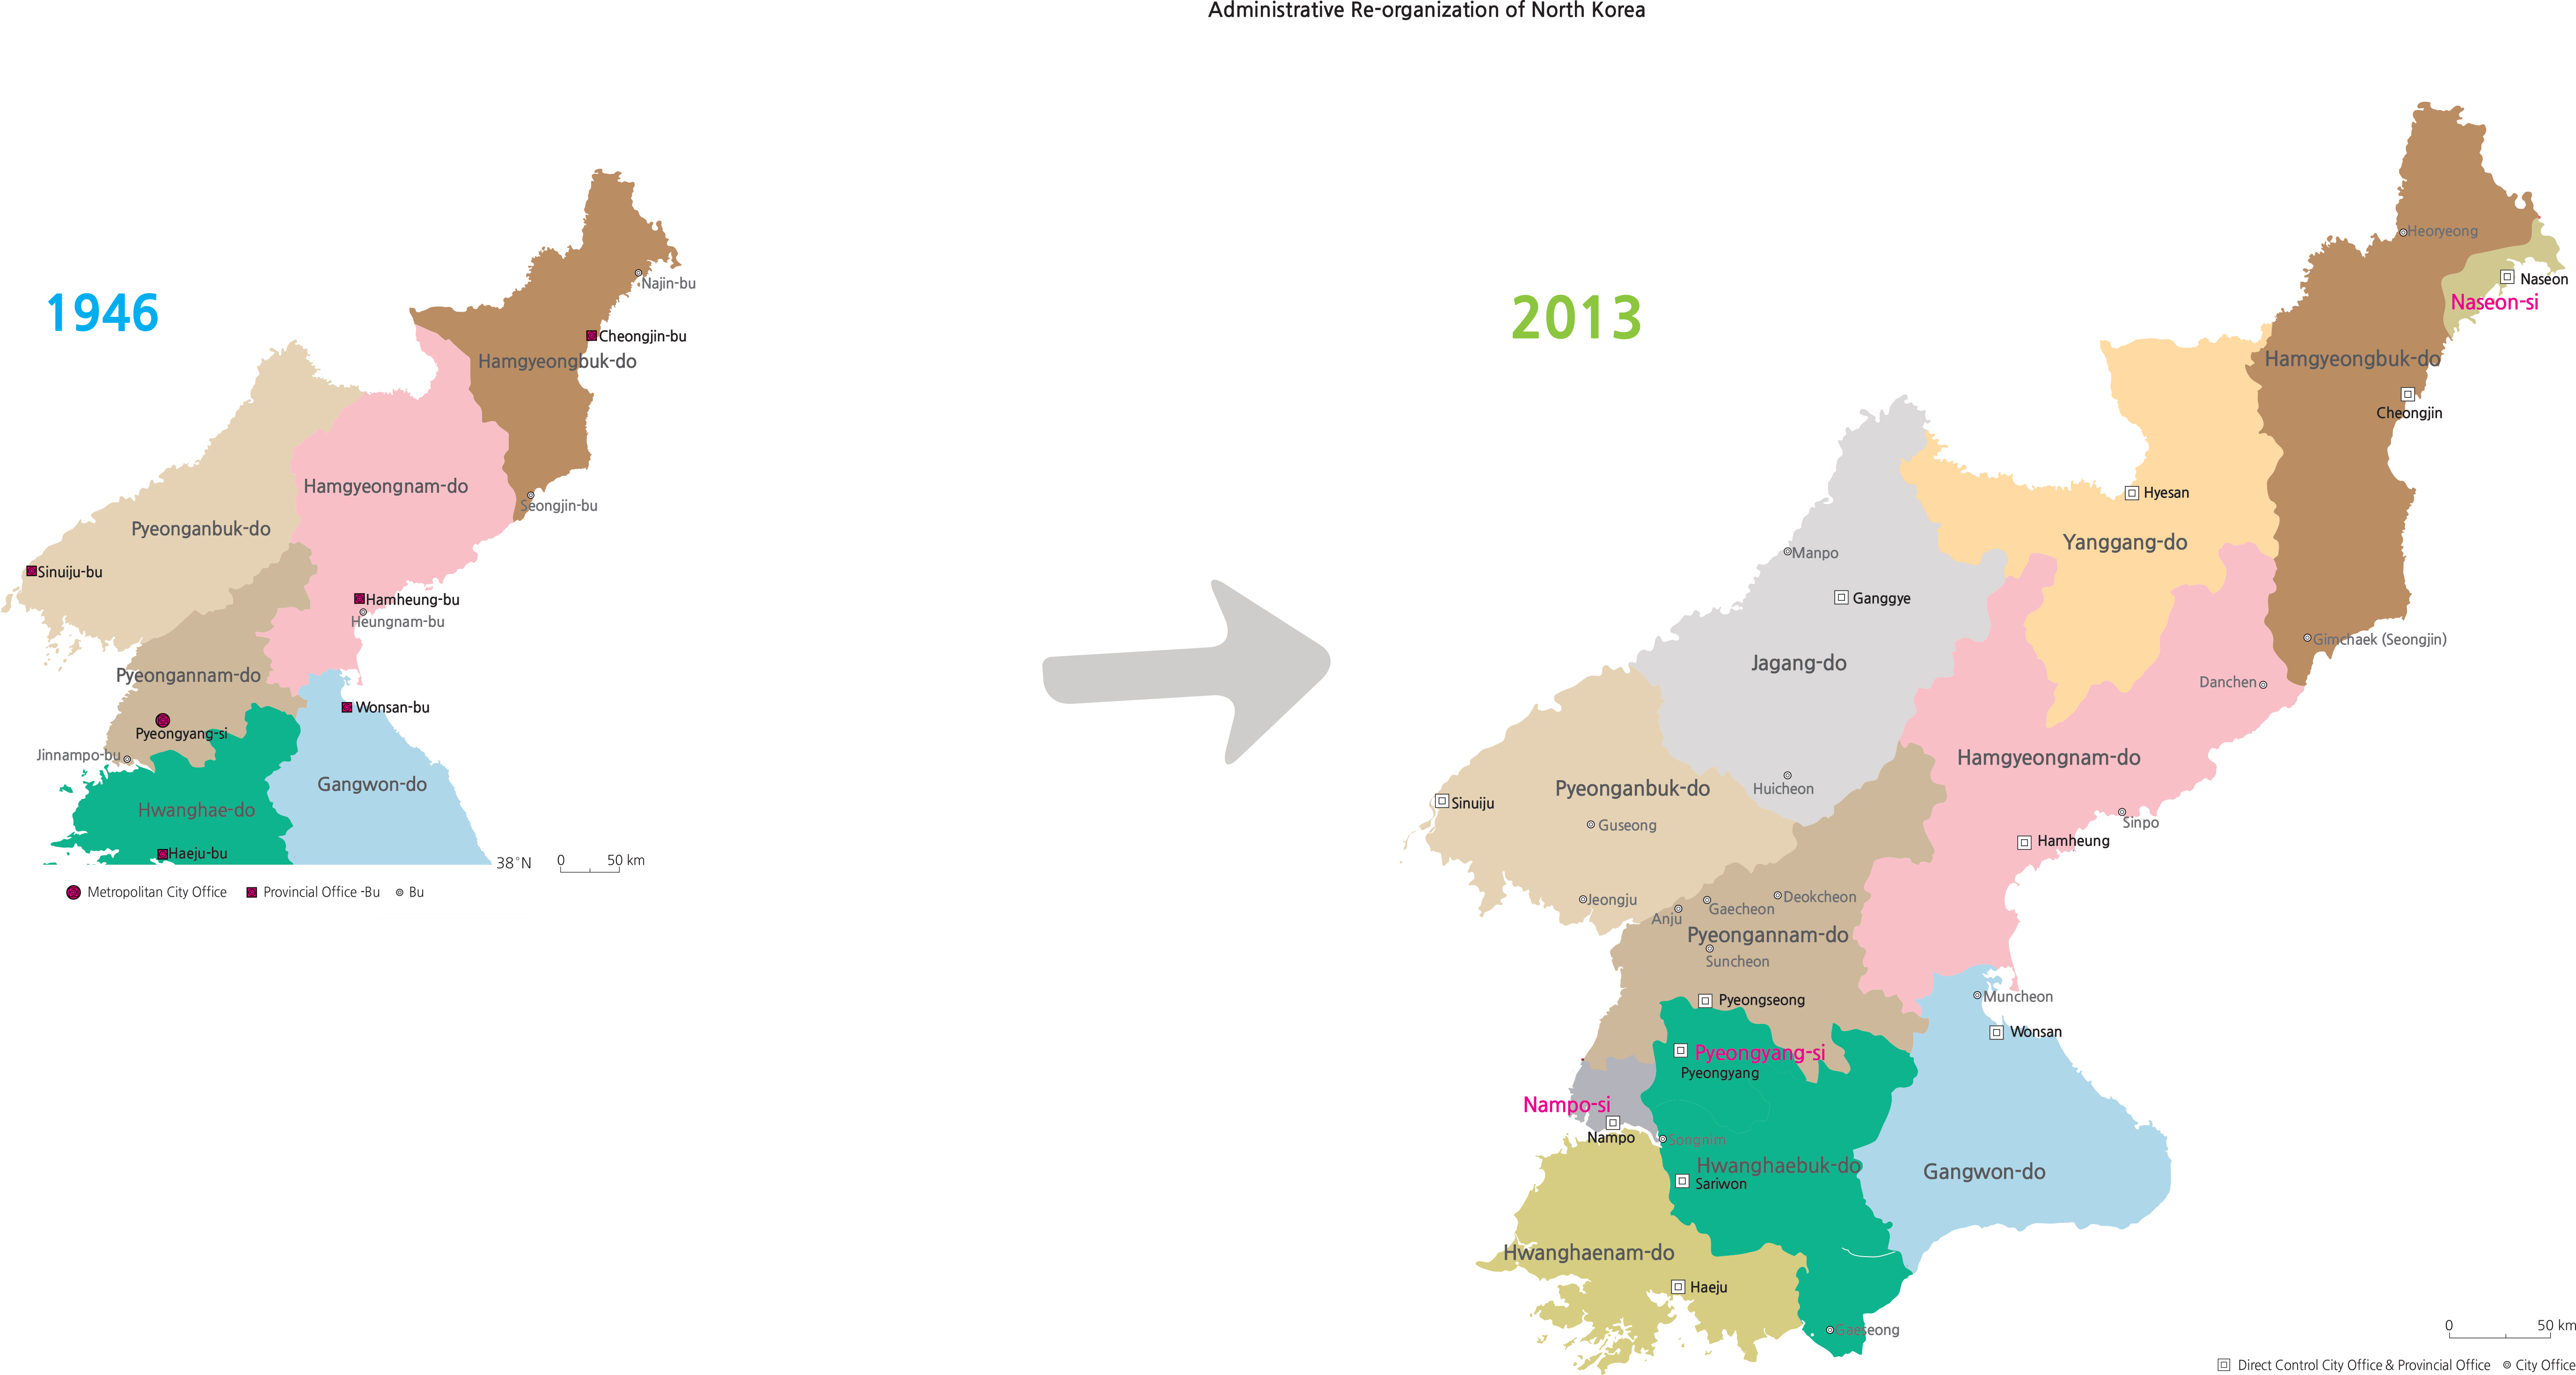
Brief Interpretation of the Maps
These two maps show the changes in administrative units between 1946 (immediately after North Korea’ liberation from Japan when there were six provinces) and 2013 (when there were nine provinces, one directlycontrolled city, Pyeongyang, and two Special Cities, Naseon and Nampo). These changes reflect the government’ progressive decisions to address a growing population since independence and the need to have more efficient and tighter control over the administrative units. Similar to South Korea, it also recognized the need to create special city units to deal with population concentrations in urban areas. Of particular prominence is the Special City of Naseon (also spelled Raseon) at the northeast corner where it shares a 16-kilometer border and railroad connection with Russia. At the northwest corner is the city of Sinuiju, which has a major road that connects to China.
Is the volatile political situation between North Korea and its neighbors a regional problem that is confined to East Asia? In this age of globalization, how would other world nations that have trade with North Korea be affected? North Korea shares an 800-mile border with China, a 16-kilometer (10 mile) border with Russia, and the DMZ with South Korea; if war and famine re-occur, where will starving refugees likely go?
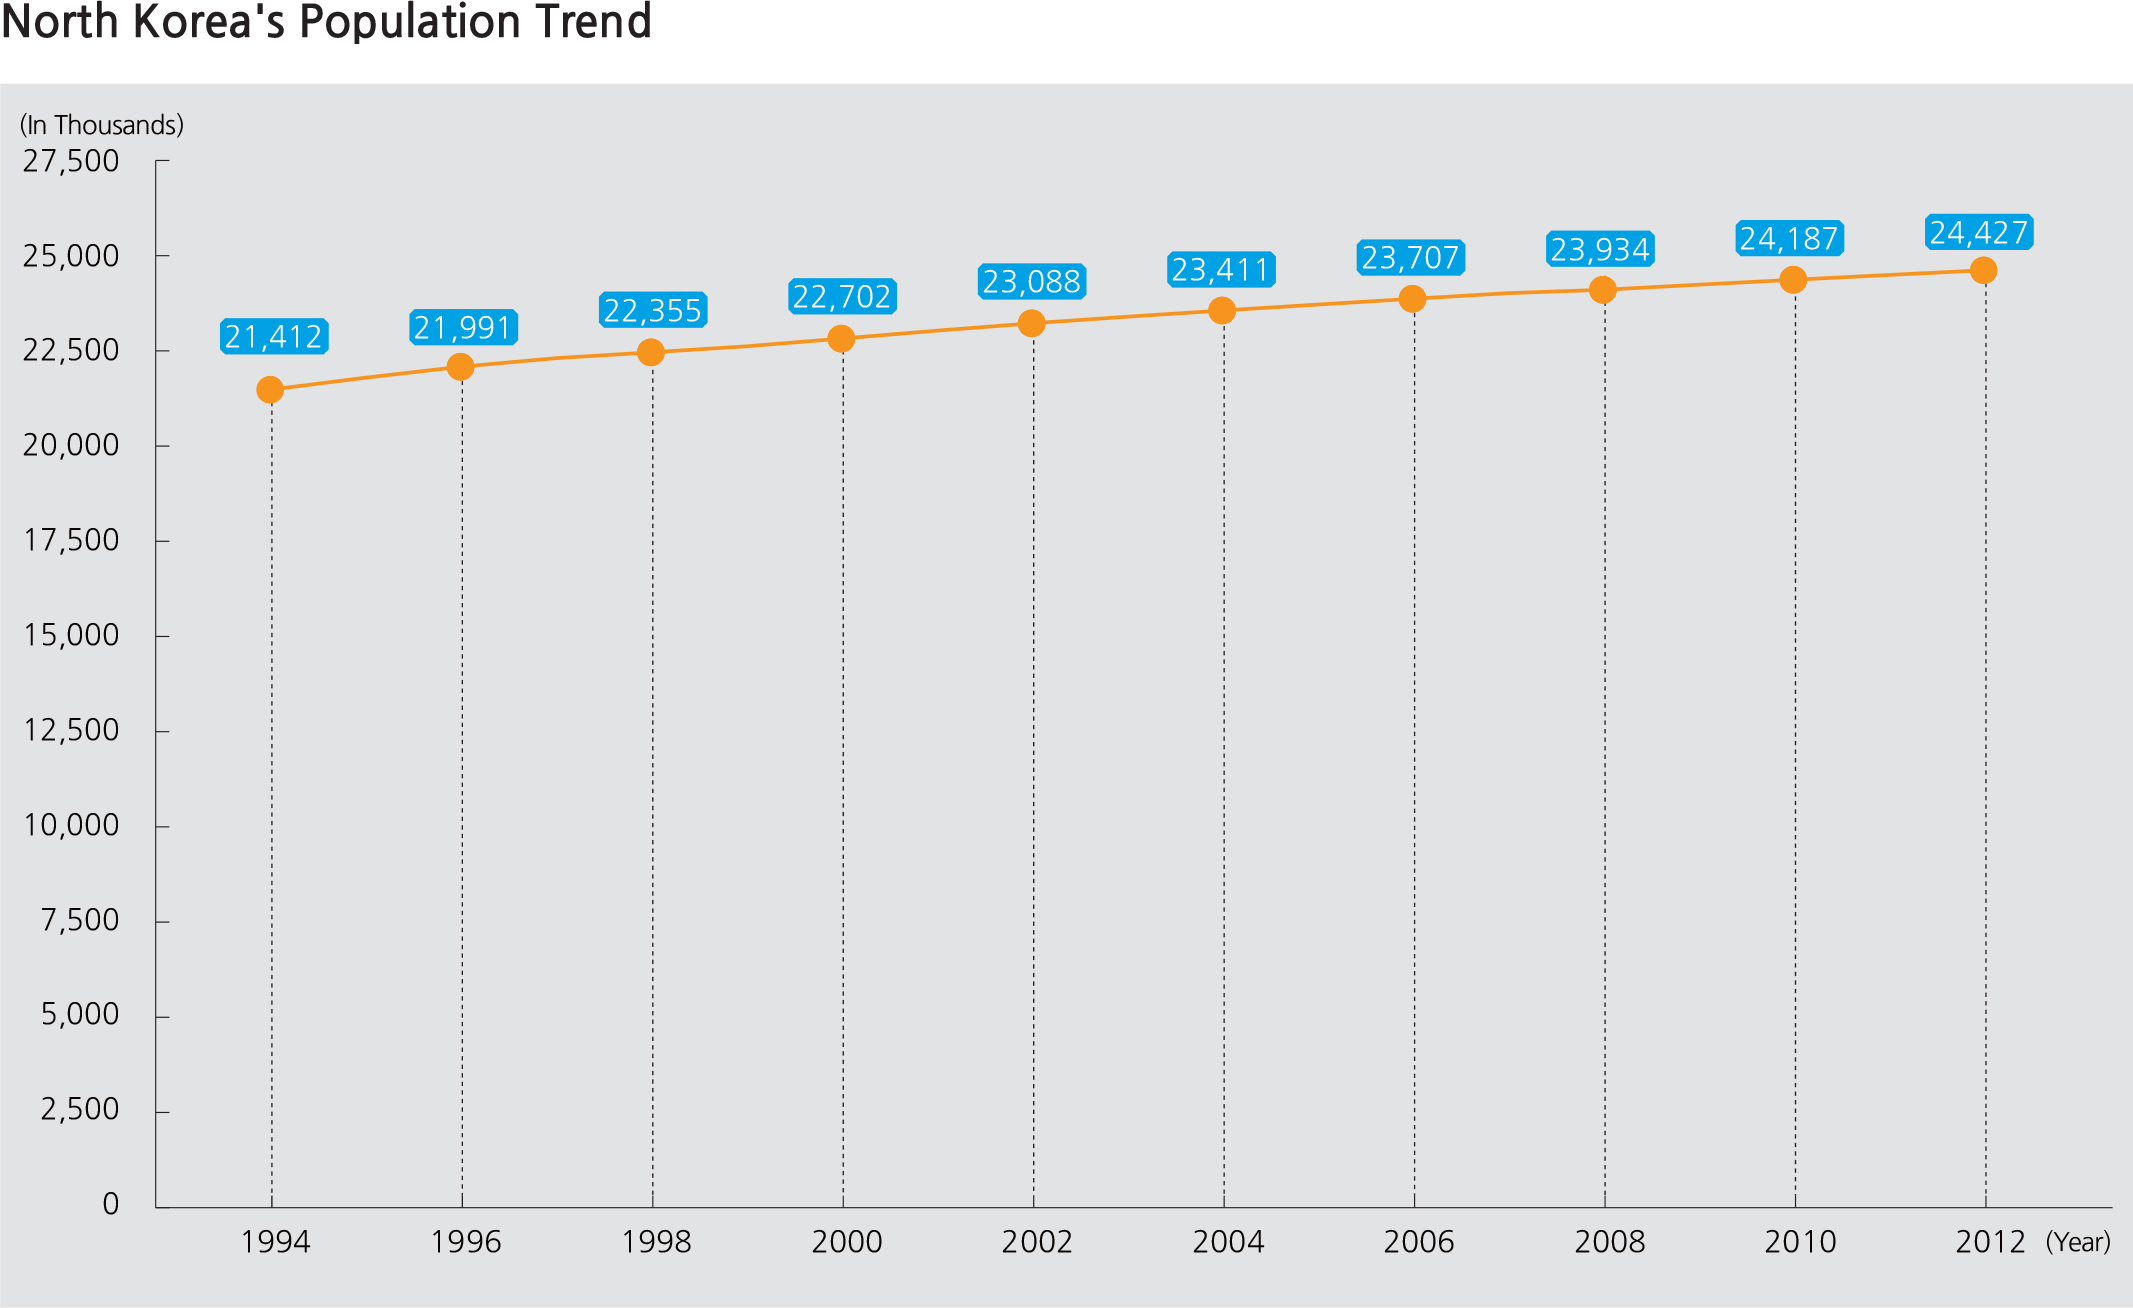
In 1946, a year after Korea’ liberation from Japan, the total population of North Korea reached 9.26 million. During the Korean War, the North’ population dropped to its lowest level at 8.49 million. By 1958, its population had grown continuously to surpass the ten million mark for the first time in history and it reached 20 million by the late 1980s. According to North Korea’s central statistics office, the country’ population recorded a net loss in 1992 for the first time. Since 1993, North Korea has shown an average annual population growth of 1% and its population finally exceeded 24 million in 2004.
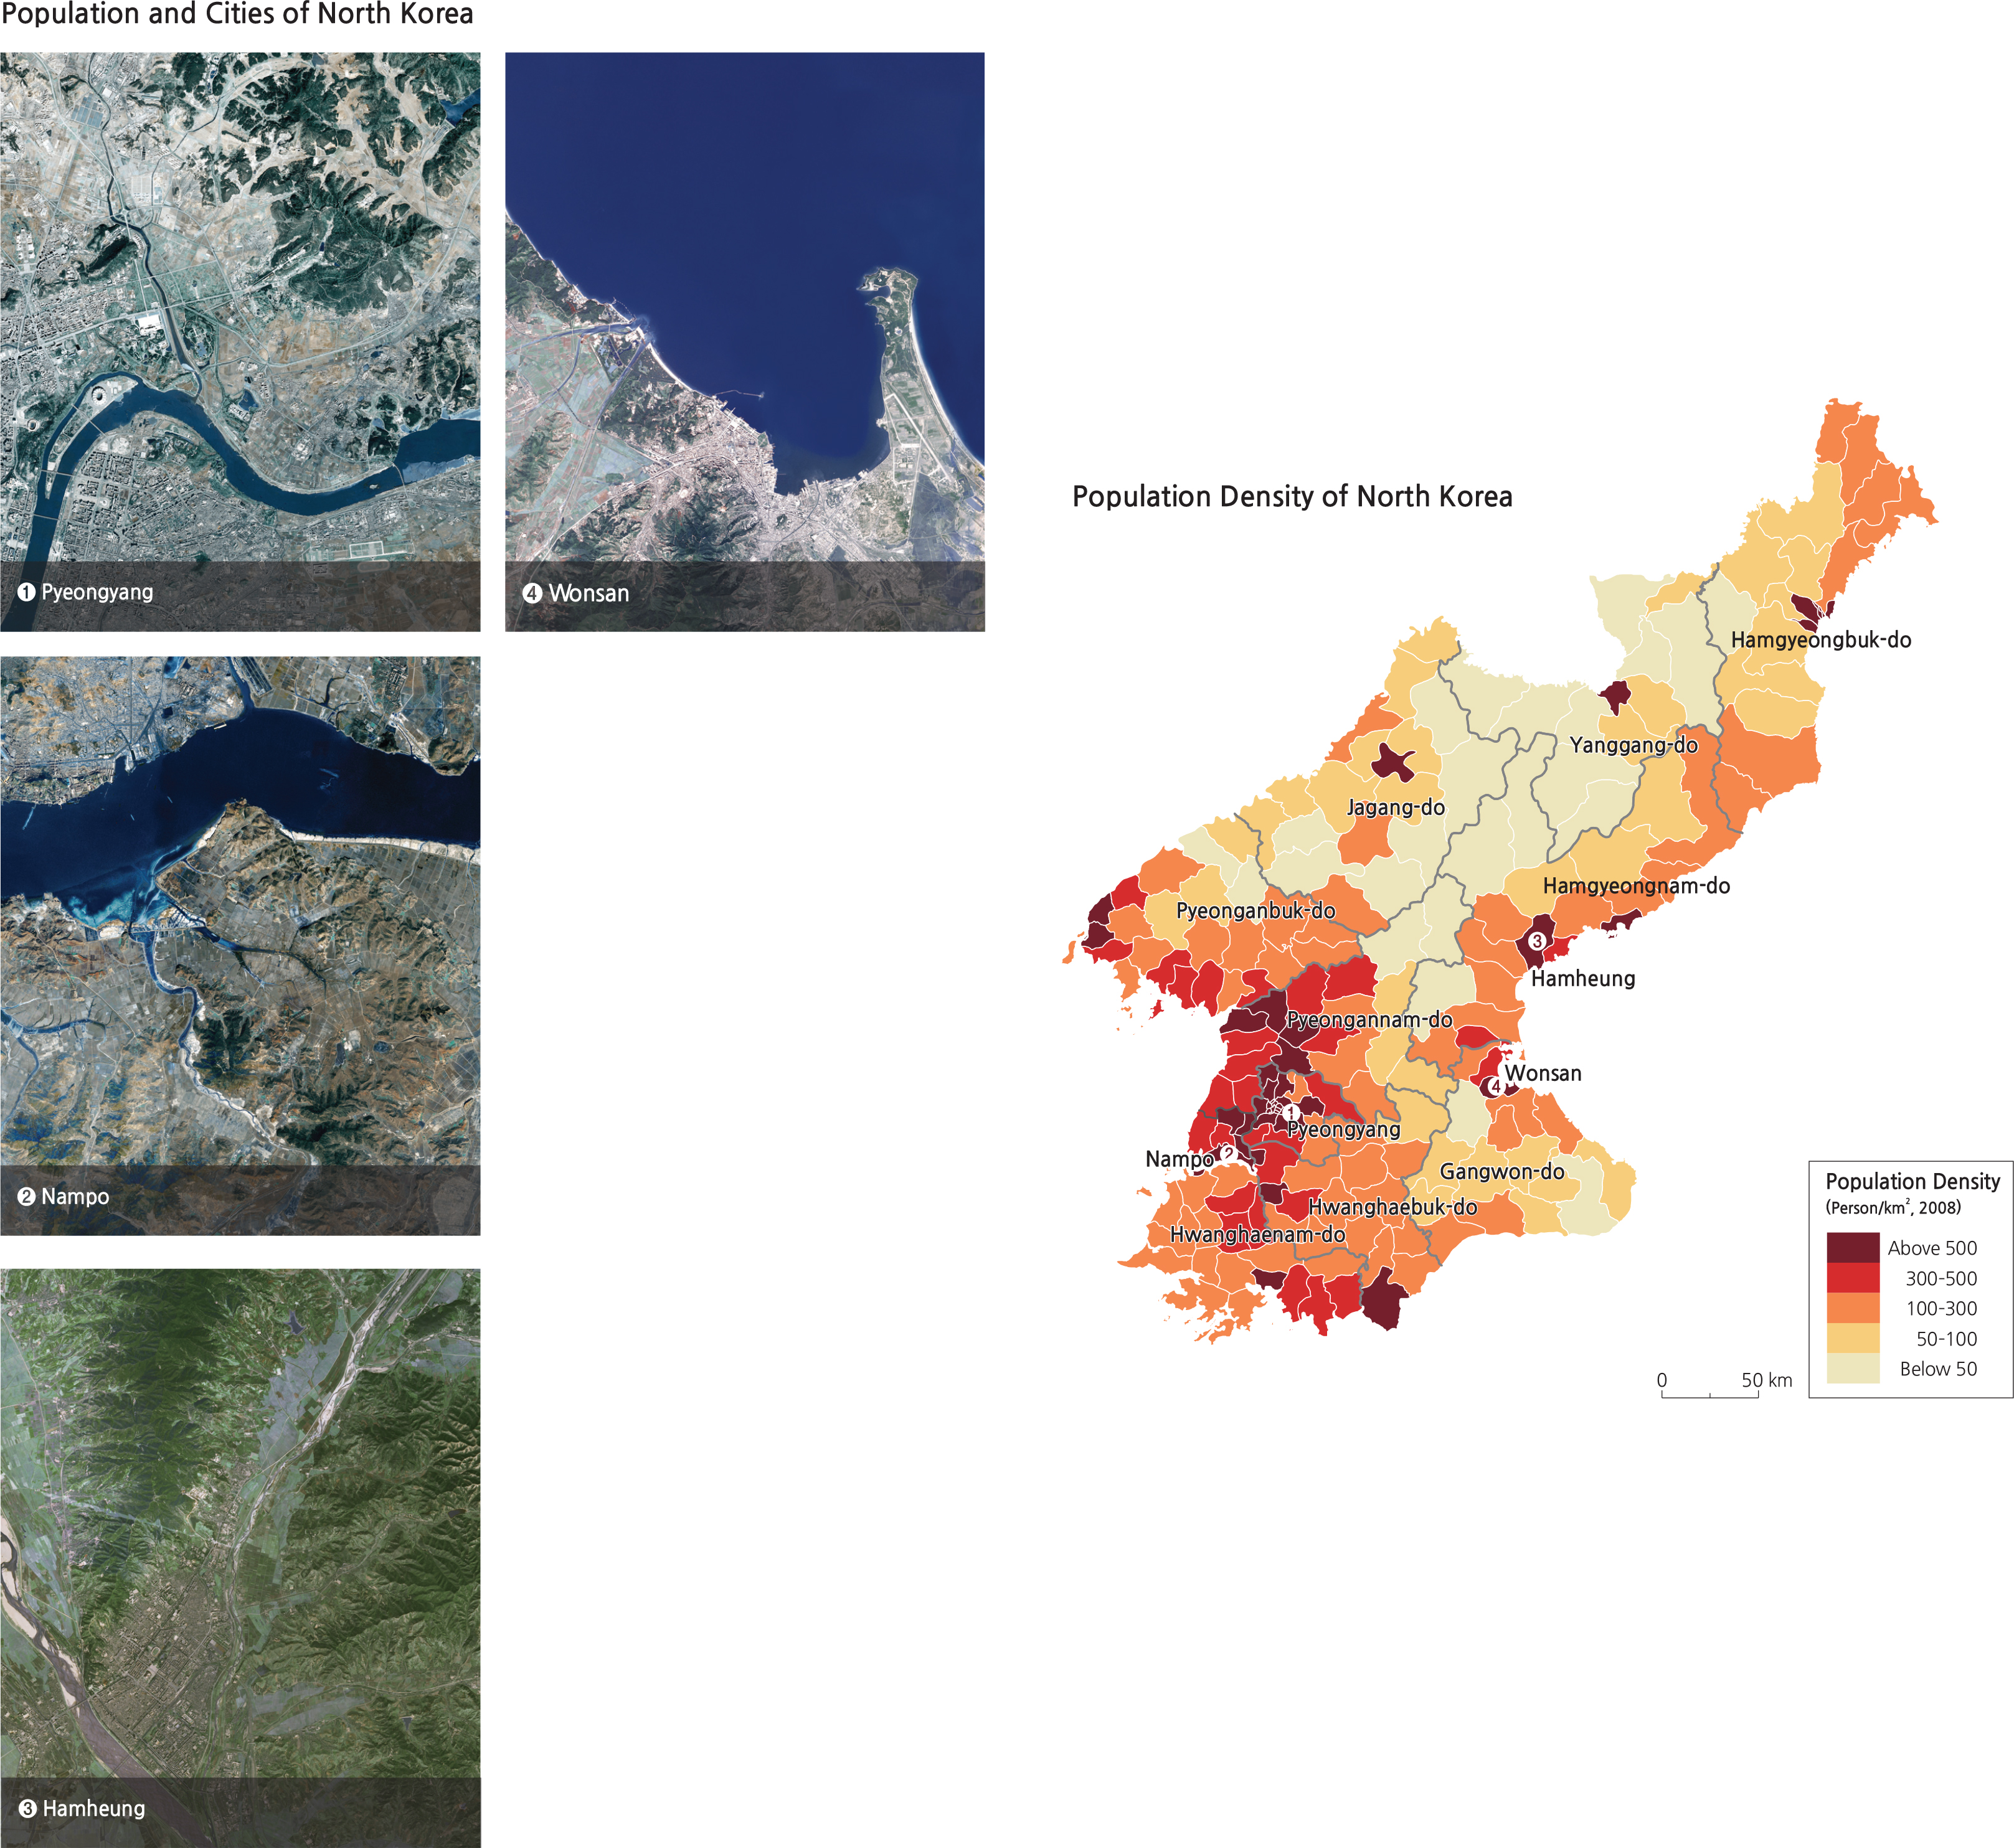
As shown on the map above, most North Koreans live in the southern and western parts of the country where the topography is gentle. Pyeongyang and neighboring Pyeongannam-do show the highest population density. In the mountainous northern and eastern parts, the population density is generally low, with the exception of scattered cities and the eastern coastal area.
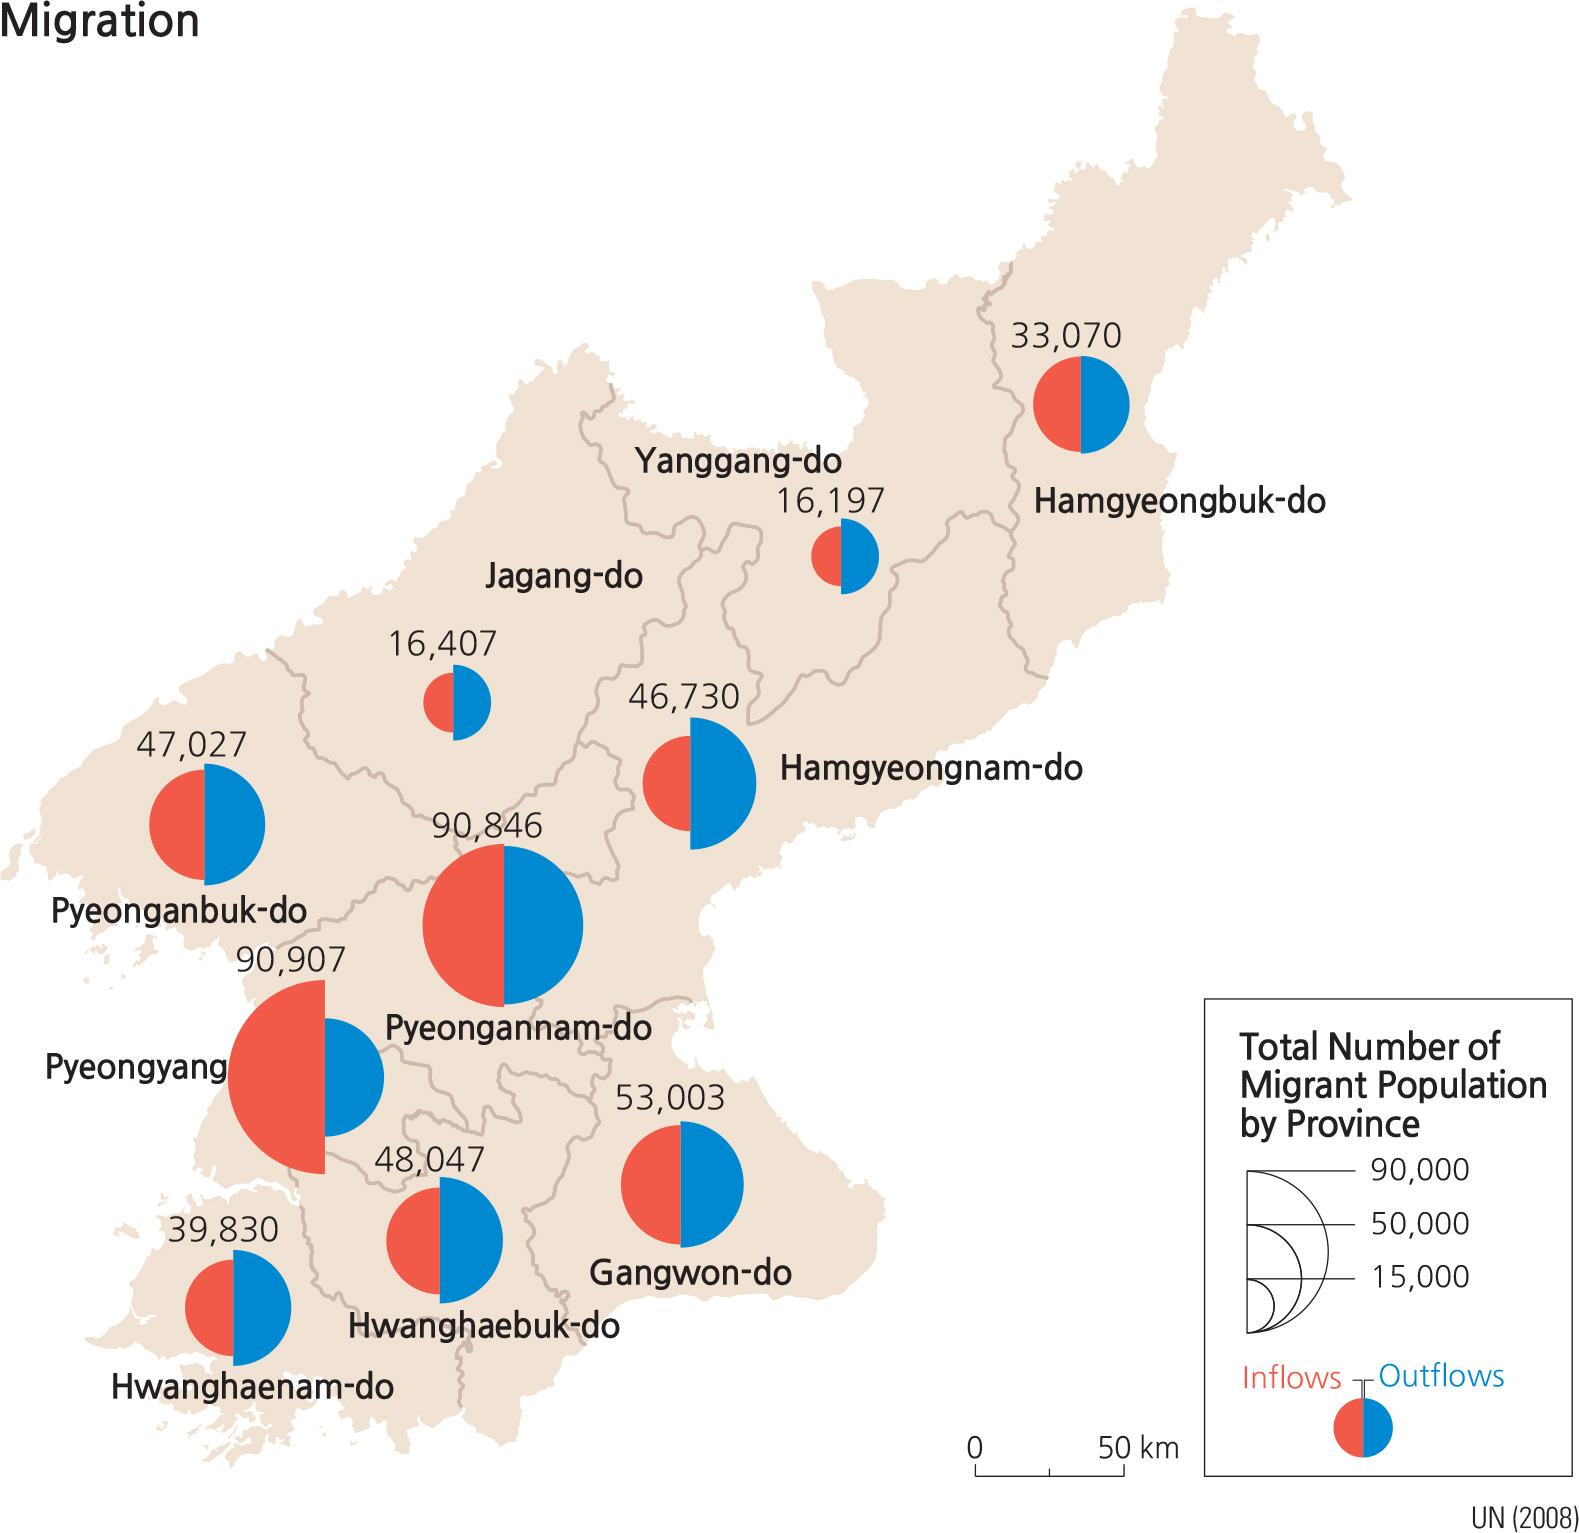
According to UN population census statistics for 2008, the internal migrant population above the age of five is less than 1% of the total population. This demonstrates that interregional migration is not common except in Pyeongyang and Pyeongannam-do, where the largest migrant population lives. Pyeongyang, in particular, boasts the highest percentage of migrants and highest incoming migrant population, which is 28.3% of the total. The city’ population out-migration accounts for 10.2% of the total. Besides Pyongyang, only Pyeongannam-do and Hamgyeongbuk-do have more people moving in than those moving out. All of the other regions are experiencing serious population out-migration. Hamgyeongnam-do, especially, has taken the biggest hit, with twice as many people leaving as those moving into the province.
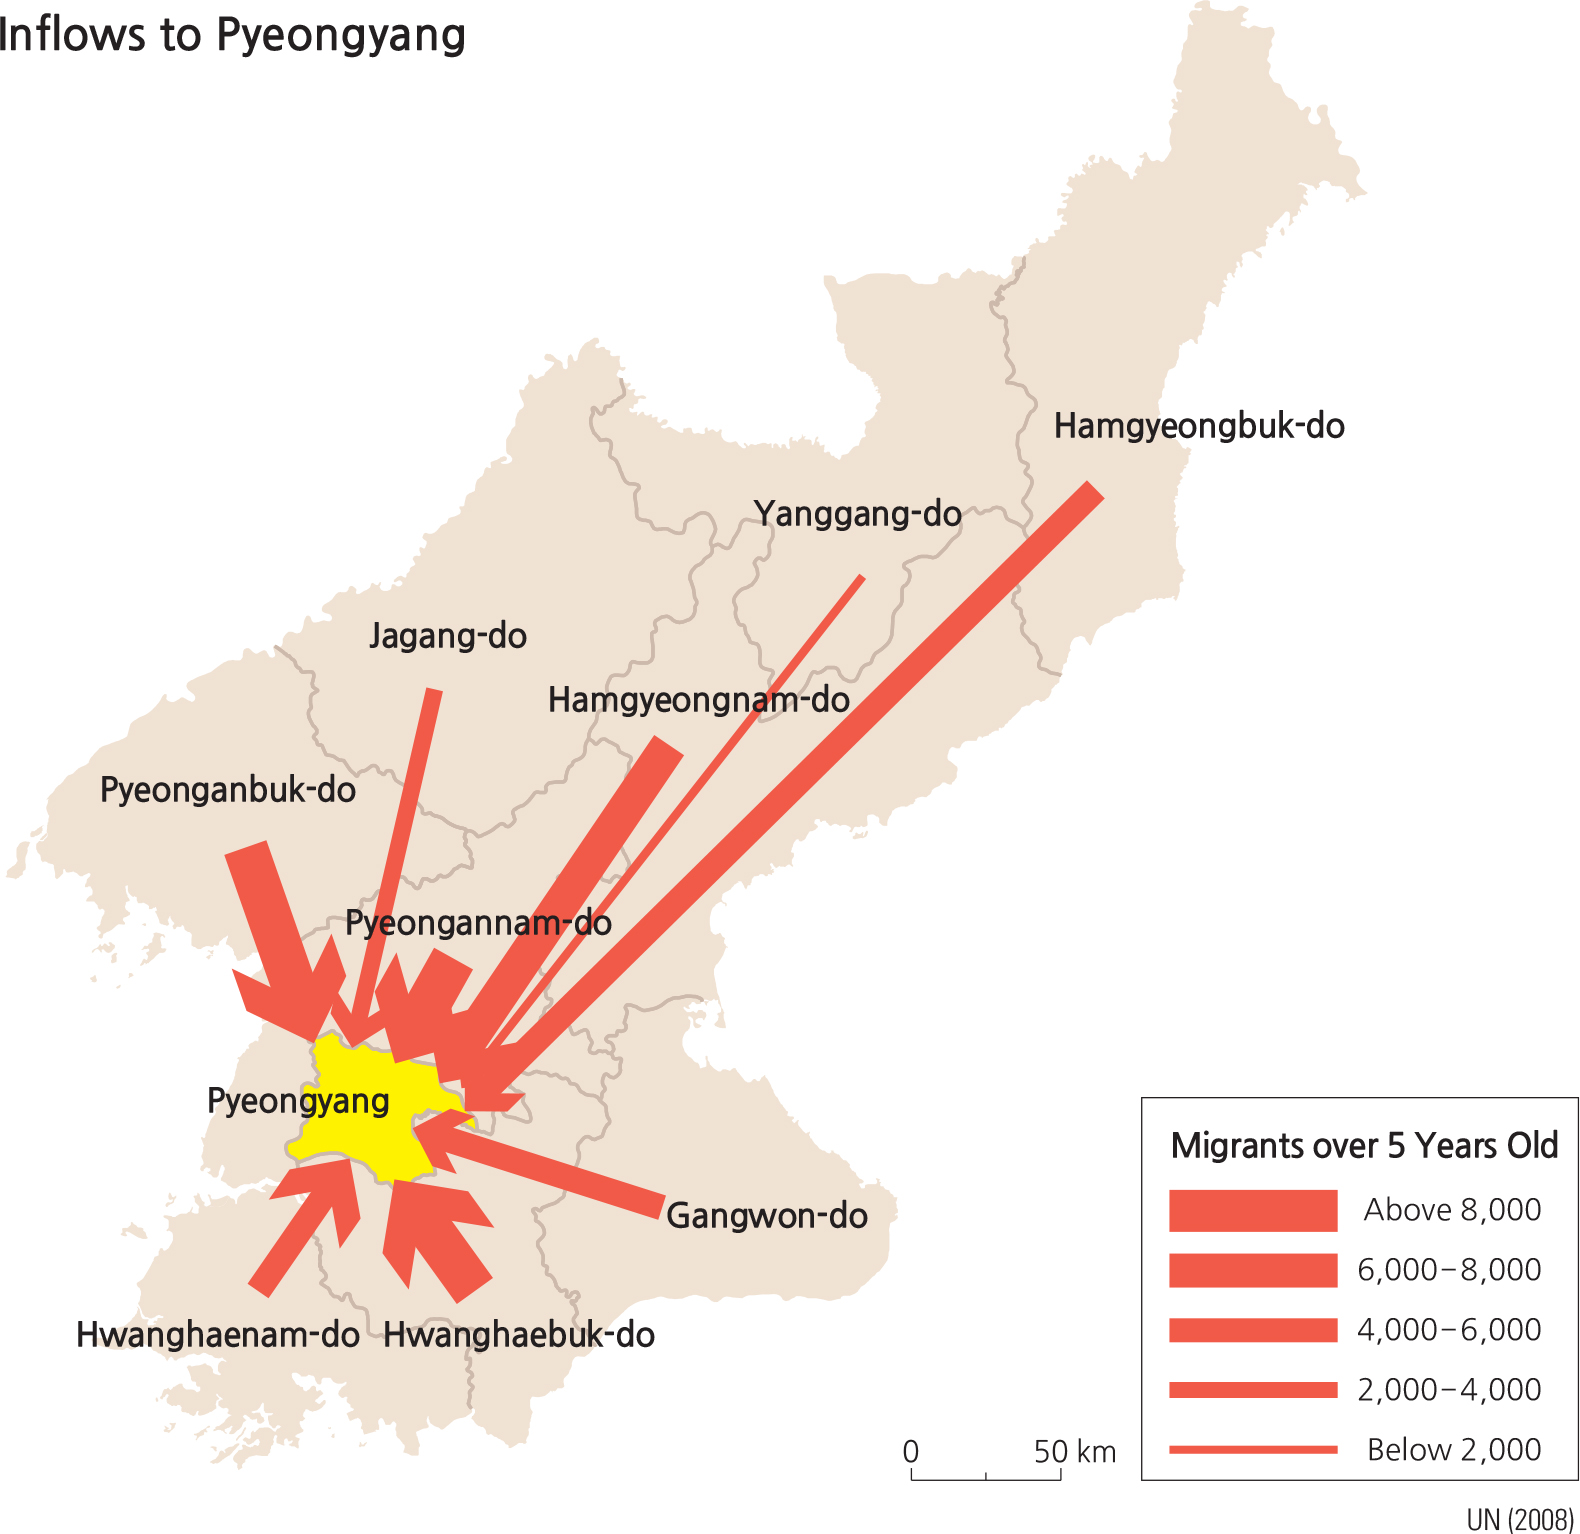
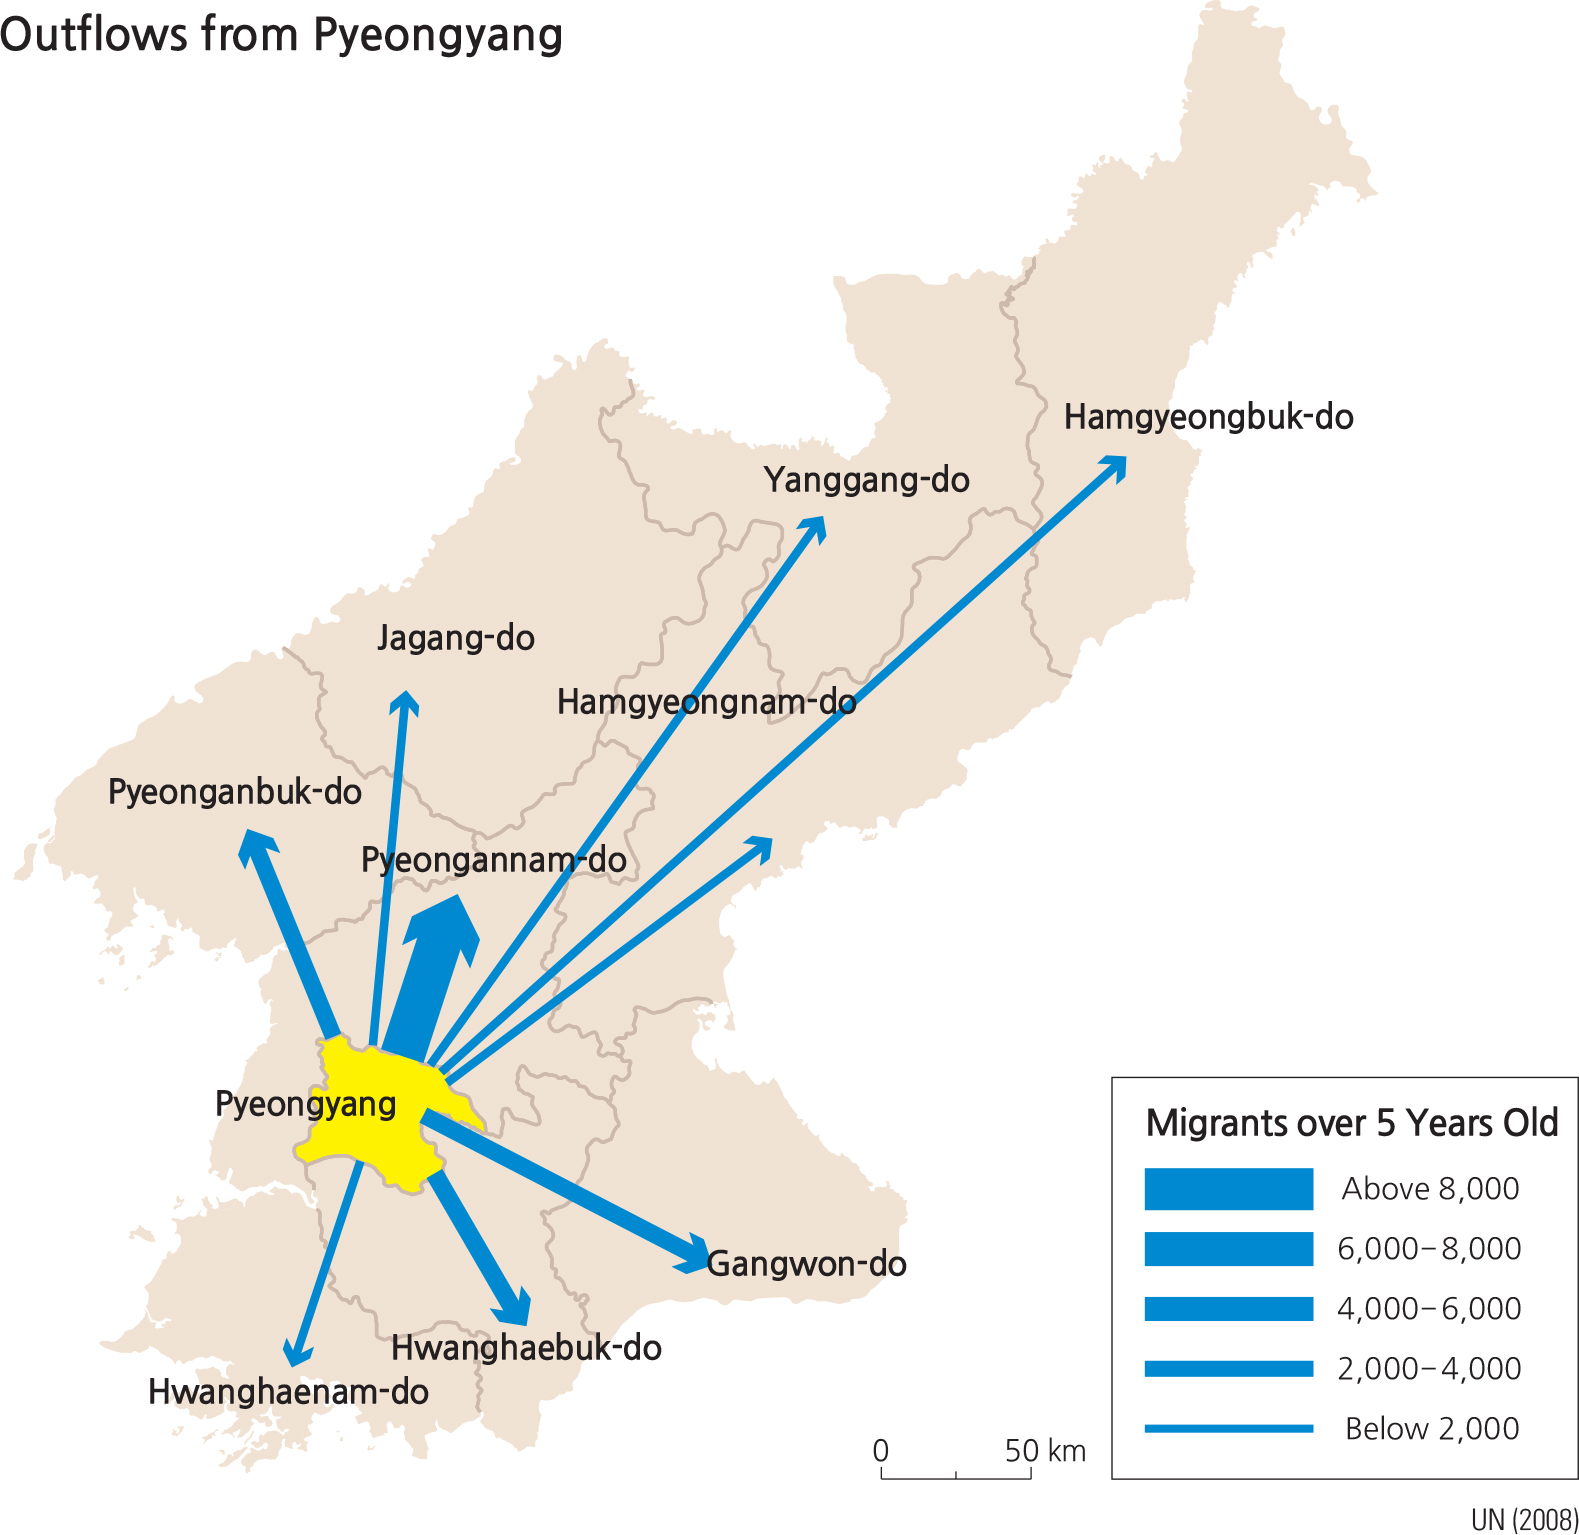
As for Pyeongyang, 30.2% of its incoming population is from Pyeongannam-do, followed by Hwanghaebuk-do (13.6%) and Pyeonganbuk-do (13%). Among those who
leave Pyeongyang, 40% choose to go to Pyeongannam-do. Pyeongyang’ population out-migration to other regions is generally evenly distributed. One of the interesting features of Pyongyang’ population movement is that a significantly small number of people move to Yanggang-do (0.01%) or Jagang-do (0.03%) compared to all of the other provinces. Similarly, the percentages of people moving from Yanggang-do and Jagang-do to Pyeongyang are only 0.03% and 0.04%, respectively. This trend may be a result of the fact that the two provinces have smaller populations. However, given that the similar-sized Province of Gangwon-do accounts for as much as 8.5% of Pyongyang’ incoming population and 14.3% of its outgoing population, the low migration trend for Yanggang-do and Jagang-do appears to be related to their socioeconomic conditions, as they are two of the most backward provinces in the country.
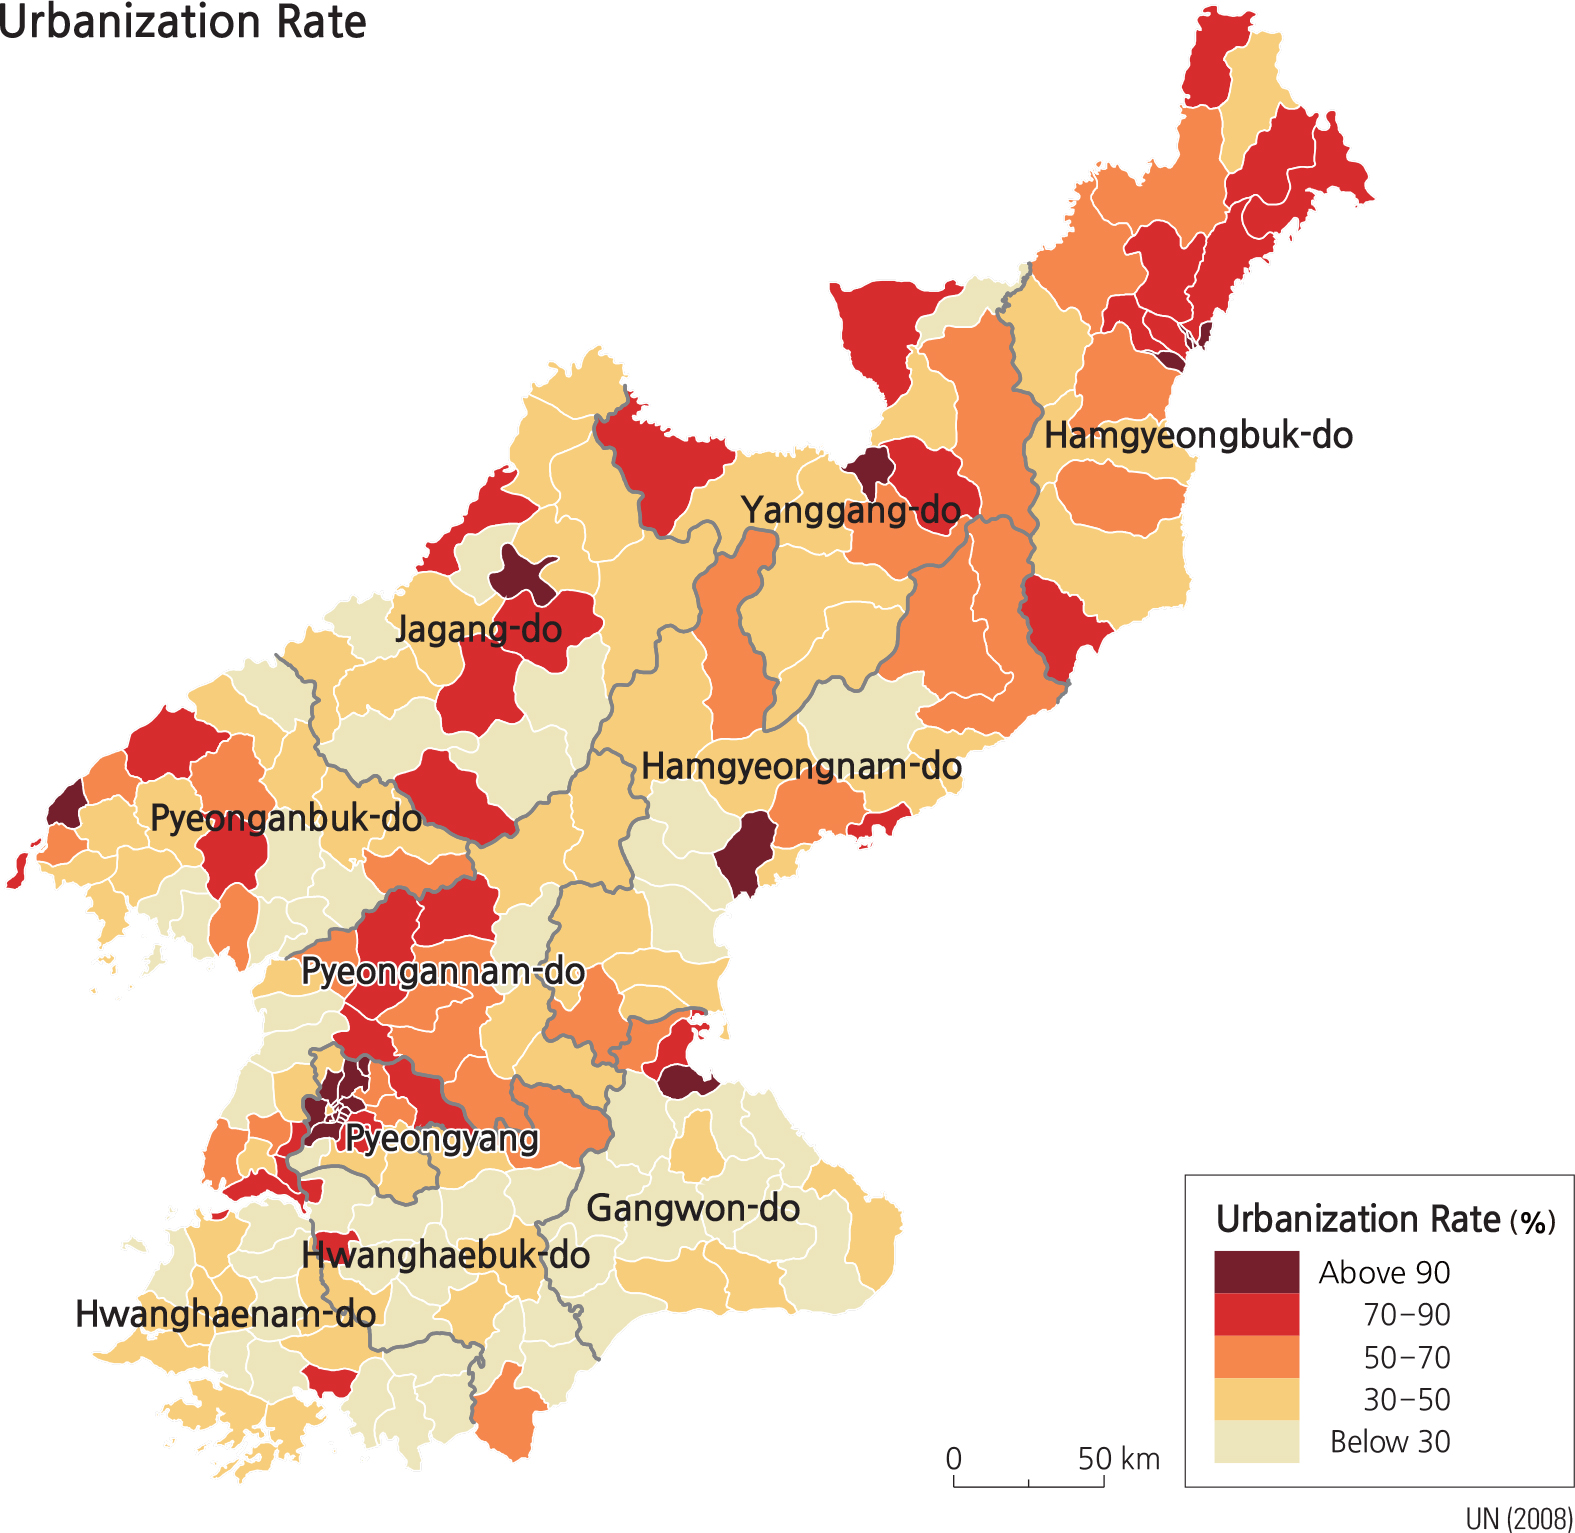
As of 2008, 64.6% of North Korea’ total population live in urban regions. Pyeongyang is the most urbanized area at 86.7%. Hamgyeongbuk-do, which has major cities such as the Najin-Seonbong (Rajin-Sonbong) Special Economic Zone and the city of Cheongjin, is the second most urbanized area with an urbanization rate of 70.7%, followed by Pyeongannam-do (64.9%) where the special city of Nampo is located. All of the other provinces, however, have a less than average urbanization rate. Regional inequality in urbanization is a serious problem.
North Korea once experienced rapid urbanization as it actively pursued industrialization right after Korea’ liberation from Japanese colonial rule in 1945. As a result, their urbanization rate jumped from 31% in 1953 to 56.7% in 1976; the pace has significantly slowed since then.
As of 2008, the population of Pyeongyang, the largest city in the North, stands at 3,255,000, followed by Hamheung in Hamgyeongnam-do (768,000) and Cheongjin in Hamgyeongbuk-do (667,000). Pyeongyang is the only city whose population is more than one million; only two other cities have more than 500,000 people, and only 18 other cities surpass the 100,000 mark.
North Korea’ ranking of its cities by its 1940 population was as follows: Pyeongyang, Cheongjin, Wonsan, and Hamheung. As Hamheung increased in size, the ranking changed in 1967 to: Pyeongyang, Hamheung, Cheongjin, and Wonsan. Then in 1982, Cheongjin became North Korea’ second largest city, and the ranking changed again to the following: Pyeongyang, Cheongjin, Hamheung, and Wonsan. During the 1990s, Hamheung regained its secondplace rank and Nampo showed rapid growth. As of 2008, the largest cities rank as follows (largest to smallest): Pyeongyang, Hamheung, Cheongjin, and Nampo.
The map shows that the two pillars of North Korea’ urban development are the Pyeongyang-Nampo region in the West and the Hamheung-Cheongjin region in the East. Among other cities, Hyesan, Ganggye, and Sinuiju in the northern area and Pyeongsong, Gaecheon, Suncheon, and Deokcheon in the central area boast high urbanization rates of over 80%.
Brief Interpretation of the Maps
This population density map was created with United Nations data (2008). The North Korean population exhibits a classic pattern of concentration in the western lowland plains, very sparse distribution along the northeast to southwest mountain chain, a few important cities along the narrow eastern coastline, and scattered cities at corners and borders with China and South Korea. Border cities that have concentrated populations include Gaesong in the south, Naseon near the Russia border, and Hyesan and Sinuiju along the Chinese border. The main population concentrations, however, are in the capital city of Pyeongyang and nearby coastal city of Nampo. Hamheung and Wonsan are large cities on the east coast.
The pattern of the Urbanization Rate Map is slightly different from the Population Density Map. This variation is due to the size of the area within the mapping unit in the density map and the number of urban dwellers in the urbanization map.
The density map includes both urban and rural people while the urbanization rate map excludes rural populations. The migration map with the graduated circles represents both the total number of people who migrate and the breakdown of in-migration and out-migration for each province. The blue half circles on the right represent outmigration while the red half circles on the left represent inmigration. If the red half circle is larger than the blue, that means the particular administrative unit gains more people than it loses. The map indicates that Pyeongyang is the only unit that has a net gain of migrants. This is confirmed by the two Pyeongyang migration maps showing the origins and destinations of migrants by volume.
The border cities have either railroad crossings or bridges for transportation with controlled access. While the border with South Korea is almost impenetrable to N. Korean citizens, the northern borders with China (800 miles long) and Russia (10 miles long) are easier to cross, legally or illegally. Frozen rivers in the winter make crossing easy. What happens to refugees during times of famine? Would North Korean refugees be more likely to cross into China or Russia? Why? What would likely happen to refugees who are caught?
While 64.6% of North Korea’ population is urban, South Korea’ population is over 90% urbanized. Can you suggest a reason for such a big difference? Most developed nations have a high urbanization rate because cities attract jobs and convenient services such as hospitals and schools. What can you conclude about North Korea’ 64.6% urbanization rate?
North Korea’s economy is a centrally planned and unified system in which the State Planning Commission of the central government announces economic development plans and strictly controls smaller economic units, such as regional governments, factories, and companies.
Along with a centrally planned system, another important feature of North Korea’s economy is that the country included plans to assign top priority to developing heavy industry with parallel developments in agriculture and light industry. Due to the lack of capital and resources, however, heavy industry was favored over light industry and agriculture. Favoring heavy industry and ignoring agriculture and light industry led to financial difficulties and food shortages in the mid-1990s. The North’s economy began to recover after 1999, but it has experienced an average annual negative growth rate since 2006.
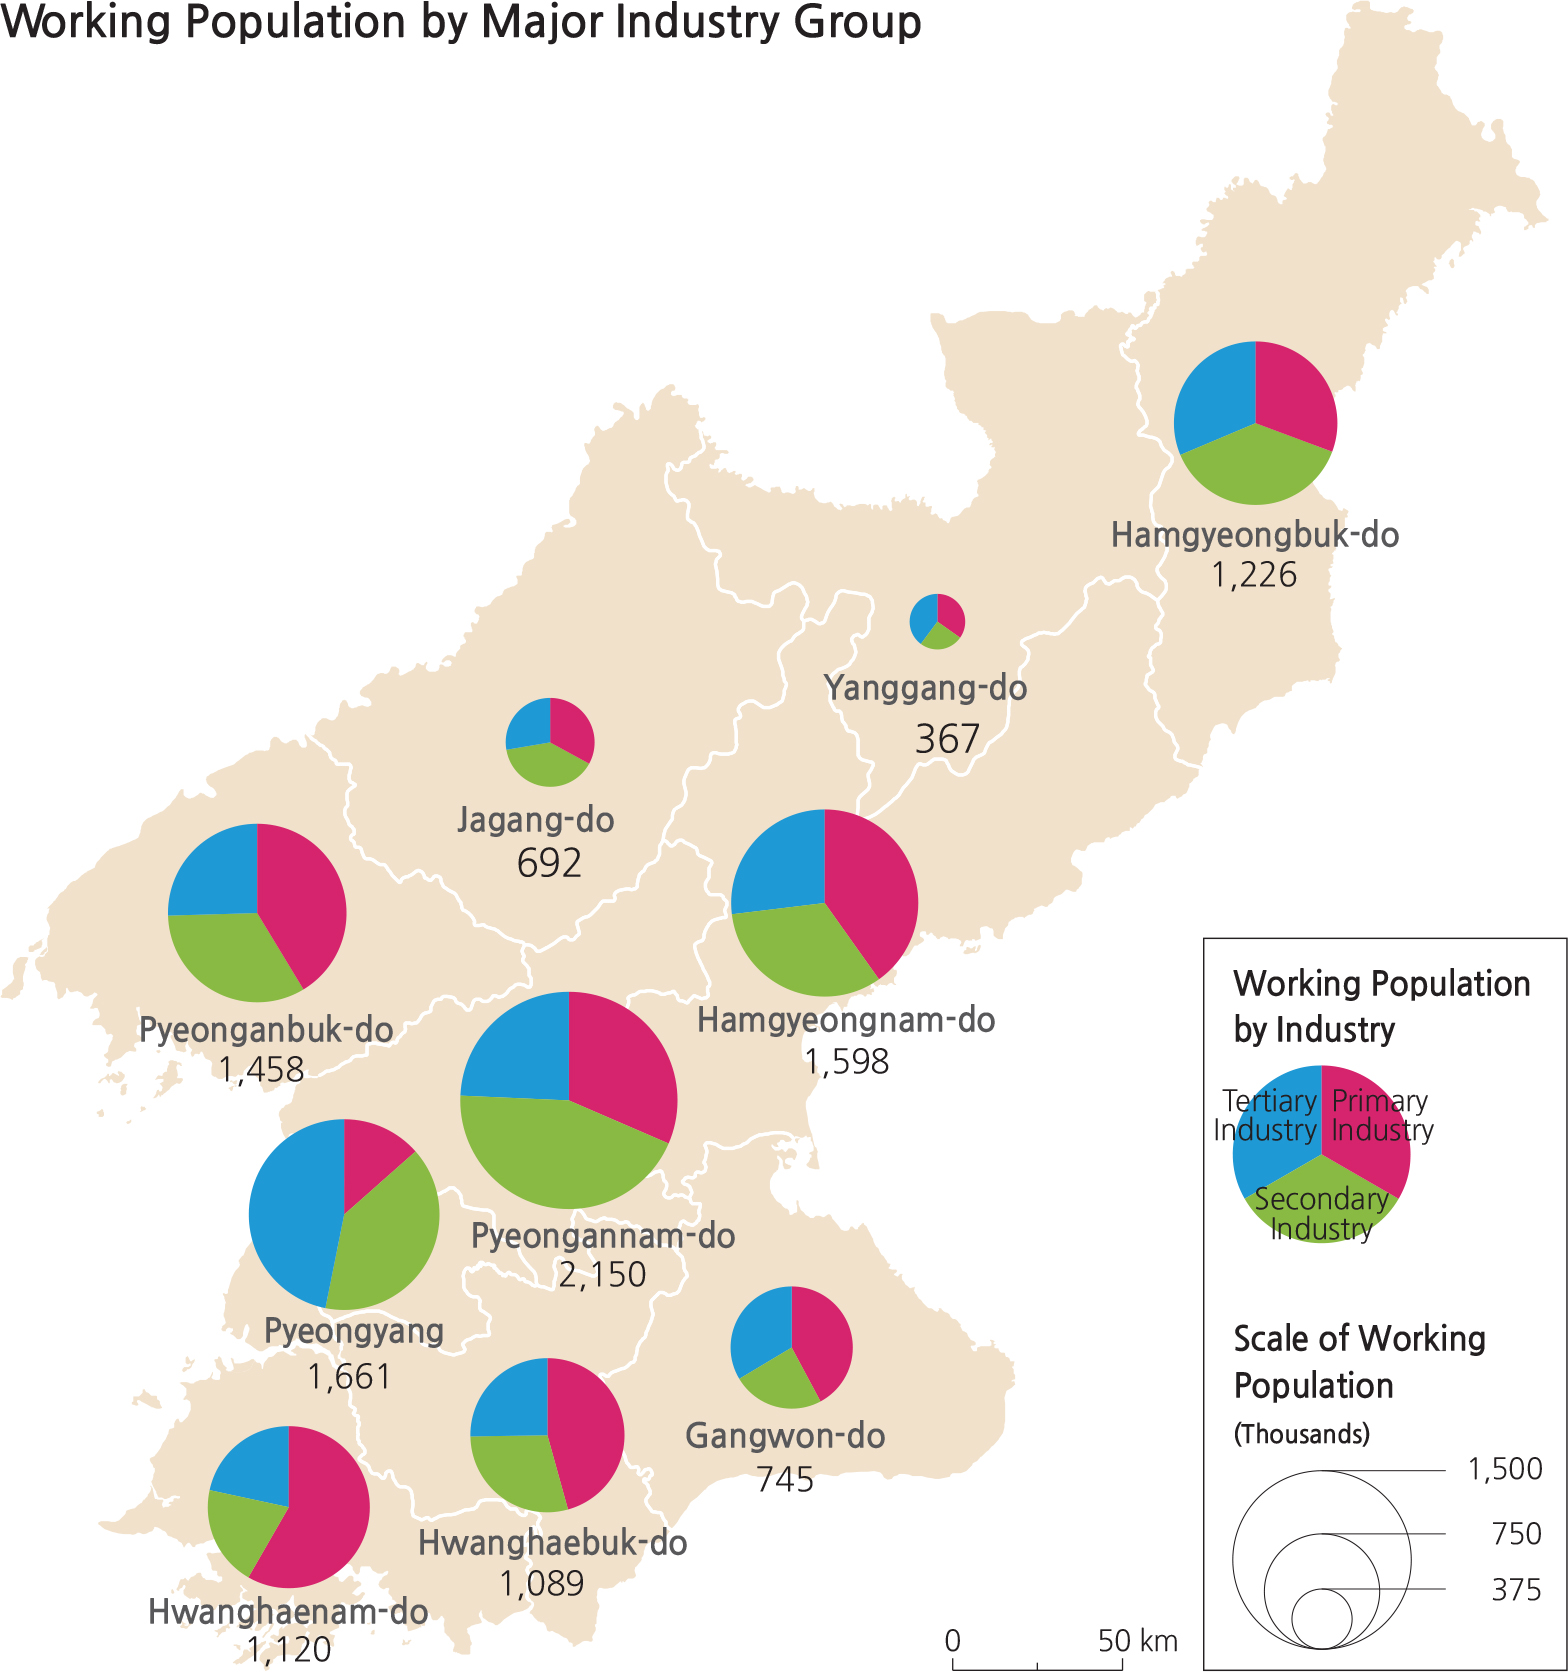
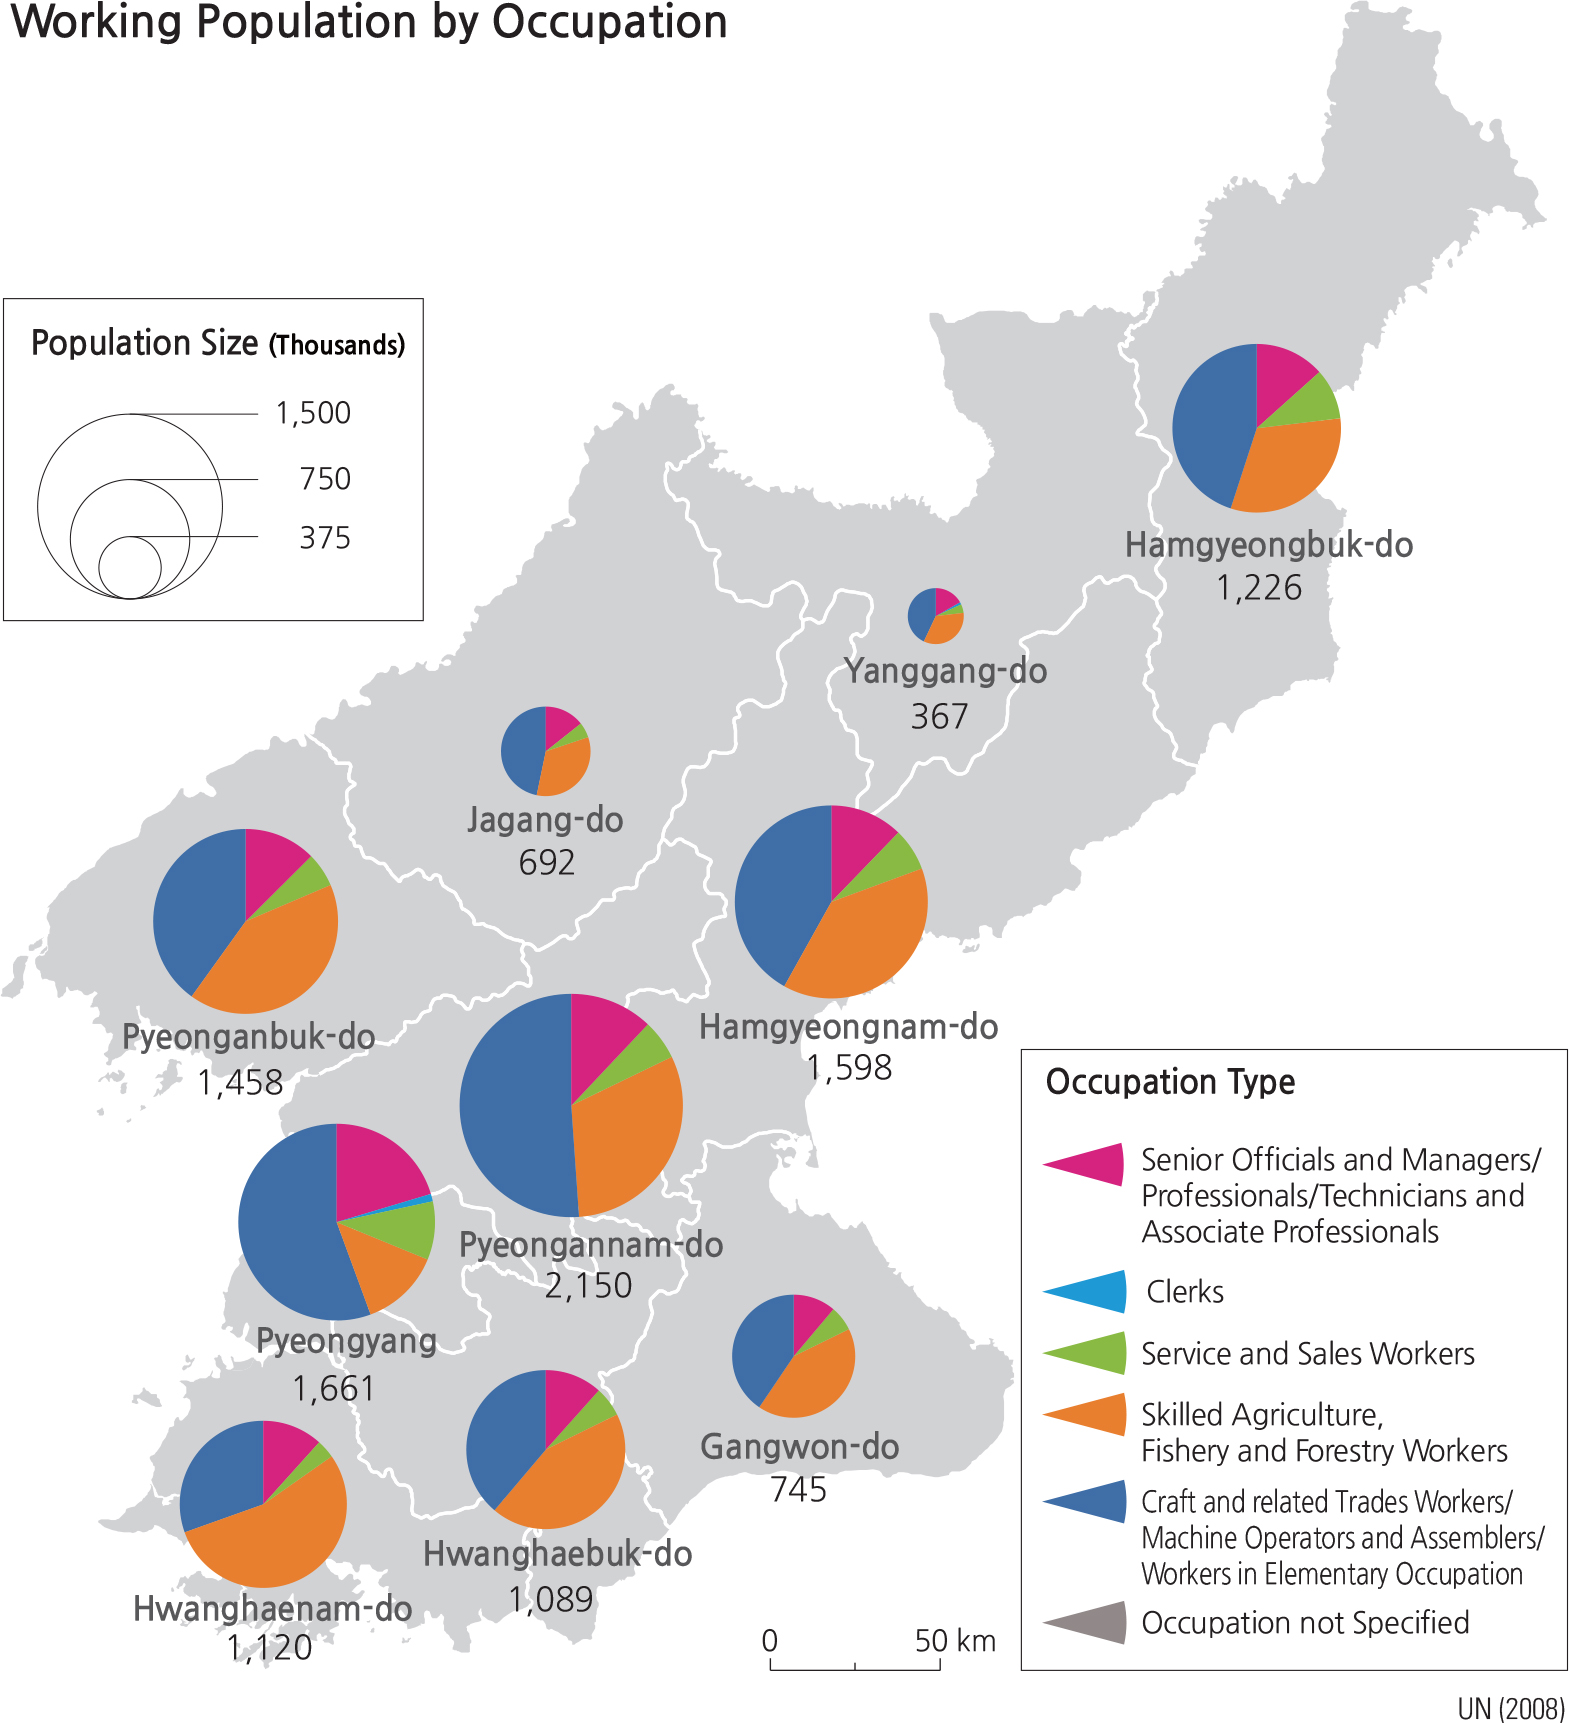
As of 2008, 36% of North Korea’s population has been working in primary industries, 34.3% in secondary industries, and 29.6% in tertiary industries. As for Hwanghaenam-do and Hwanghaebuk-do, the rice bowl of North Korea, the largest share of the population is working in primary industries, with a rate of 58.1% and 45.6%, respectively. In Pyeongannam-do, the largest proportion of people (44.3%) is laboring in secondary industries because this province has the largest coal deposits in North Korea. In addition, major industrial facilities, such as Cheollima Steelworks, the Daean heavy machinery factory, and the Nampo smelting factory are located in the city of Nampo. North Korea’s service industry has generally posted slow growth with the exception of Pyeongyang.
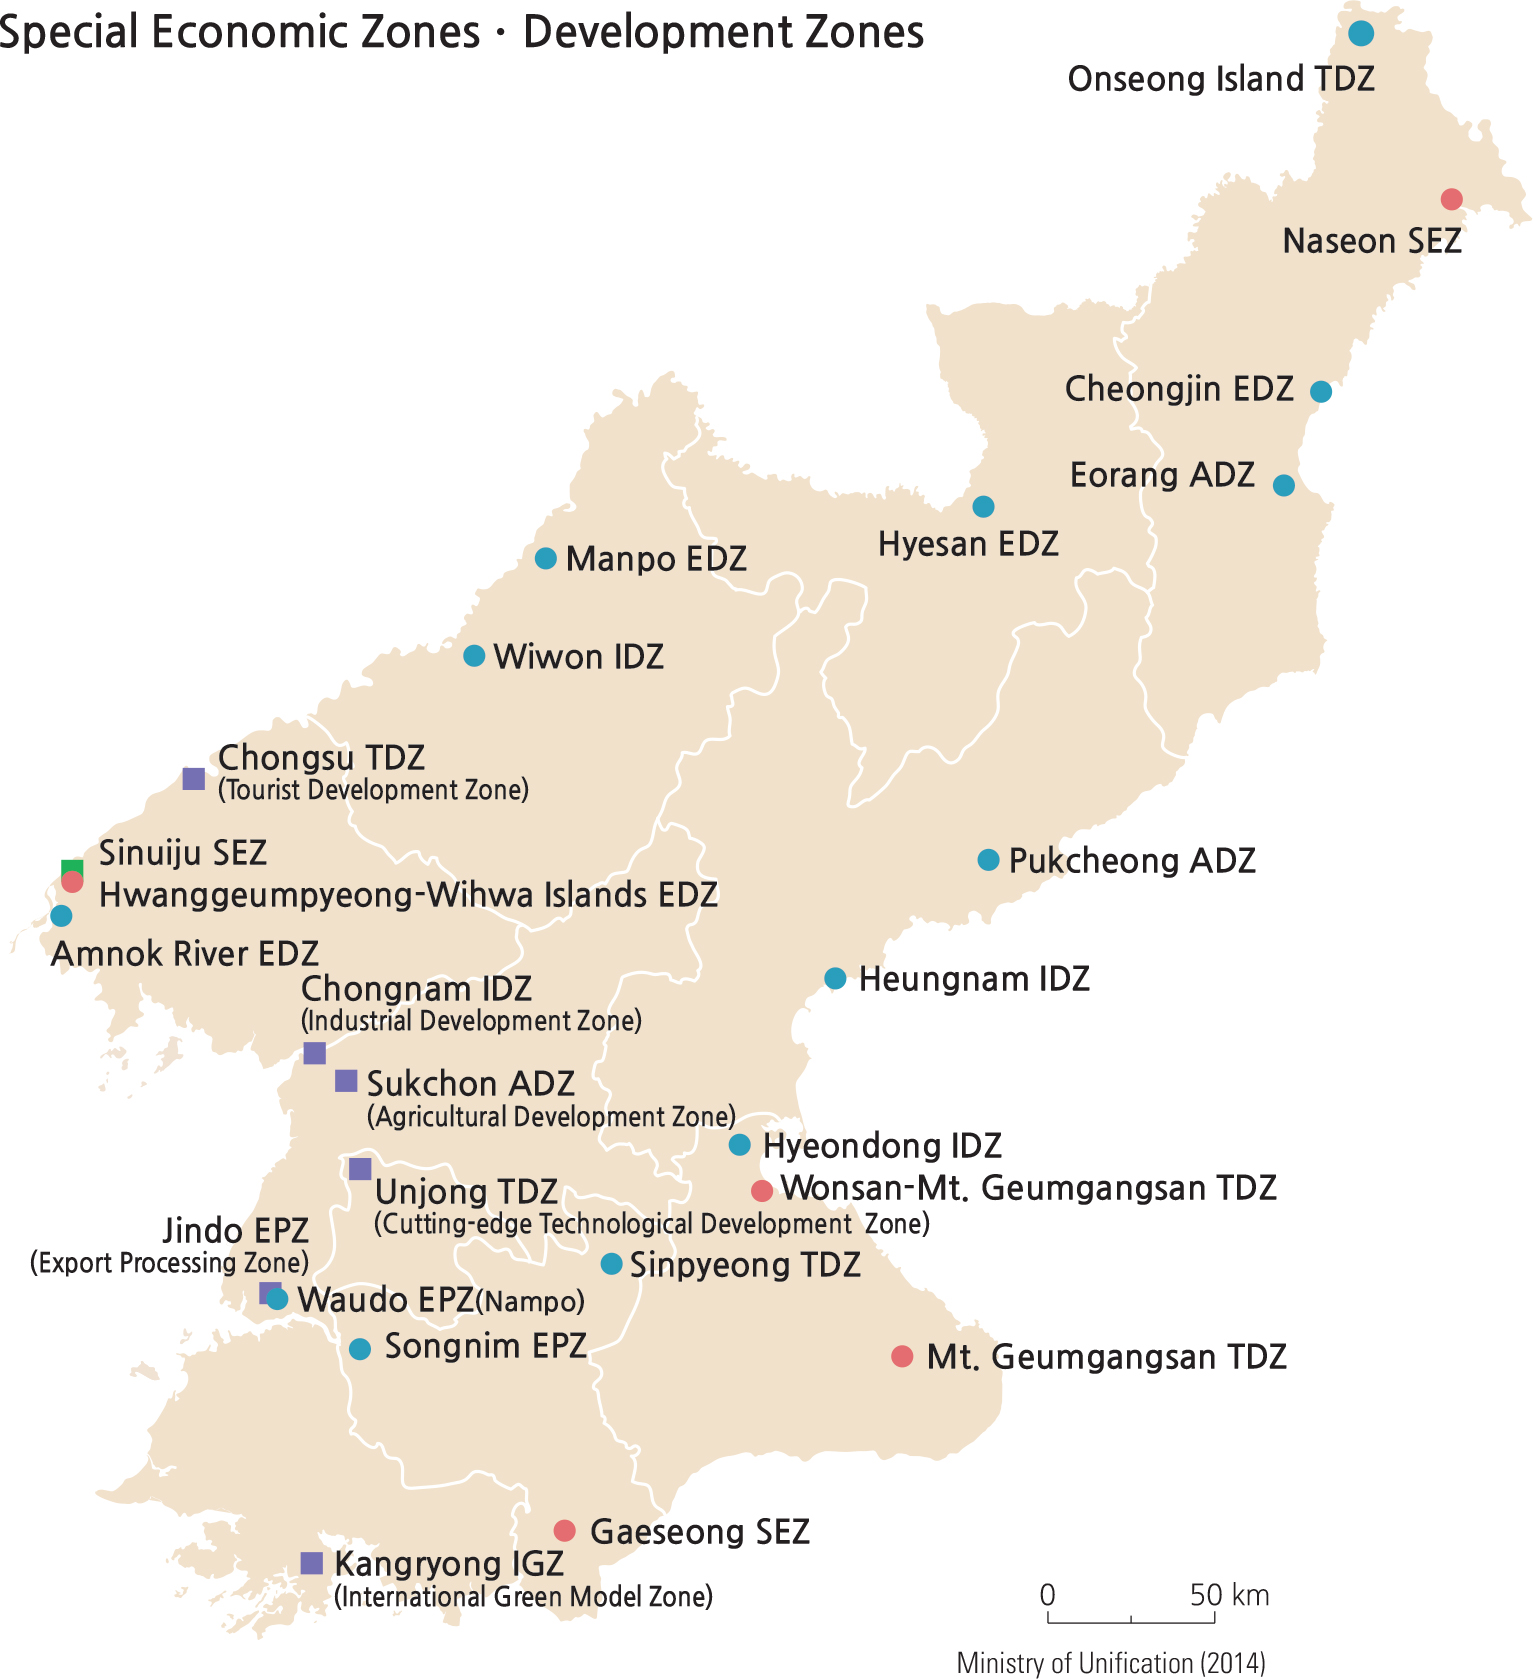
One of North Korea’s most important goals is for its economy to be self-sufficient, but unfortunately this goal imperatively led the nation to underestimate the importance of economic cooperation with foreign countries. As a result, North Korea imported a minimum amount of indispensable raw materials, mostly from former socialist countries. When it realized the inefficiency of this policy, it began economic cooperation with other foreign countries, a process North Korea has engaged in since the 1970s. In 1991, the first Special Economic Zone was established in Najin-Seonbong to more aggressively attract foreign capital. In September 2002, Sinuiju, near the border with China, was designated as a special administrative zone. In October of that year, the Gaeseong Industrial Complex was promoted to a Special Economic Zone, followed by the Geumgangsan area in November. In January 2010, North Korea promoted the Najin-Seonbong Special Economic Zone to a Special City. North Korea is now cooperating with China to develop the Najin-Seonbong region along with the Hwangguempyeong-Wihwado Special Economic Zone near the Amnokgang. With the enactment of the “Economic Development Zone Act,” North Korea announced 13 economic development districts to attract foreign investment, with Sinuiju being designated as a new special economic zone. In November 2013, North Korea announced its intention to set up another development zone in Gaeseong, the Gaeseong Hi-Tech Industrial Park. In July 2014, North Korea designated six more economic development zones, including the Unjong cutting-edge technological development zone.
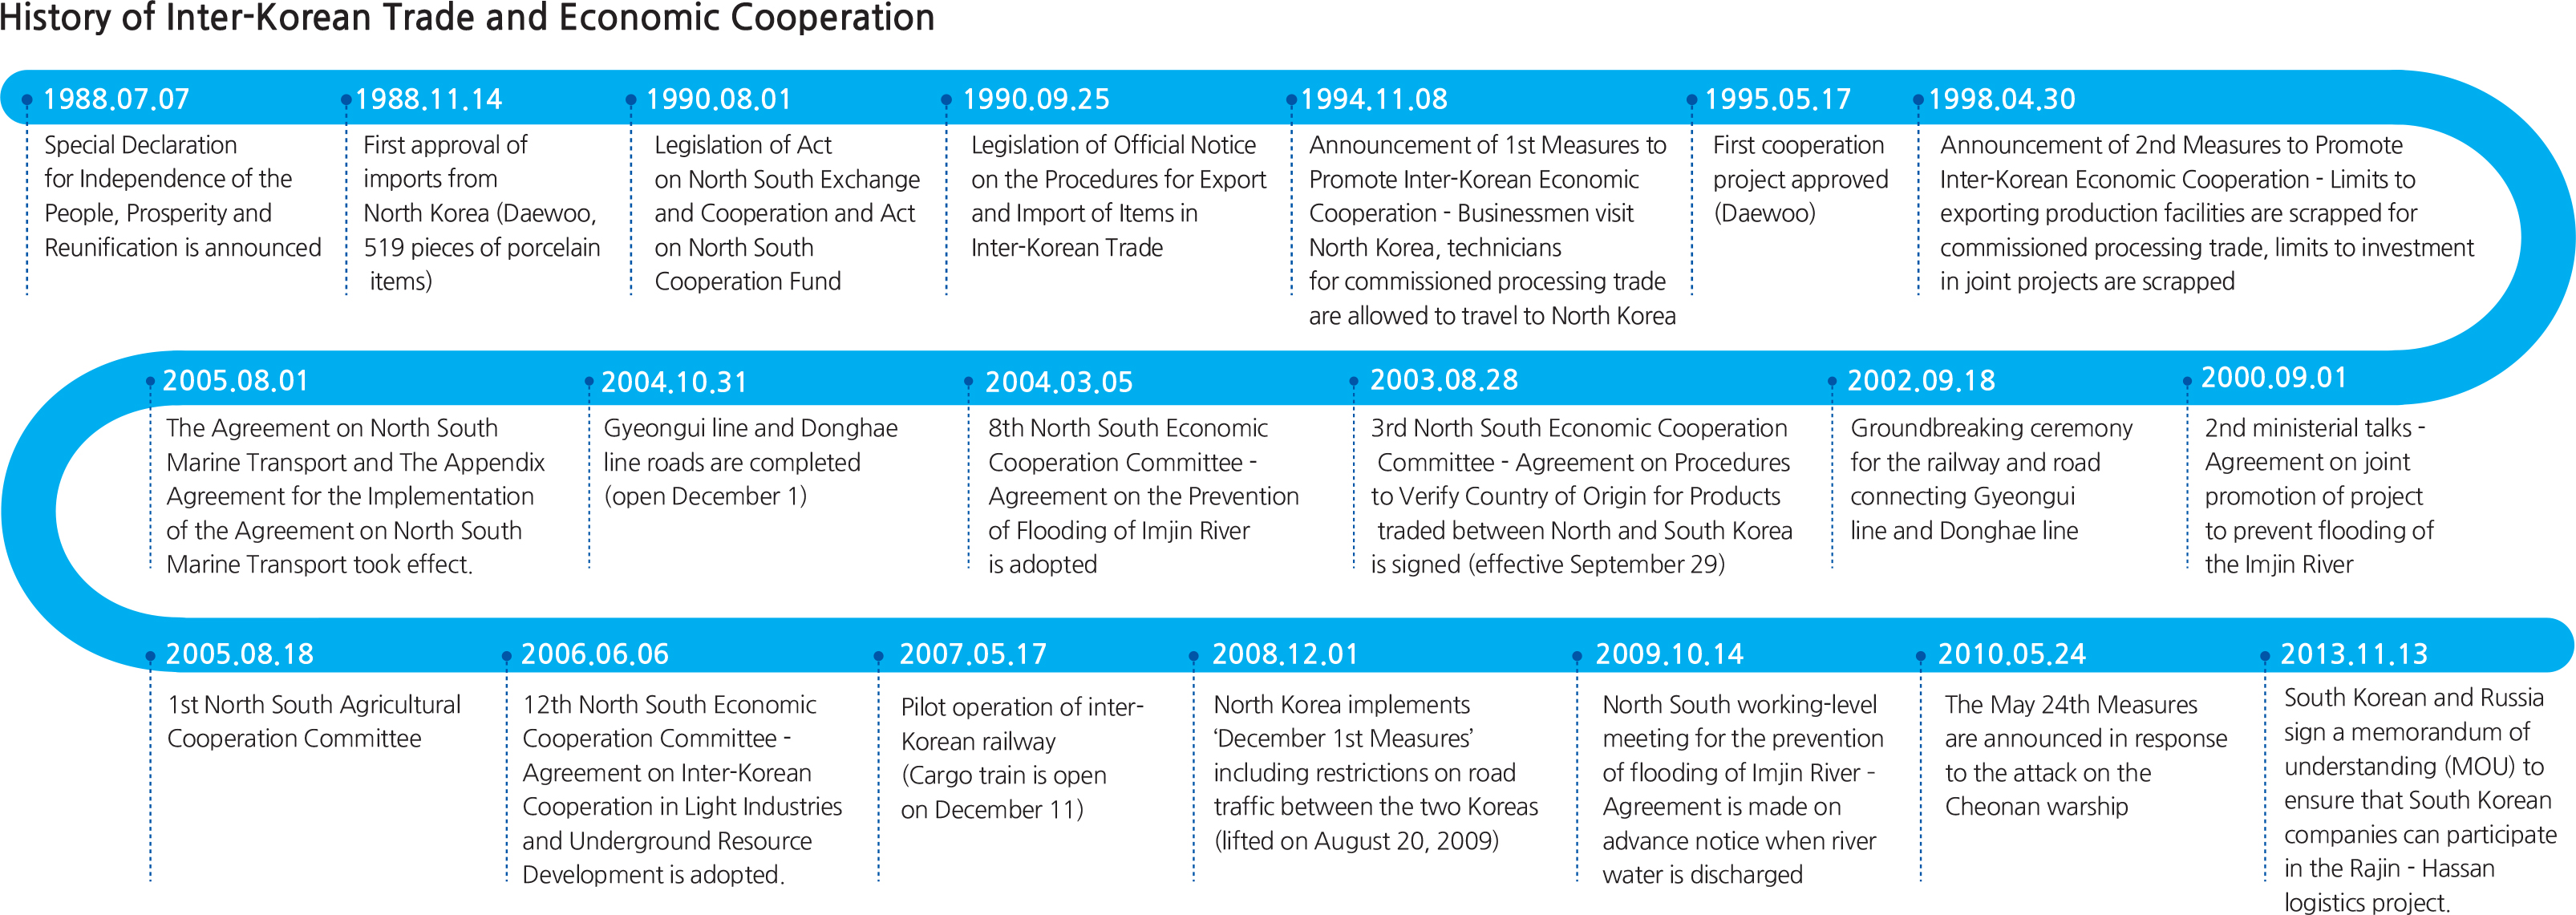
From 1945, the year that North and South Korea were divided, to the 1960s, exchanges and cooperation between the two were nonexistent. In the early 1970s, the North and South first discussed the possibility of an exchange of goods through their respective Red Cross Societies. On November 8, 1994, the Kim Young-sam administration announced the first round of measures to activate inter-Korean economic cooperation. As the successive Kim Dae-jung administration
unveiled the second round of measures and held a summit meeting with the North, inter-Korean economic cooperation entered a new phase.
South-North economic cooperation first started in general trade and then progressed into processing trade and direct investment. Economic cooperation projects include Geumgangsan tourism, the inter-Korean railway, road construction, and the Gaeseong Industrial Complex development. Tourism to Geumgangsan began on November 18, 1998 and the North designated the Geumgangsan area as a special tourist district by enacting the “Geumgangsan Tourist District Act” on November 13, 2002. However, it was suspended in July 2008 after a South Korean tourist was shot dead by a North Korean soldier. After ministerial talks in July and August of 2000, the North and South agreed to reconnect a section of the Seoul-Sinuiju Gyeongui railway line and a section of the Munsan-Gaeseong Roadway. The ground-breaking ceremony for the two cross-border railways and roadways took place on September 18, 2002. Then, in 2003, the Gyeongui line was temporarily opened for the development of the Gaeseong Industrial Complex. After the opening ceremony on February 11, 2003, the Donghae line was used to provide tourist access to Geumgangsan. In May 2007, trial runs of the Gyeongui line (Munsan-Gaeseong) and the Donghae line (Geumgangsan-Jejin) took place; in December of the same year, regular freight train service was initiated.
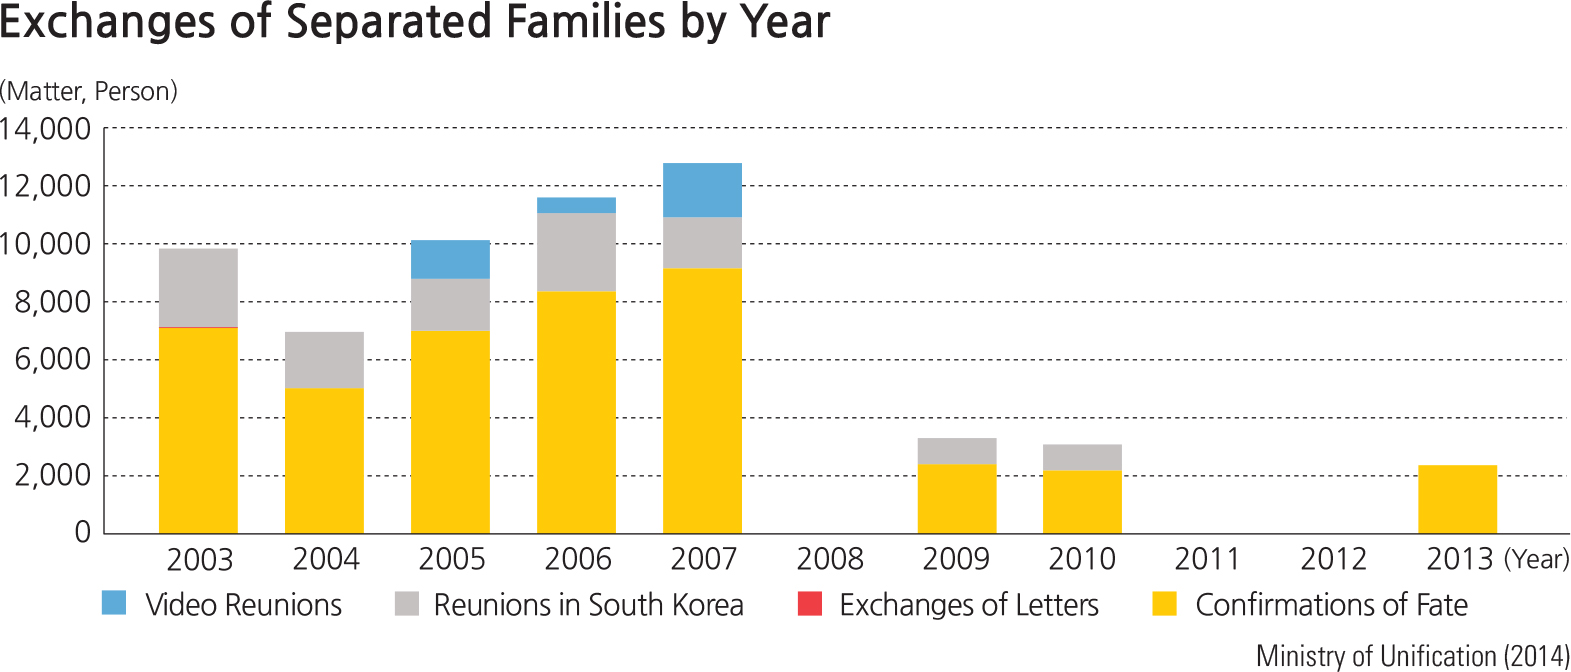
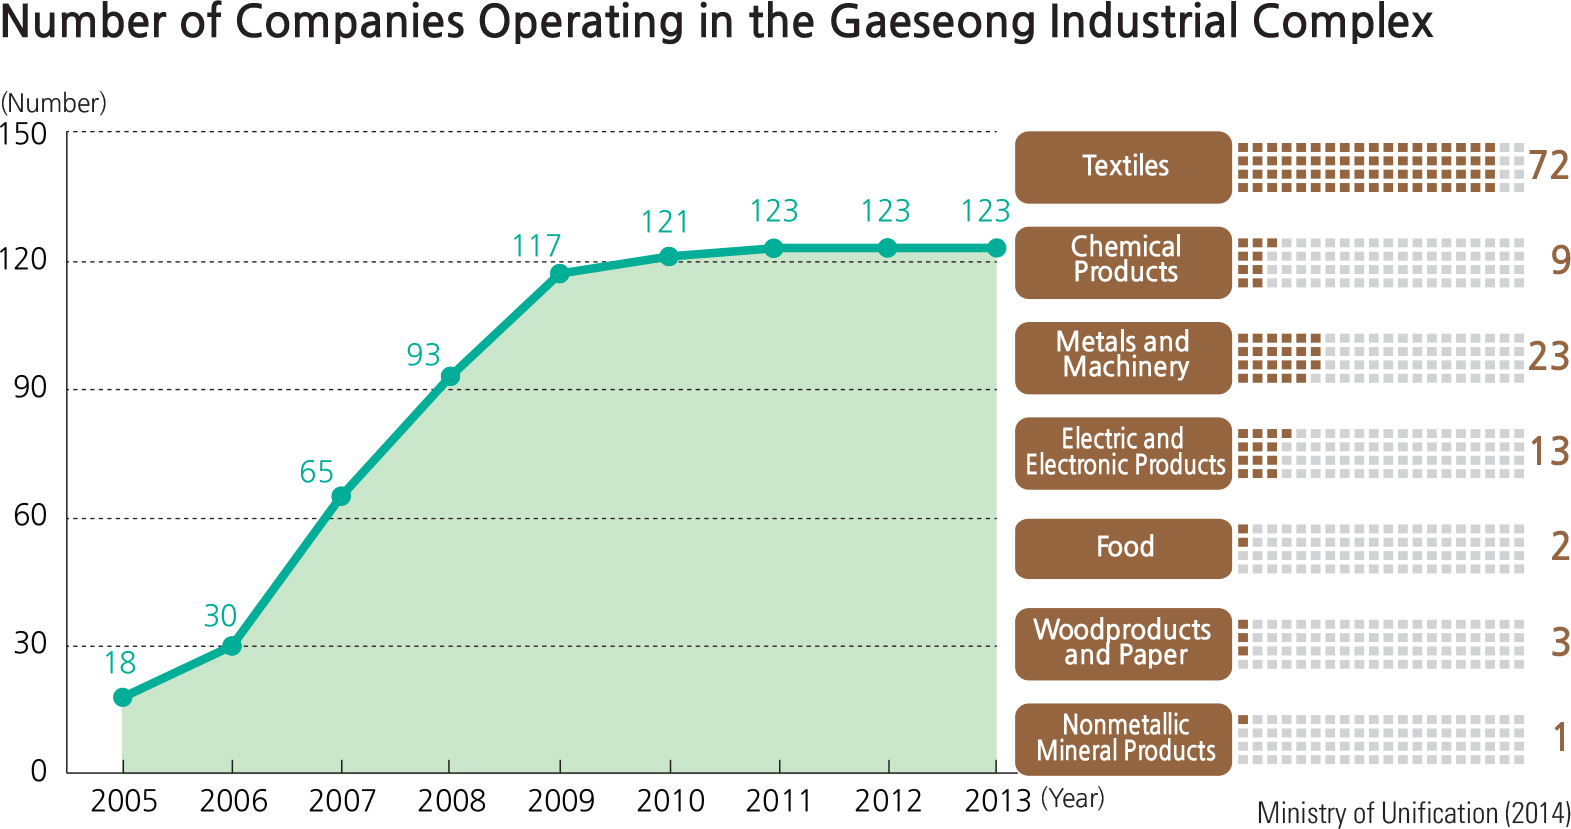
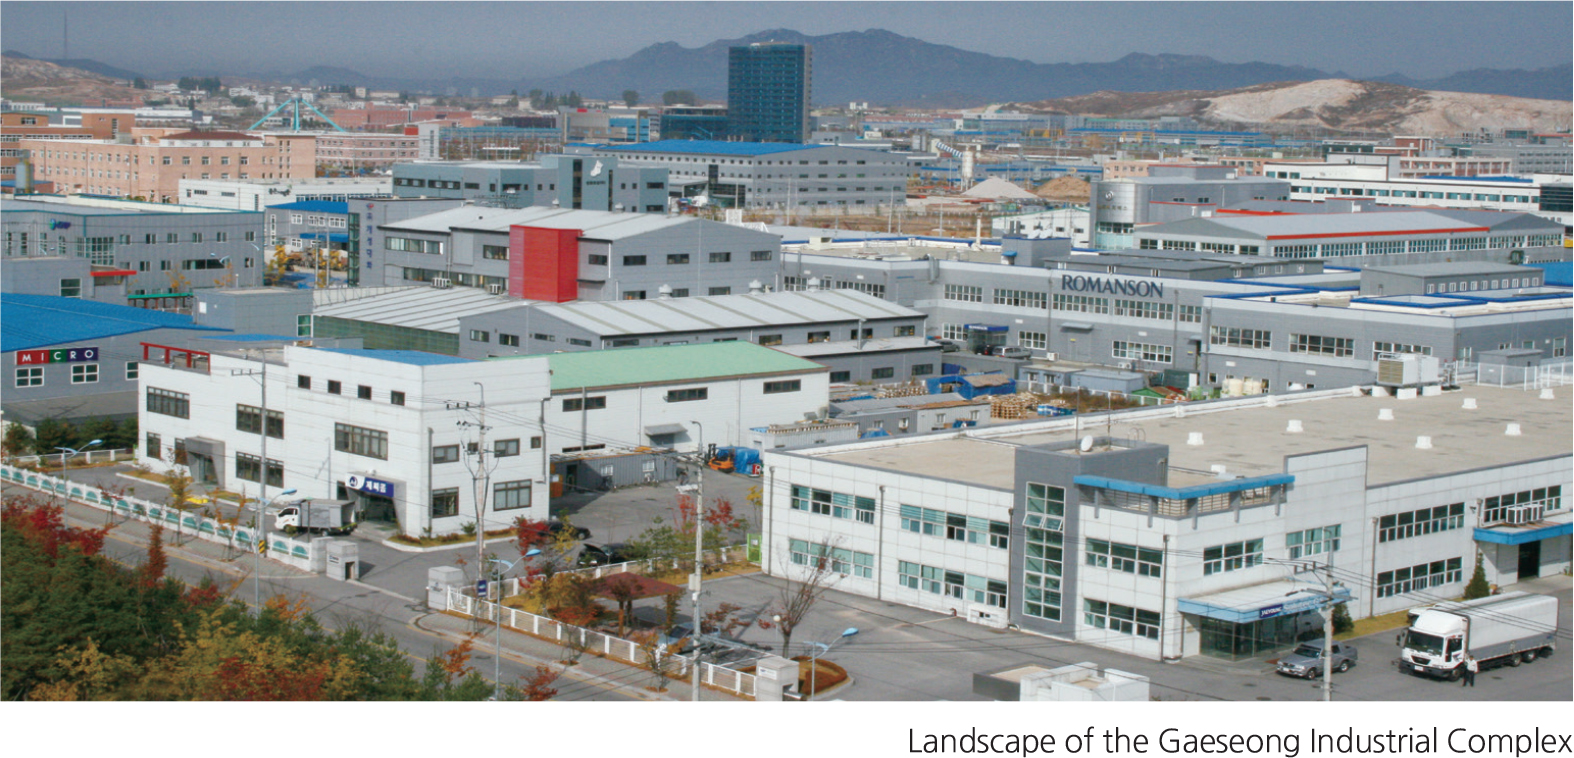
On June 30, 2003, the first round of the Gaeseong Industrial Complex development began on a 3.3 million square meters complex in North Korea and on December 15, 2004, the first products were brought to market. The Gaeseong Industrial Complex project faced difficulties since North Korea restricted land traffic on December 1, 2008. Since then production activity has been growing fast, with 123 companies in the complex hiring 52,000 North Korean workers. Additionally, its accumulated production output and trade volumes stand at US$236.85 million and US$9.45 billion, respectively. The progress in inter-Korean economic cooperation has proven to have a positive impact on separated families. Between 2003 and 2007 when inter-Korean economic exchanges were at their peak, families were able to search for their family members separated from them by the Demarcation Line, communicate with them through letters, and have reunions at governmental and nongovernmental levels. As inter-Korean relations cooled in 2008, the separated families’ chances of communicating with their family members significantly decreased.
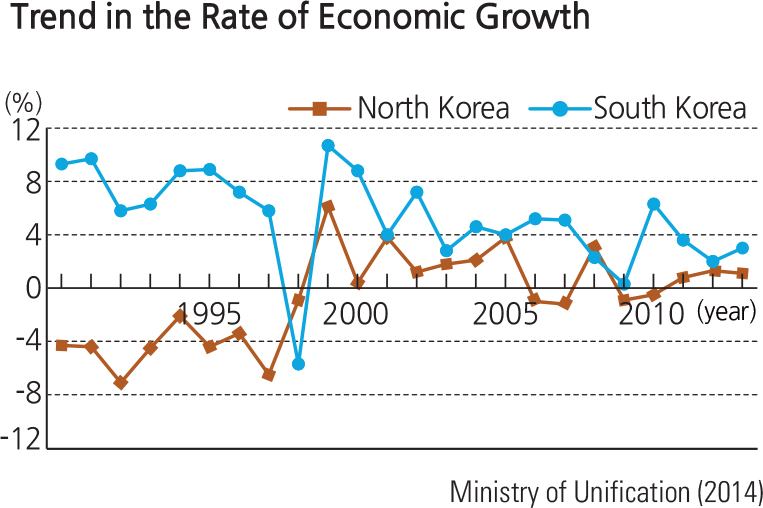
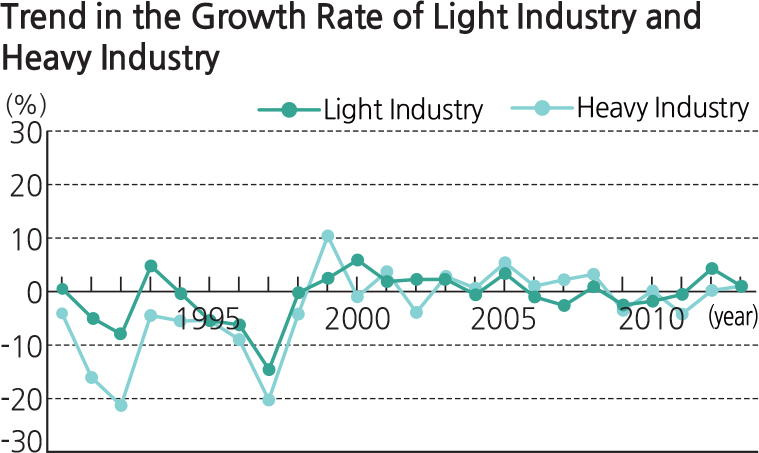
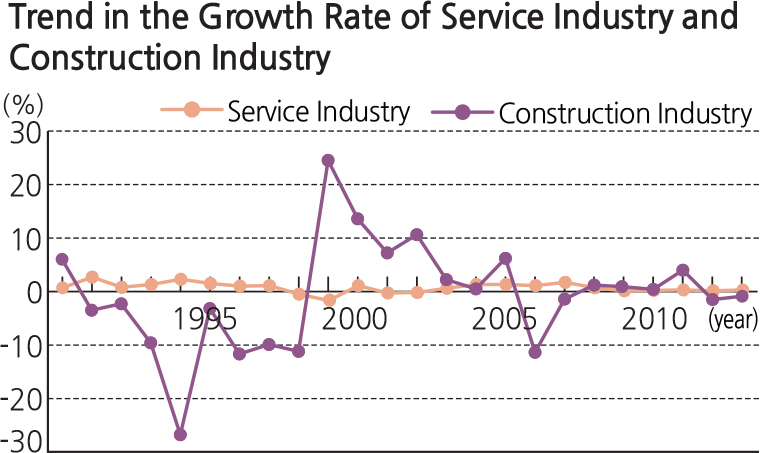
Graphs in page 40 highlight some important economic trends in North Korea from 1990 to 2014. Trend in the rate of economic growth shows the general difference in economic growth between North Korea and South Korea. However, a specific timeline (1990-1998) reveals a different type trend. North Korea showed negative growth while South Korea showed a general but variable positive growth trend from year to year. In 1998 South Korea took a strong drop into the negative trend because of the global economic crisis and then recovered and had a smaller general positive growth rate until 2013, while North Korea stabilized at about the same time, also showing a lesser general positive growth rate until 2013.
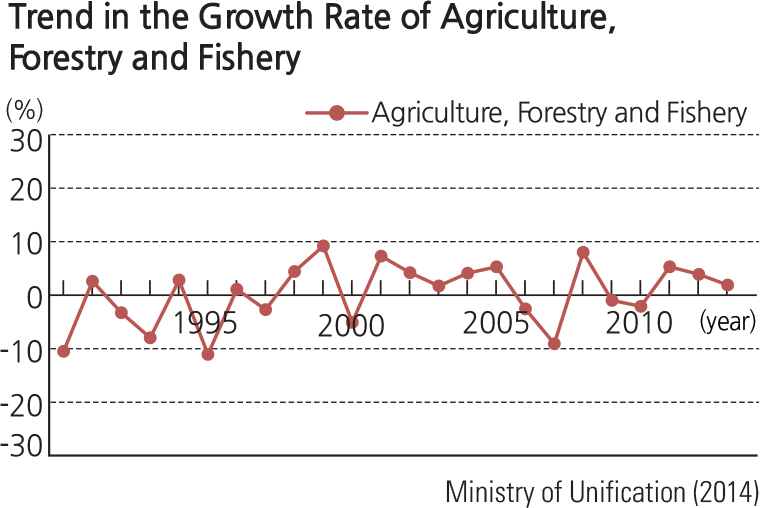
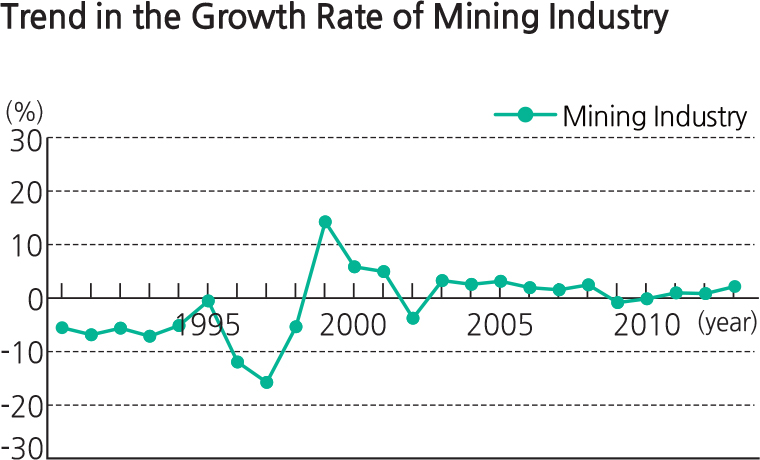
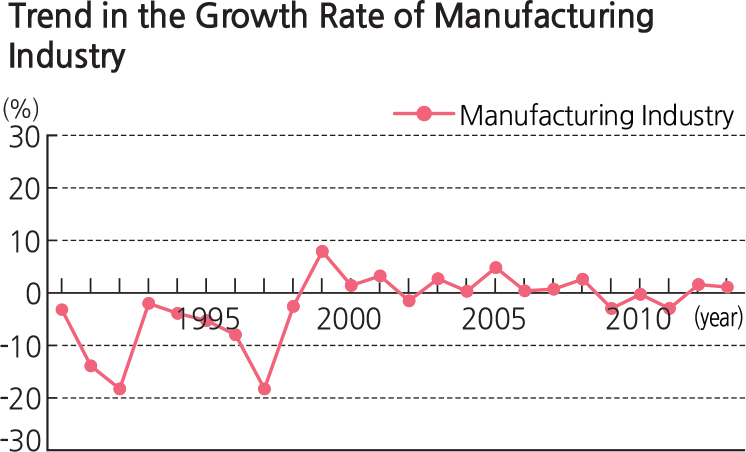
When the North Korea information is shown by breaking apart different aspects of the economy, interesting patterns are revealed, suggesting government support of different aspects of industry. After 1999, most North Korean industries achieved steady growth between -1 and 3 percent with the most variation in Construction and Primary Industries. From 1990 to 2000, there was a great deal of variation in growth, from deep dips to sudden increases. This variation in every industry except the primary and service sectors suggests changing patterns of government support of construction, manufacturing, and heavy industry. However, these data are missing a component that is common in most advanced countries of the world – military and technology investment.
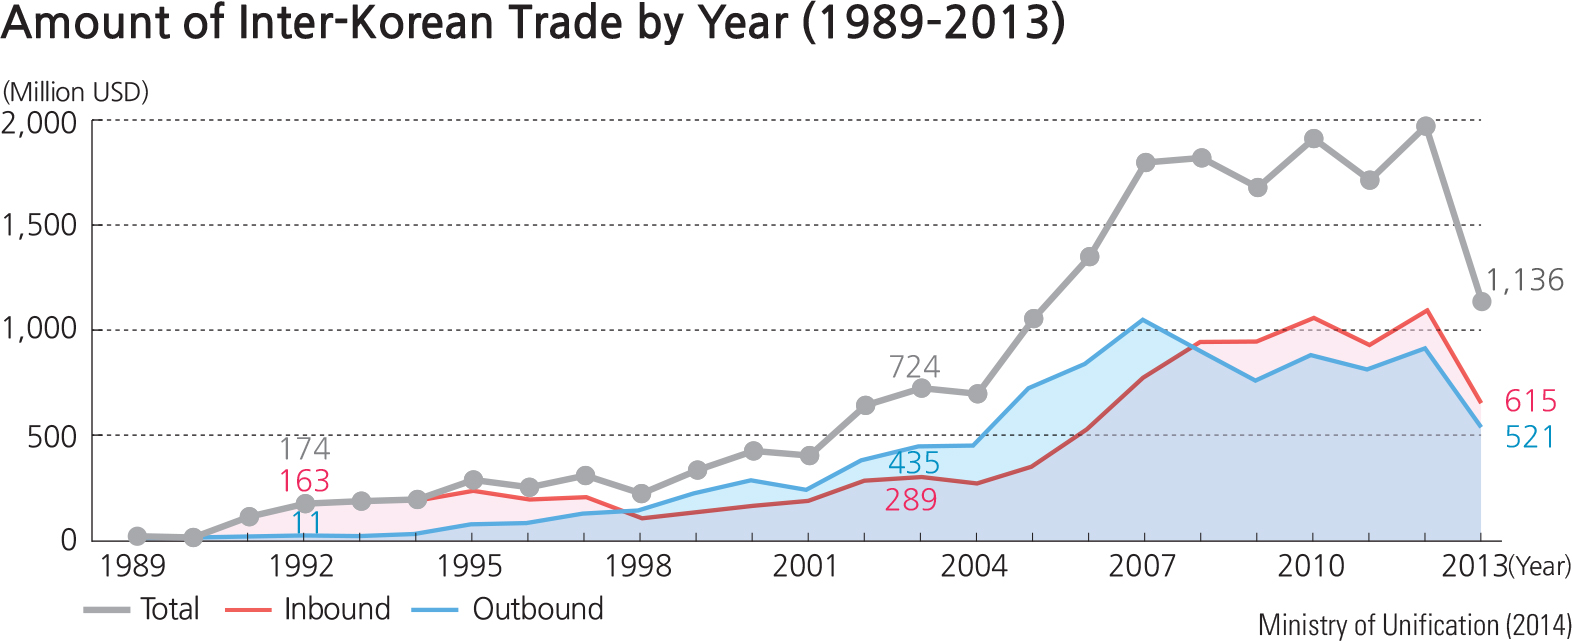
The graph of trade between the two Koreas shows a large increase in outbound North Korean trade from 2001 to 2012, with a 2013 drop shortly after the change of leadership to Kim Jong Un in late 2011 after the death of his father. A similar drop in interaction between families living in North and South Korea first appeared in 2008, then appeared more strongly in 2011. Many speculated that North Korea was involved in the sinking of a South Korean Navy ship, the Cheonan, and that South Korea was forced to cool off cooperative relationships, including the closing of the Gaeseong Industrial Complex.