As the Korean economy has become more industrialized, the primary industries (agriculture, forestry, and fisheries) overall have gradually declined, and the share of the primary industries in the national economy has gone down drastically. The proportion of employment in agriculture, forestry, and fisheries to the total employment was only 5.7% in 2014, falling from just below 50% in the 1970s to less than 10% in 2000. In 1970, the share of agriculture, forestry, and fisheries to gross value added was 17.7%, and then dropped to 5% by the early 1990s, and below 3% by the early 2000s.
The decline and structural changes in the primary industries did not occur uniformly across regions in Korea. Most rural areas did not have enough local jobs to absorb the surplus agricultural labor force. Therefore, there was mass out-migration to the cities while in-migration to rural areas was negligible. However, there are still some areas that maintain a high proportion of employment in the primary industries.
The age of employees in agriculture, forestry, and fisheries has shifted significantly since the 1980s. In 1980, most (32.1%) of the agriculture, forestry and fisheries workers were young (under age 35), while only 5.7% were over age 65. But in 2010, the age distribution was reversed, at 3.5% and 41.6%, respectively. Aging of the farming population is expected to intensify for some time yet. But new changes seem to be appearing: though engaged in urban non-agricultural sectors previously, some people (about 10,000 per year) have begun to migrate to rural areas to farm. Among them, over 70% are younger than age 50, and over one third of them are younger than age 40. As of now, however, the implications of this new change in migration for the demographic structure of the agricultural sector in the future are hard to predict.
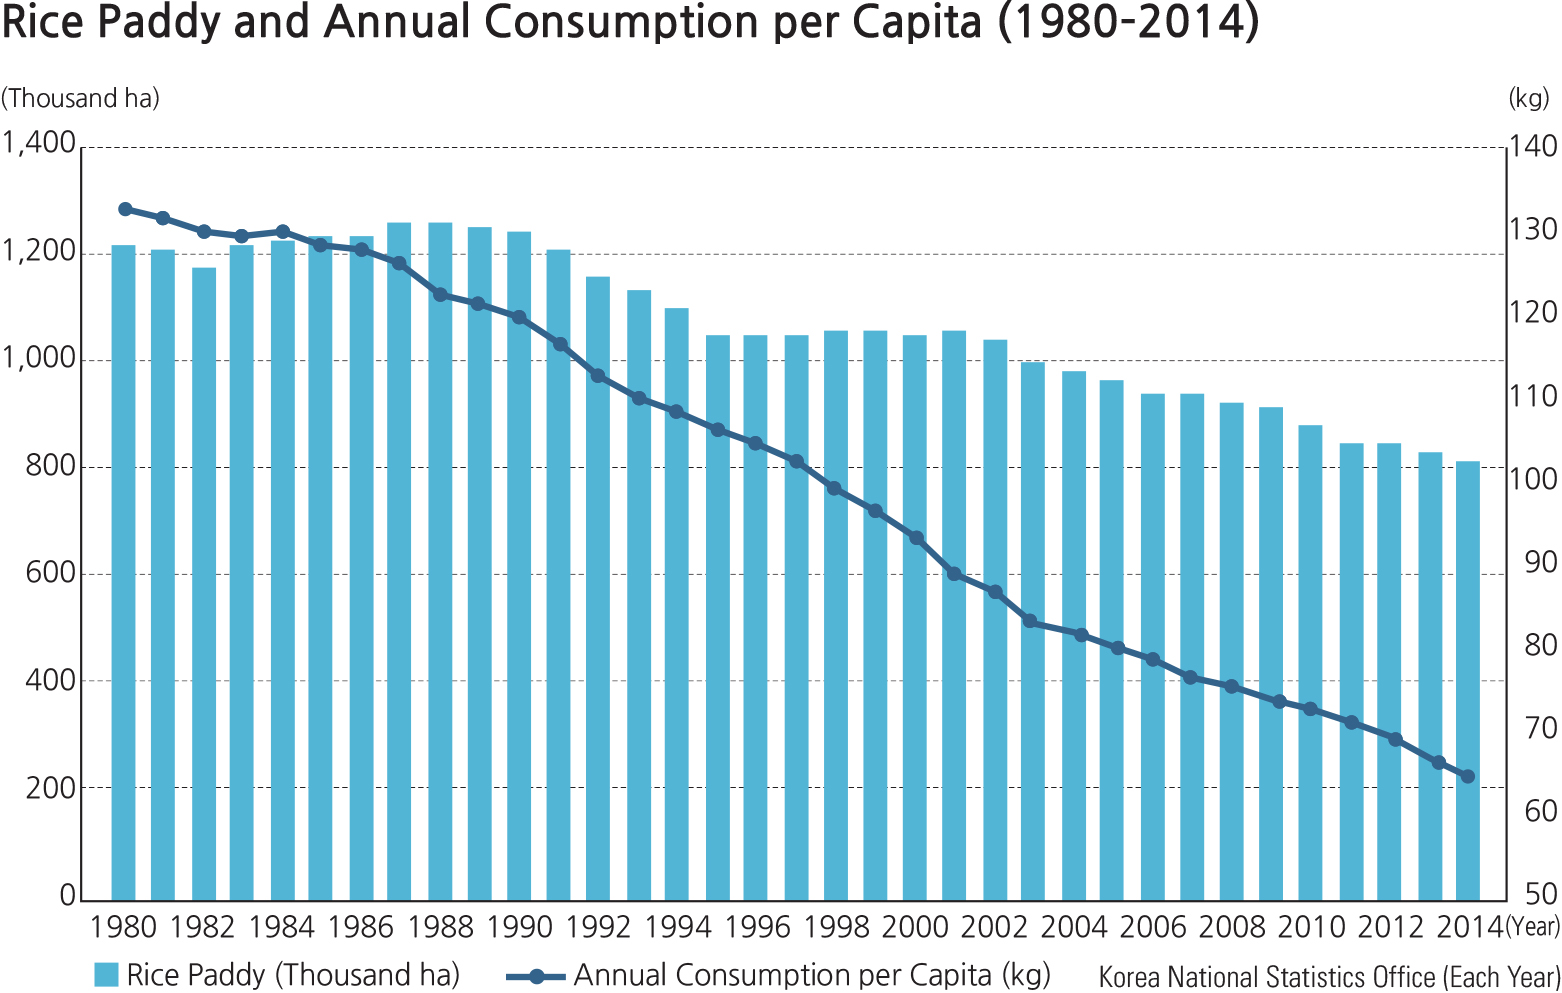
The most prominent trend in Korean agricultural production has been the decline in rice production. The rice cultivation area was about 1,220,000 hectares (3,014,686 acres) in 1980, but declined steadily to 814,000 hectares (2,011,438 acres) by 2014, a reduction of about onethird (or 406,000 hectares or 1,003,248 acres) in 34 years. Nevertheless, the per capita annual rice consumption was greatly reduced during the same period; rice has become rather seriously oversupplied. Moreover, the amount of rice imports by the MMA (Minimum Market Access) based on the World Trade Organization (WTO) agreement, has increased annually, which creates an added burden to the rice production oversupply problem. Eventually, many rice growers either reduce their rice crop areas or switch to other crops due to a lack of profit.
The share of forestry to the national economy has traditionally been low. From 1990 to the present, the annual forestry production value remained between 0.2 and 0.5% of the Gross National Product (GNP). Forestry products that used to be gathered from the forest are cultivated directly now. Forestry households, whose main source of income is forestry, have increased slightly compared to the past. Even so, forestry still remains only a very small part of the national economy.
The Korean fishing industry has experienced a lot of uncertainties due to the depletion of fishing resources and imported fishing products over the last few decades. The decline is more prominent in coastal and deep-sea fishing, which have traditionally been important in the Korean fishing industry. Only after 2000, with a gradual increase in aquaculture and inland fisheries, has the total fishing industry output and value of production slightly improved. In recent years, however, even the aquaculture industry has begun to decline. This overall depression in the fishing industry has caused a persistent decline in the fishing industry population. The number of fishermen employed in offshore or coastal fishing by 2010 was reduced to almost half, while inland fishing decreased to 36%. This trend is expected to continue in the future because there is hardly any influx of new fishing industry workers, and current fishing industry workers are aging.
Brief Interpretation of Map and Graphs
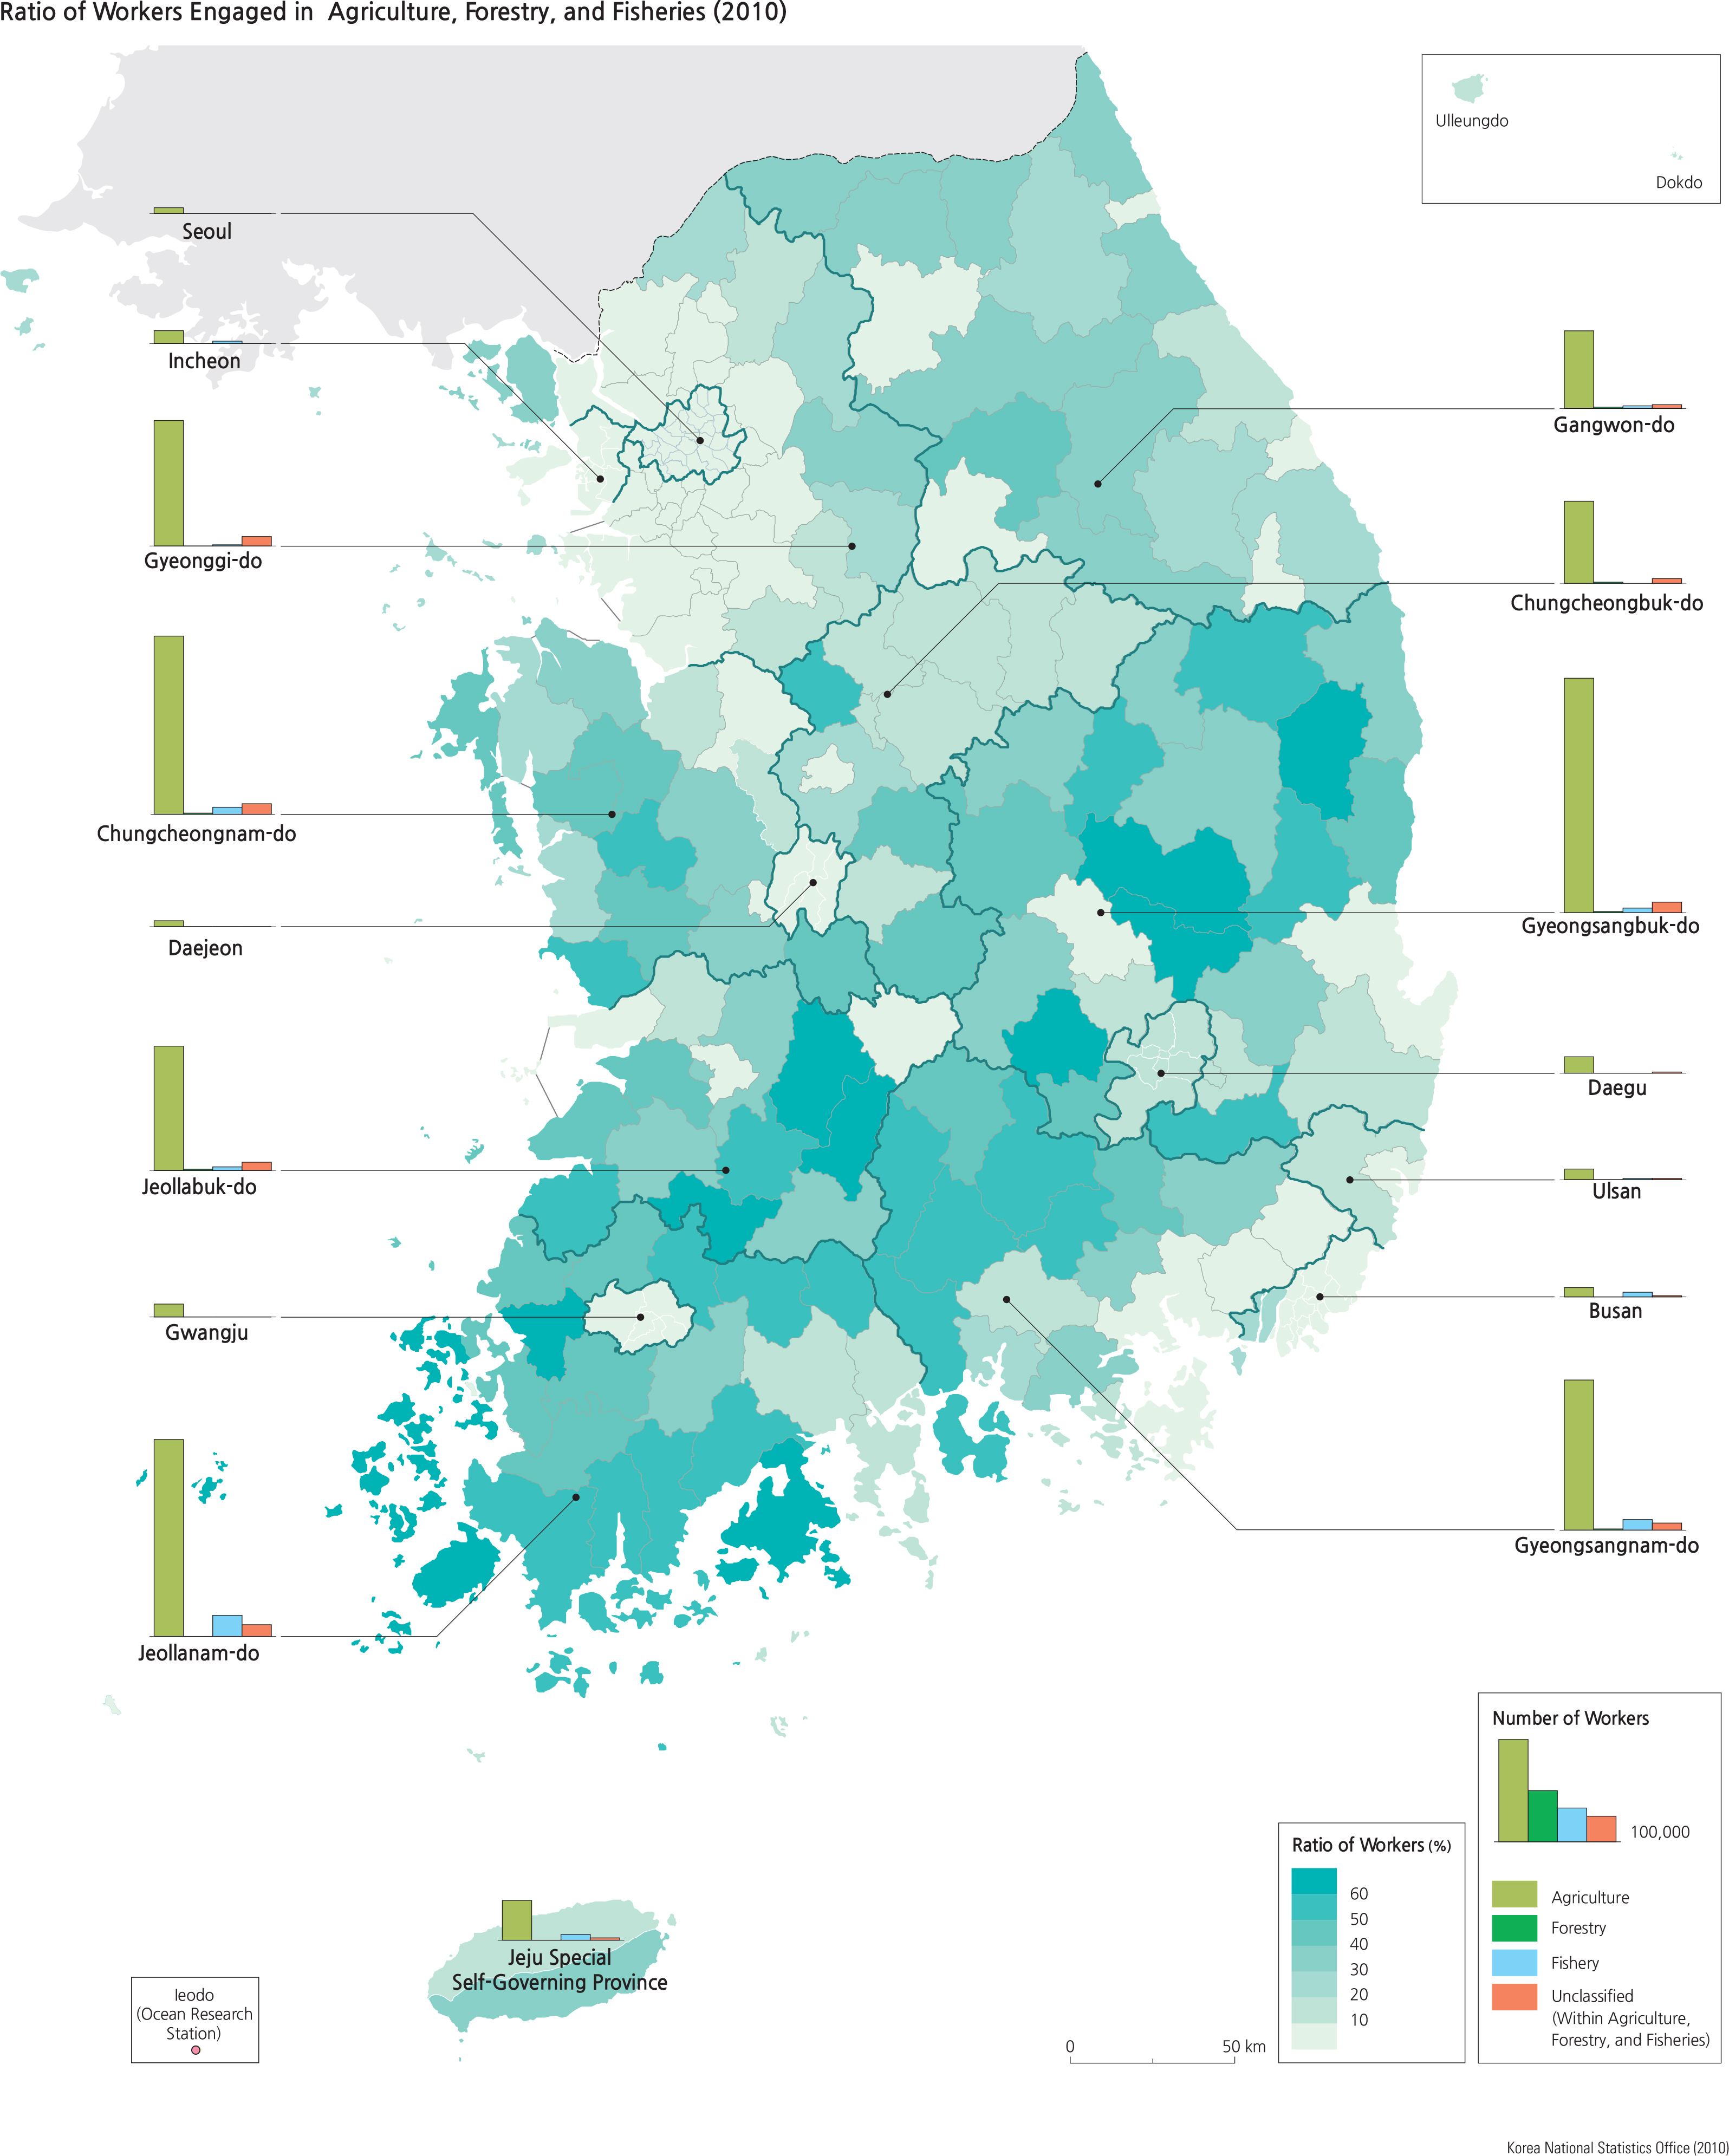
The large map on the left page depicts the ratio of workers in agriculture, forestry and fisheries in 2010. As would be expected, most of the metropolitan and province sub-districts with the highest ratios are outside of the major urban areas. As the text above indicates, the mining component of the natural resource category in the industrial economy has almost disappeared.
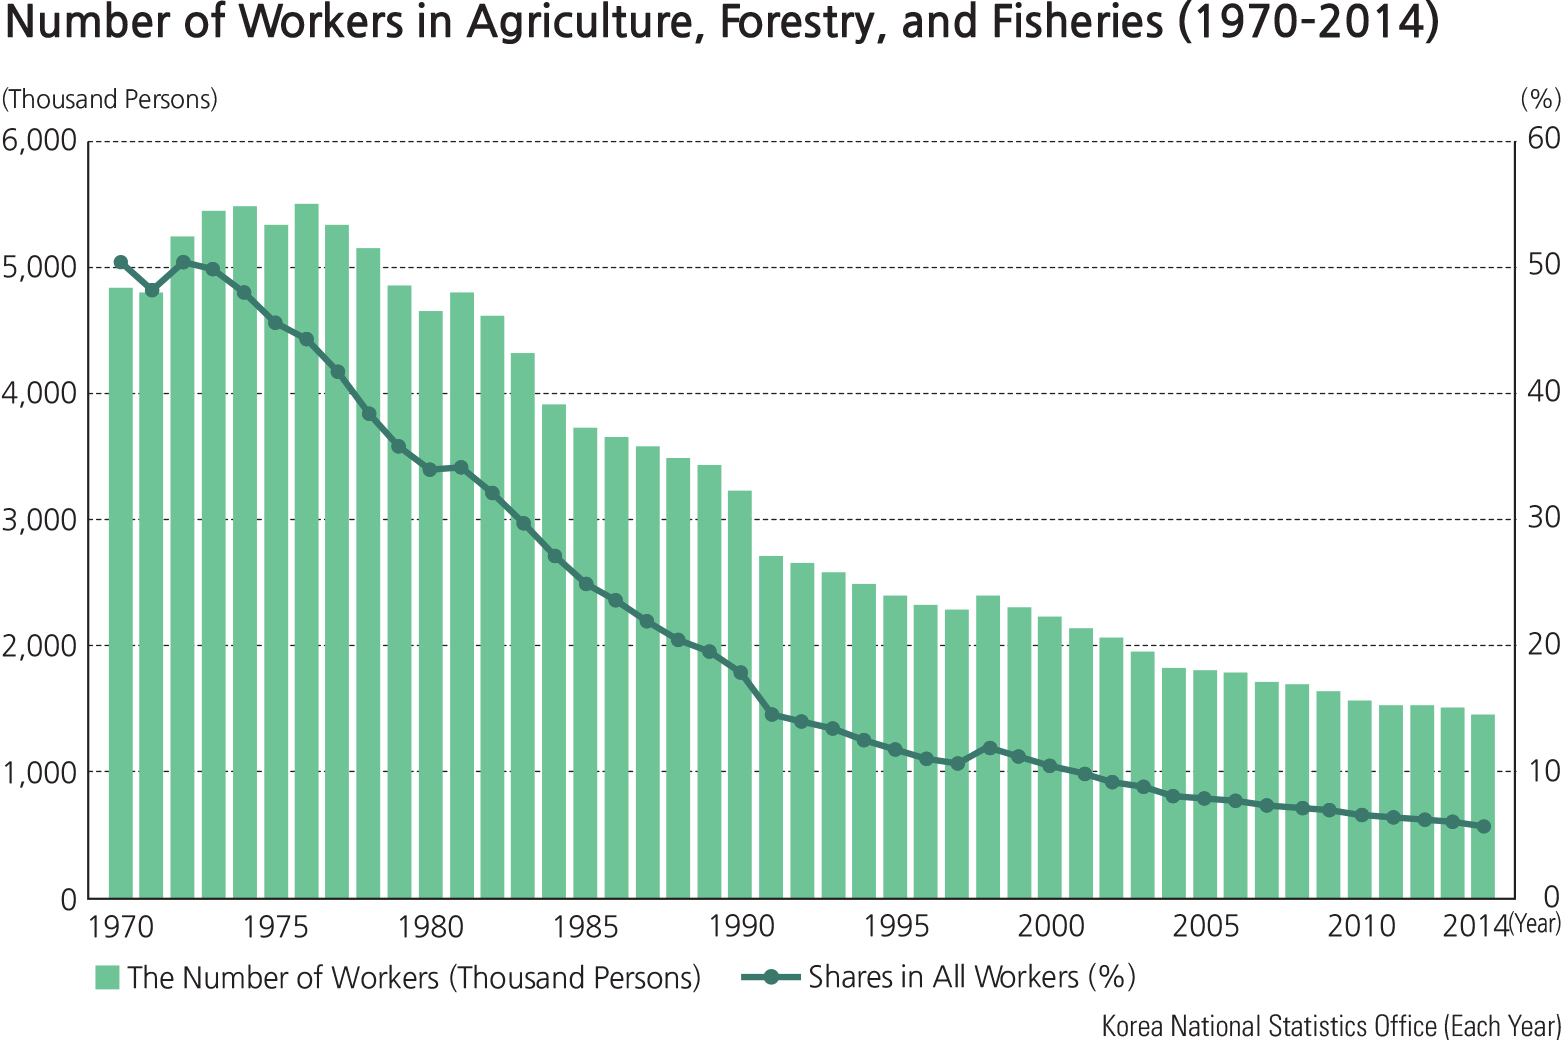
The four graphs above display some interesting contrasts. The graph of the Number of Workers in Agriculture, Forestry and Fisheries from 1970 to 2014 exhibits an expected pattern. As the number of workers has declined in this sector, the percentage share of the worker has declined proportionally. The graph of the Gross Value Added in Agriculture, Forestry and Fisheries when compared to the Share of Total Gross Value Added provides a clearer view of the role this sector plays in the whole economy. The Share of the Total Gross Value-Added is steadily decreasing−. illustrating the natural resource sector is gradually taking a smaller role in the economy as a whole, while the manufacturing and service sectors are increasing. However the value of the sector is gradually increasing illustrating the increase of the cost or value of these products.
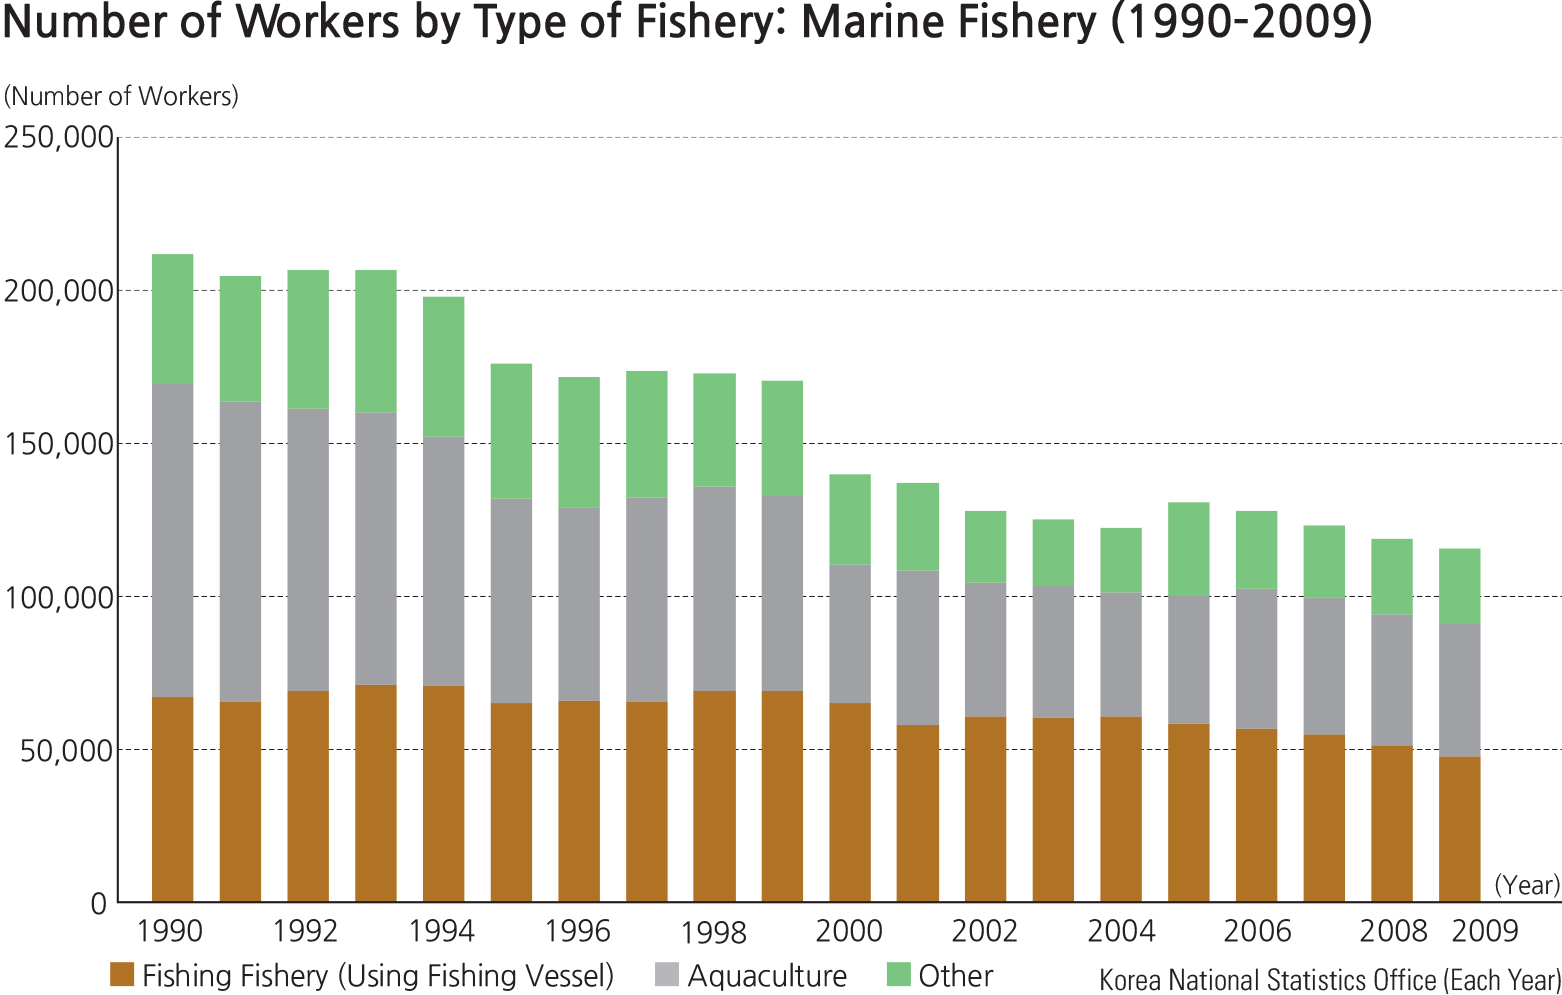
The area in rice paddy land has decreased by about 30% over the 44 year period, as shown on the graph, but the Per Capita Rice consumption has decreased by almost 65% indicating an increase in exported rice over the same time period. This factor may signal an increasing export market in agricultural products in general. The graph presenting the number of workers by type of fishery also displays some interesting changes. The three categories of type of fishery are fishing vessel sources, aquaculture and other (fresh water sources and shellfish). The sector relying on fishing vessels only slightly decreased from 1990 to 2009. In the same period, the aquaculture component shrank to only about a 50% contribution in 2009, compared to what it was in 1990 when aquaculture was about 1.8 times the vessel component. The “other” component in 2009 was about only 40% of the total in 1990. With the three categories combined, the fisheries industry in 2009 is only about 45% of the amount it was in 1990.
With the fisheries only approximately 45% of the amount it was in 1990, can you assume that fish products consumption has decreased accordingly? The natural resources sector of the South Korean economy is decreasing in general when compared to the other industrial and services sector. However, lumber for construction, fish for consumption, and agricultural food products cannot be assumed to be decreasing with a growing population. Therefore these increasing needs of the nation must be met by imports. Thinking about the nature of these three sectors, discuss the different types of import methods which are most appropriate for each sector and relative costs. If the relatively low fuel costs at the present were to increase drastically over the next year, what type of natural resources products would be expected to reflect the highest cost increases?