Anthesis and Phenology
Climate change can affect the growth of plants. Two phenomena related to the effects of climate change on plants are “nthesis”and “henology.”Anthesis is a botanical term that refers to the flowering period of a plant that begins with the opening of the flower bud. It is generally recorded as the number of days from January 1 of each year to the day of first budding. Due to global warming, the first opening day of the flower bud may come earlier than usual because of warmer temperatures in the spring, thus the number of days shall be shorter than normal. Phenology is the biological study of periodic phenomena such as flowering, budding, breeding, and spatial migration in response to climatic conditions.
Average global temperature has increased by about 0.7˚ over the last century; Korea has experienced double that rate of increase (1.5˚) during the same period. If this trend continues, the country is expected to have a 6.0˚ increase in annual mean temperature and 20.4% more annual precipitation by 2099.
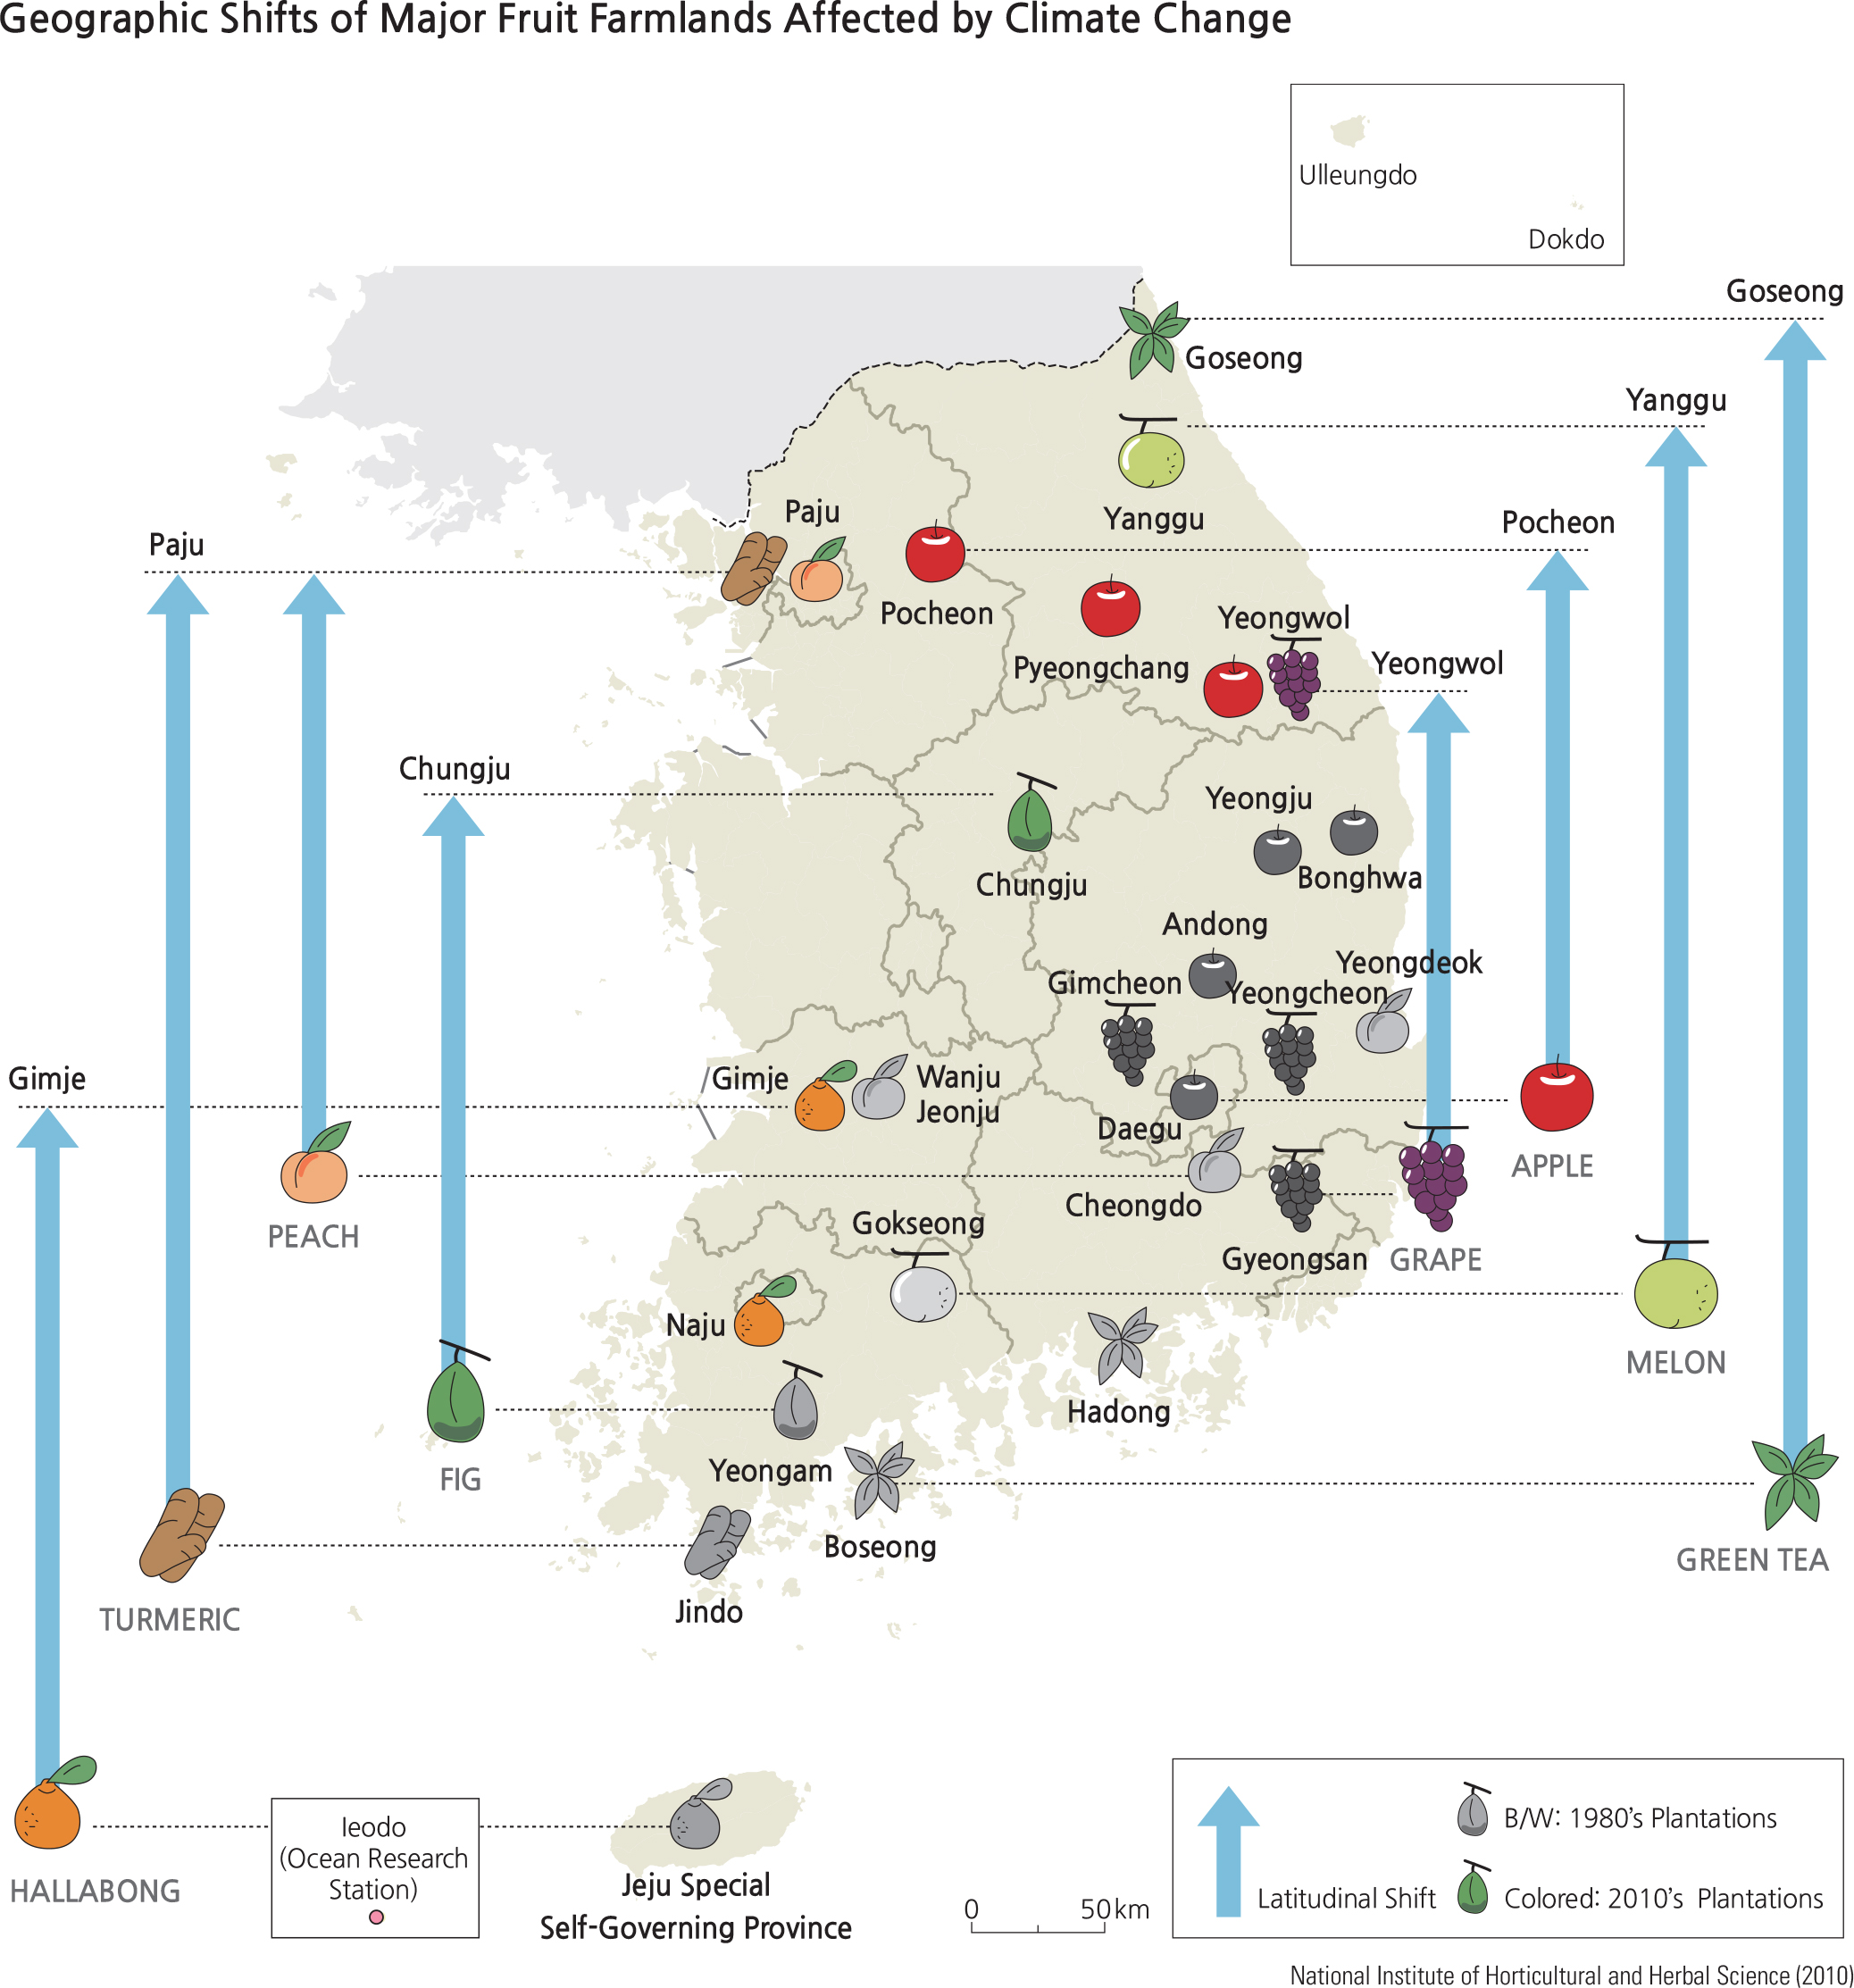
An appropriate indicator of Korea's temperature shift is the northward movement of major crops. Subtropical fruits such as tangerines and Hanrabong (local specialties of Jejudo) were usually only produced on the island. However, they can now be grown in areas such as Gimje-si, Goheunggun, and Cheongju-si, while Jejudo now produces tropical crops like mango, dragon fruit, papaya, and sugar apple. Similarly, apple plantations have moved north from Daegu to Pocheon-gun, grapes to Yeongwol-gun, figs to Cheongjusi, and peaches to Paju-si, all north of their original sites. Climate change is not only changing the plantation pattern of Korea, but is also posing potential threats to food security, such as plant diseases and insects. Even the active highland farming areas in Gangwon-do are predicted to decrease as well.
In order to mitigate the impacts on agricultural sectors caused by possible climate changes, the Korean government is developing various policies for establishing adaptive plans such as long-term regional agricultural and farming plans. New crops have been introduced, and various resource crops in subtropical/tropical regions have been collected through scientific collaboration with overseas countries. Scientific diagnosis and evaluation of the impacts of climate change on the agricultural sector are important in establishing future visions of the agricultural industry and the direction of its policies.
Brief Interpretation of the Maps
The map shows the shift of fruit growing plantations northward from the 1990s to 20 years later. It is very interesting but to a degree, oversimplified. The dramatic shift of fruit growing areas moving from 160 to 400 kms northward tells only part of the story. The map shows where the crops are actually grown, not necessarily where they could be grown. While active plantations are successful, there may be others that have failed or for other reasons may not be economical.
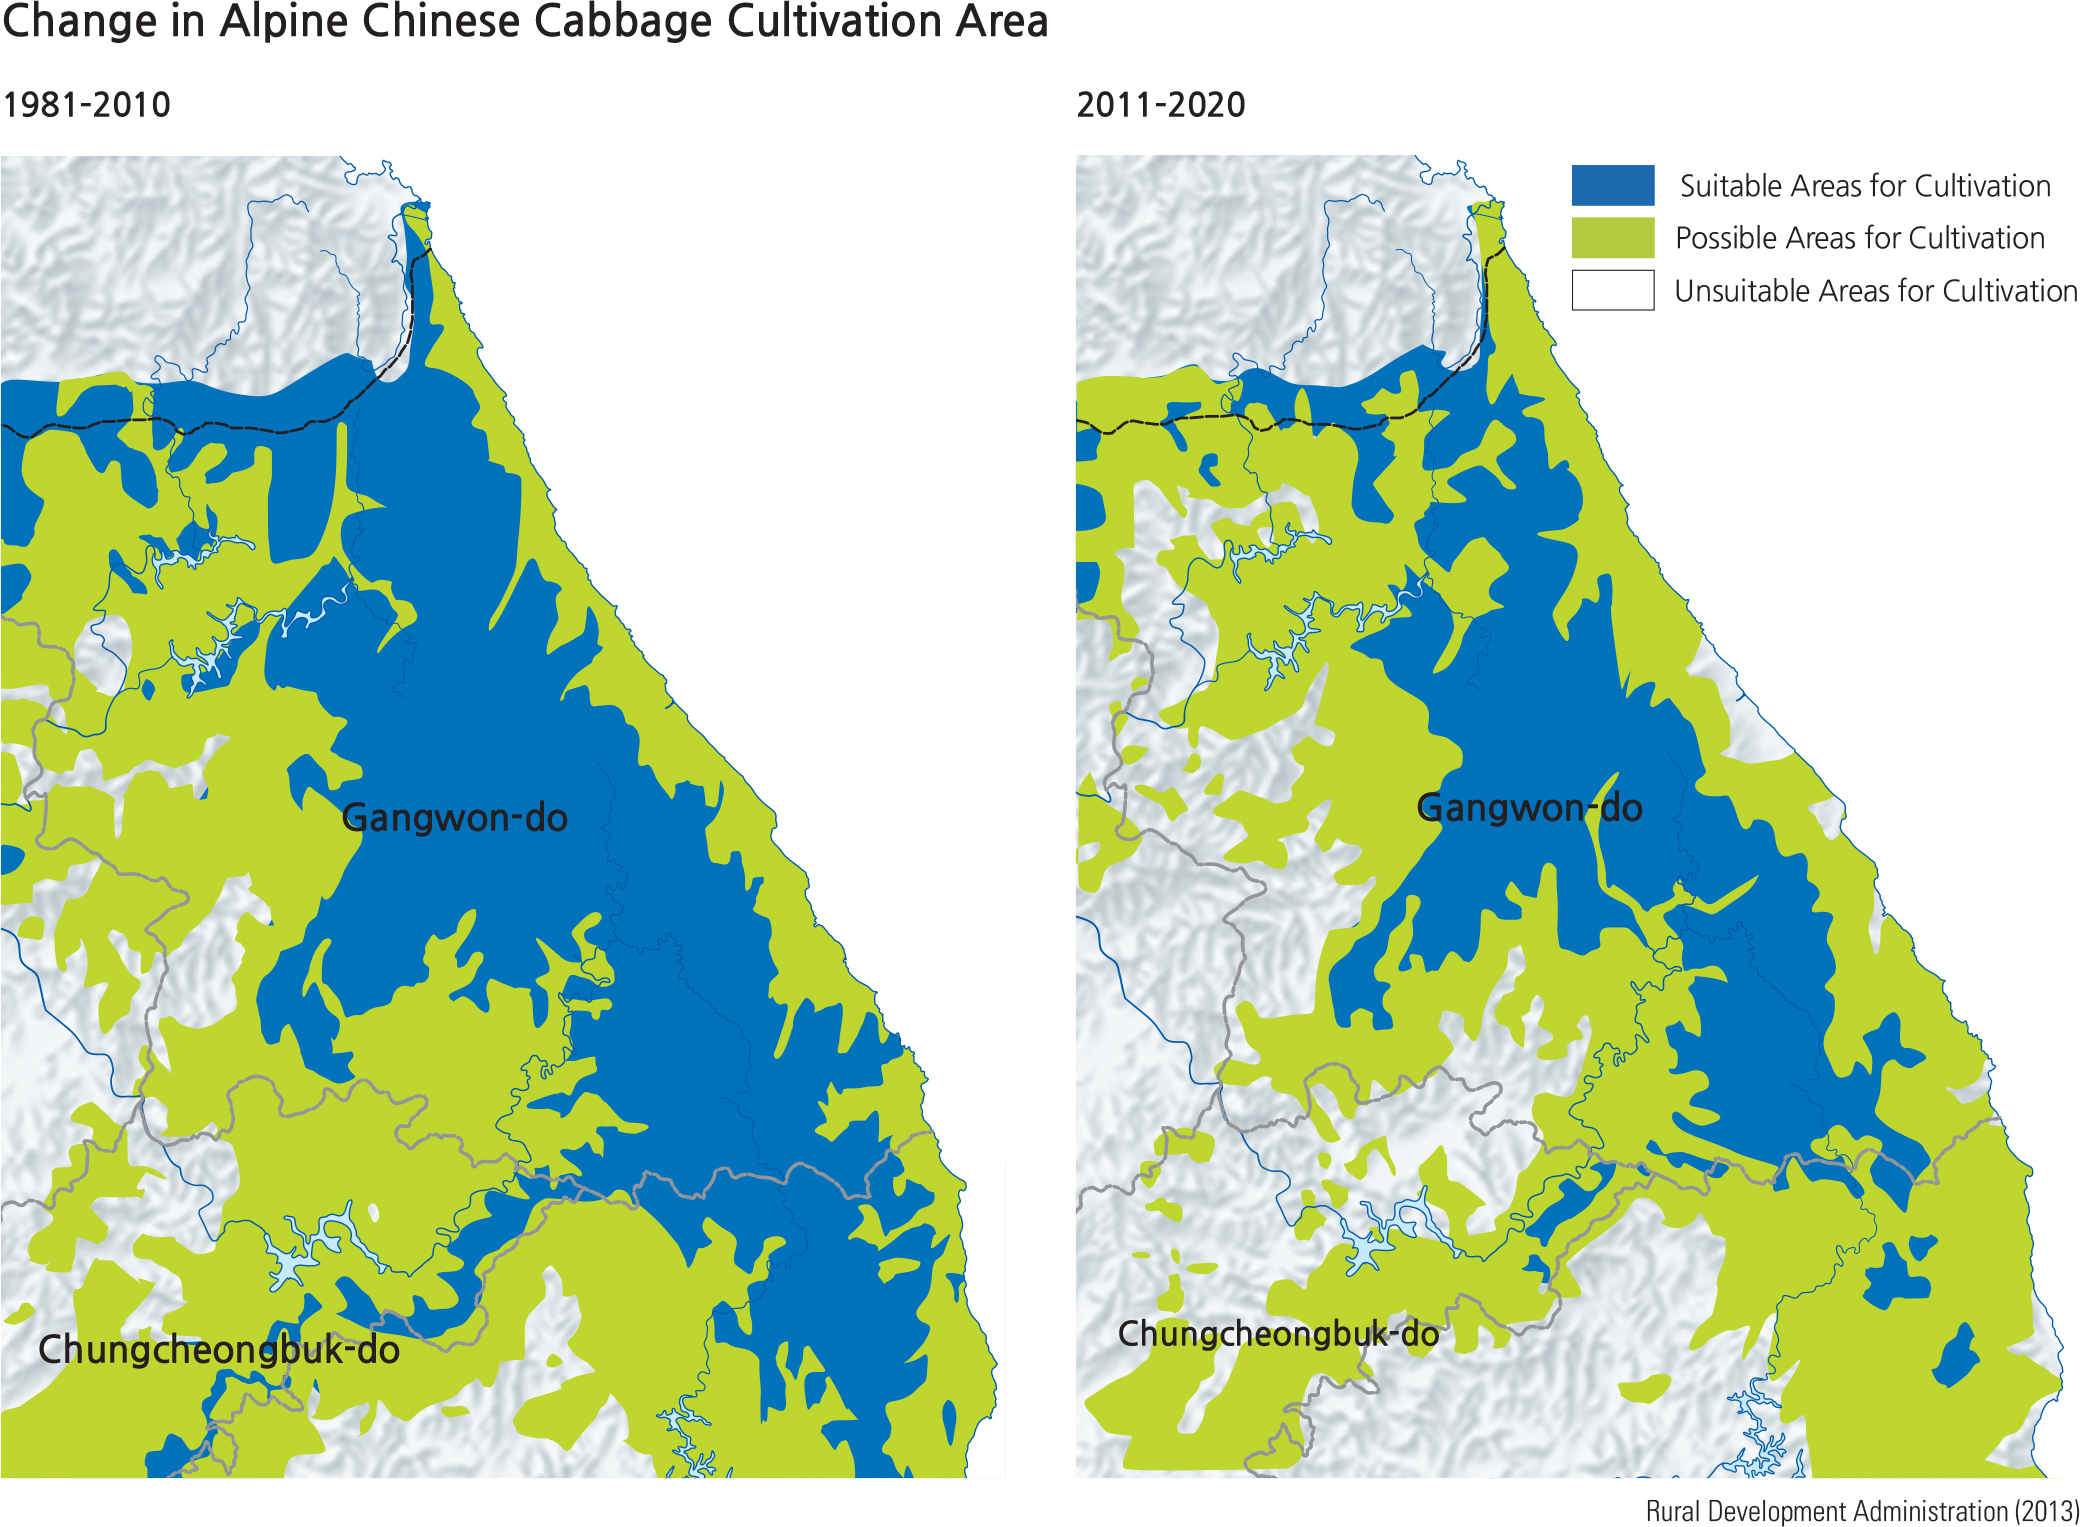
The shift of potential growing season with increasing average temperature is an important factor. However, there are other contributing factors in play as well, such as soil conditions, aspect (direction in relation to the sun), winds, and precipitation. The map showing the change in cultivation of alpine Chinese cabbage shows areas that are suitable for production in contrast to areas that are possible, not where the actual production exists. In the case of Chinese cabbage, elevation seems to be a significant controlling factor, which will have a temperature effect due to elevation in addition to global change. When global warming is factored into temperature decrease with elevation, the growing zones for the cabbage may have to be adjusted in projections.
If the establishment of a new peach plantation were being planned by a local agricultural cooperative, list all the economic and physical factors that would have to be considered in alternate locations. Would there be a difference in location factors for grapes in contrast to peaches? Would the easily accessible modes of transportation or the run schedule regularity play a role in the location of a fruit plantation? Why or why not?
Modeling Geographic Shifts
As the temperature increases, the vegetation zone of the Northern Hemisphere is moving from the south to the north and from lowlands to highlands. An increase by 1˚ is expected to cause a migration of plants of middle latitude by 150 km to the north and 150 m higher in altitude, making it difficult for most plant species to keep up with the speed of climate change. Thus, the chance of extinction or shrinkage of habitat for plants increases. Detection of changes is possible by observing the microclimate, seasonal variations, and physiological changes in plants’blooming and bearing of fruits through long-term monitoring.
Since 2009, the Korea National Arboretum has been implementing an adaptation plan for forest plant species that are susceptible to climate change. The plan, which builds datasets on regional microclimate change, designates 100 vulnerable species that will be physiologically influenced by climate change. They are carefully monitored after classifying them into either northern or southern species. Habitat change and spatial distribution change are predicted as consequences of inter-species competition. Thus, some species may likely become newly endangered because of global warming.
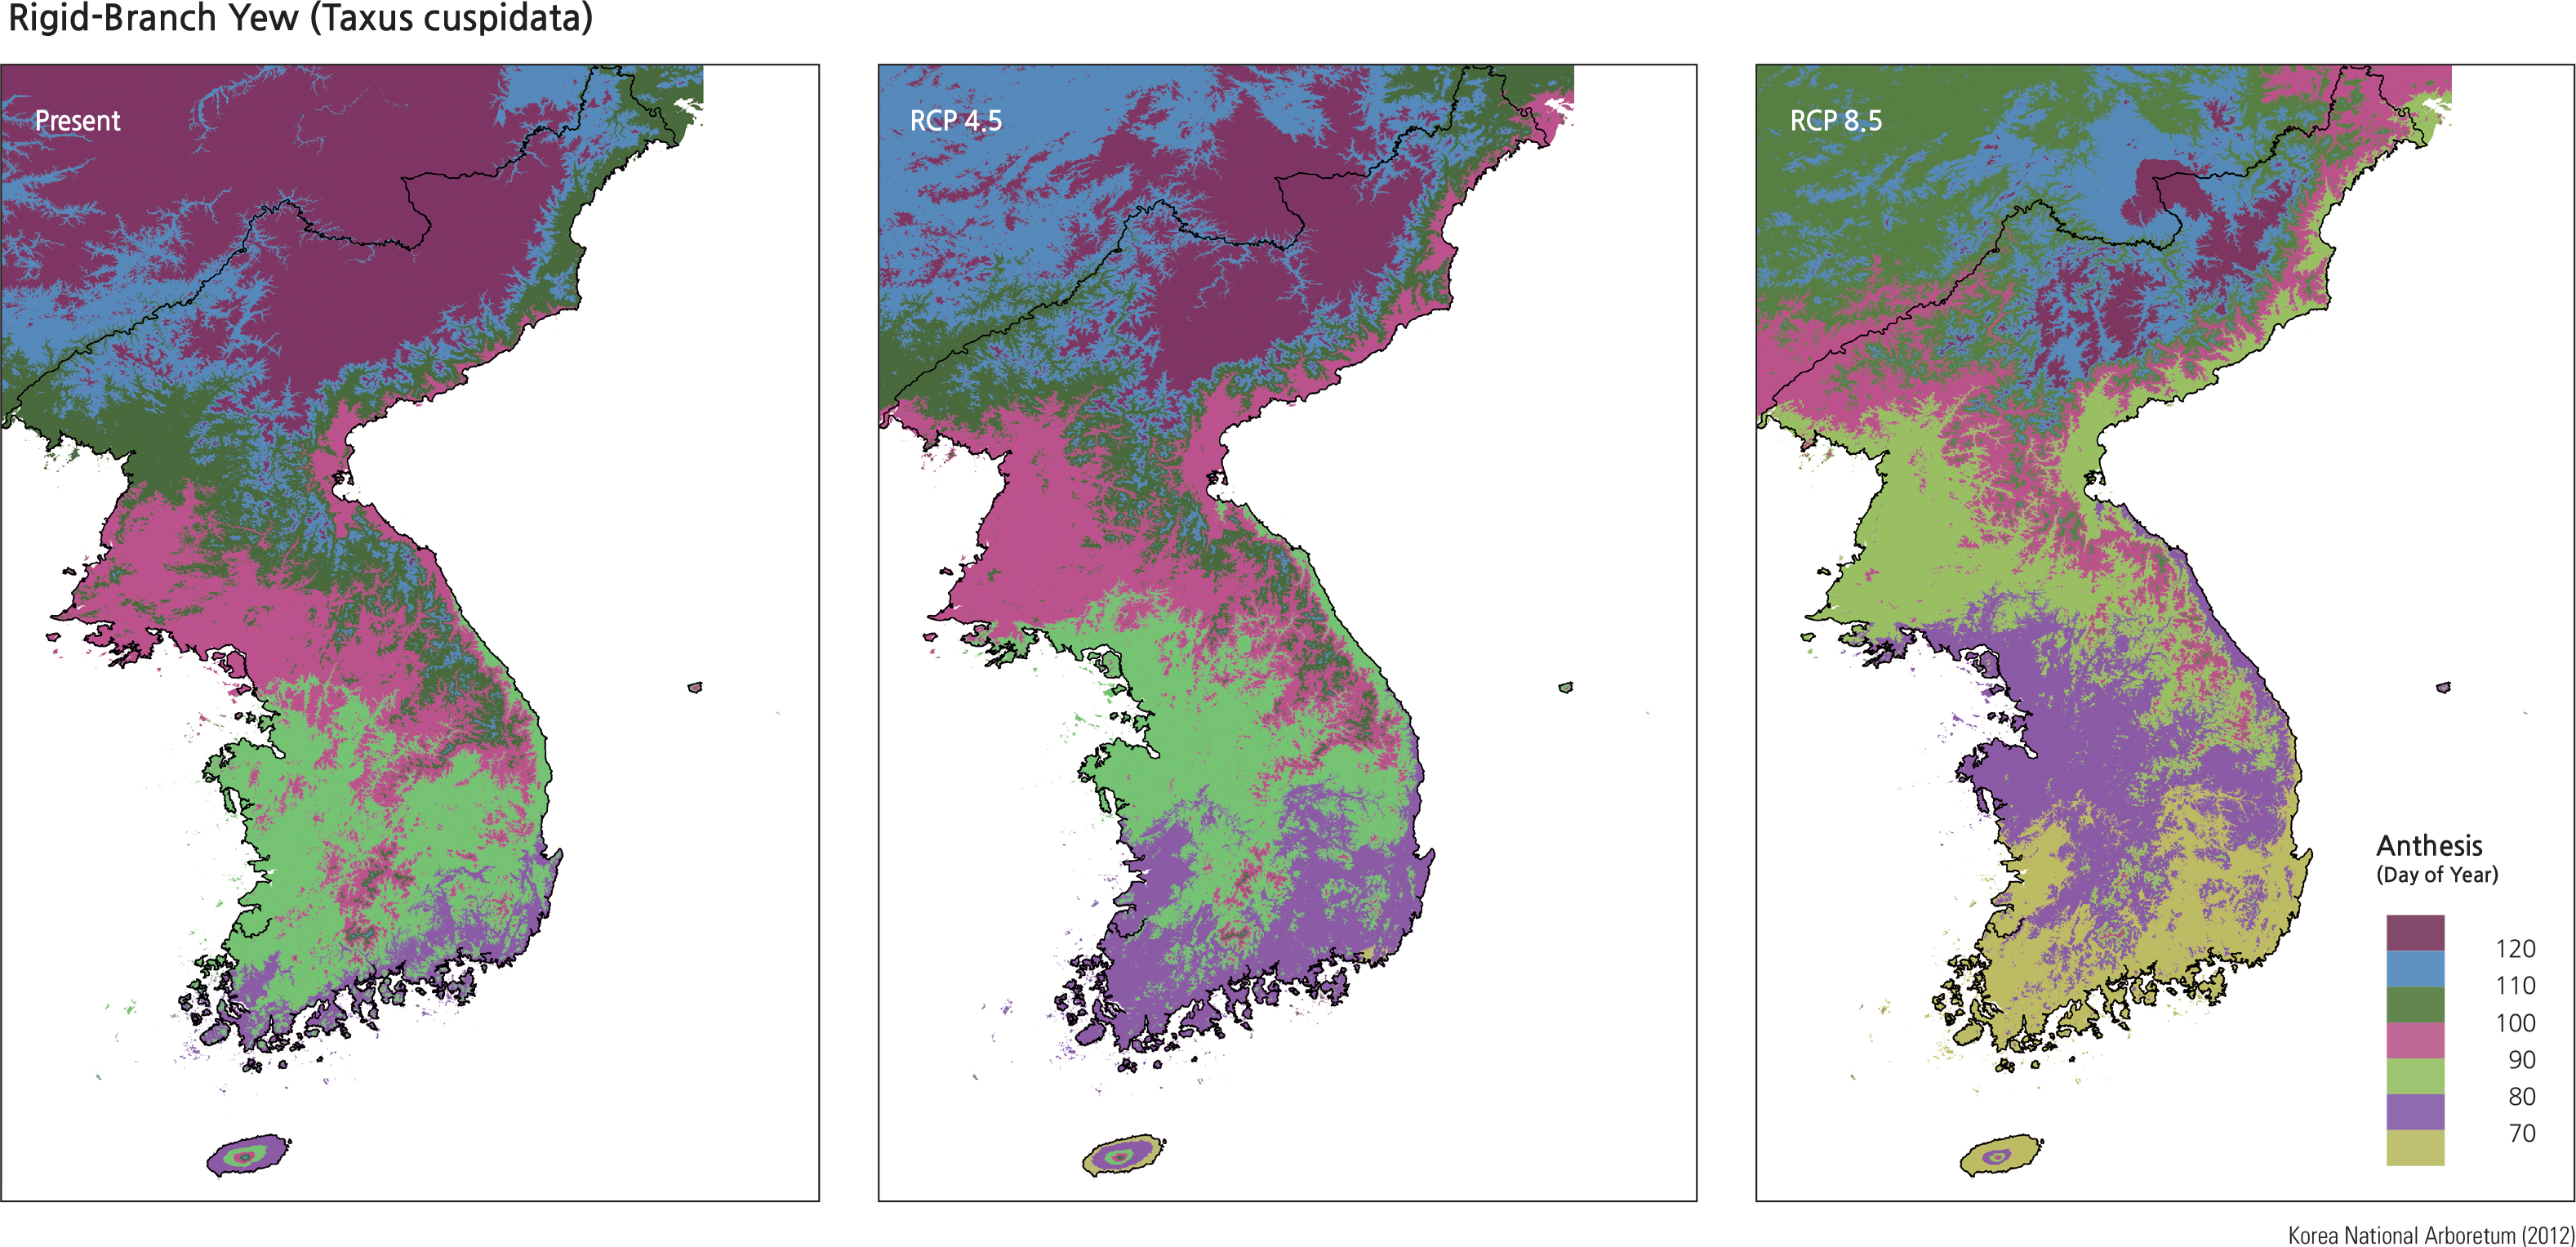
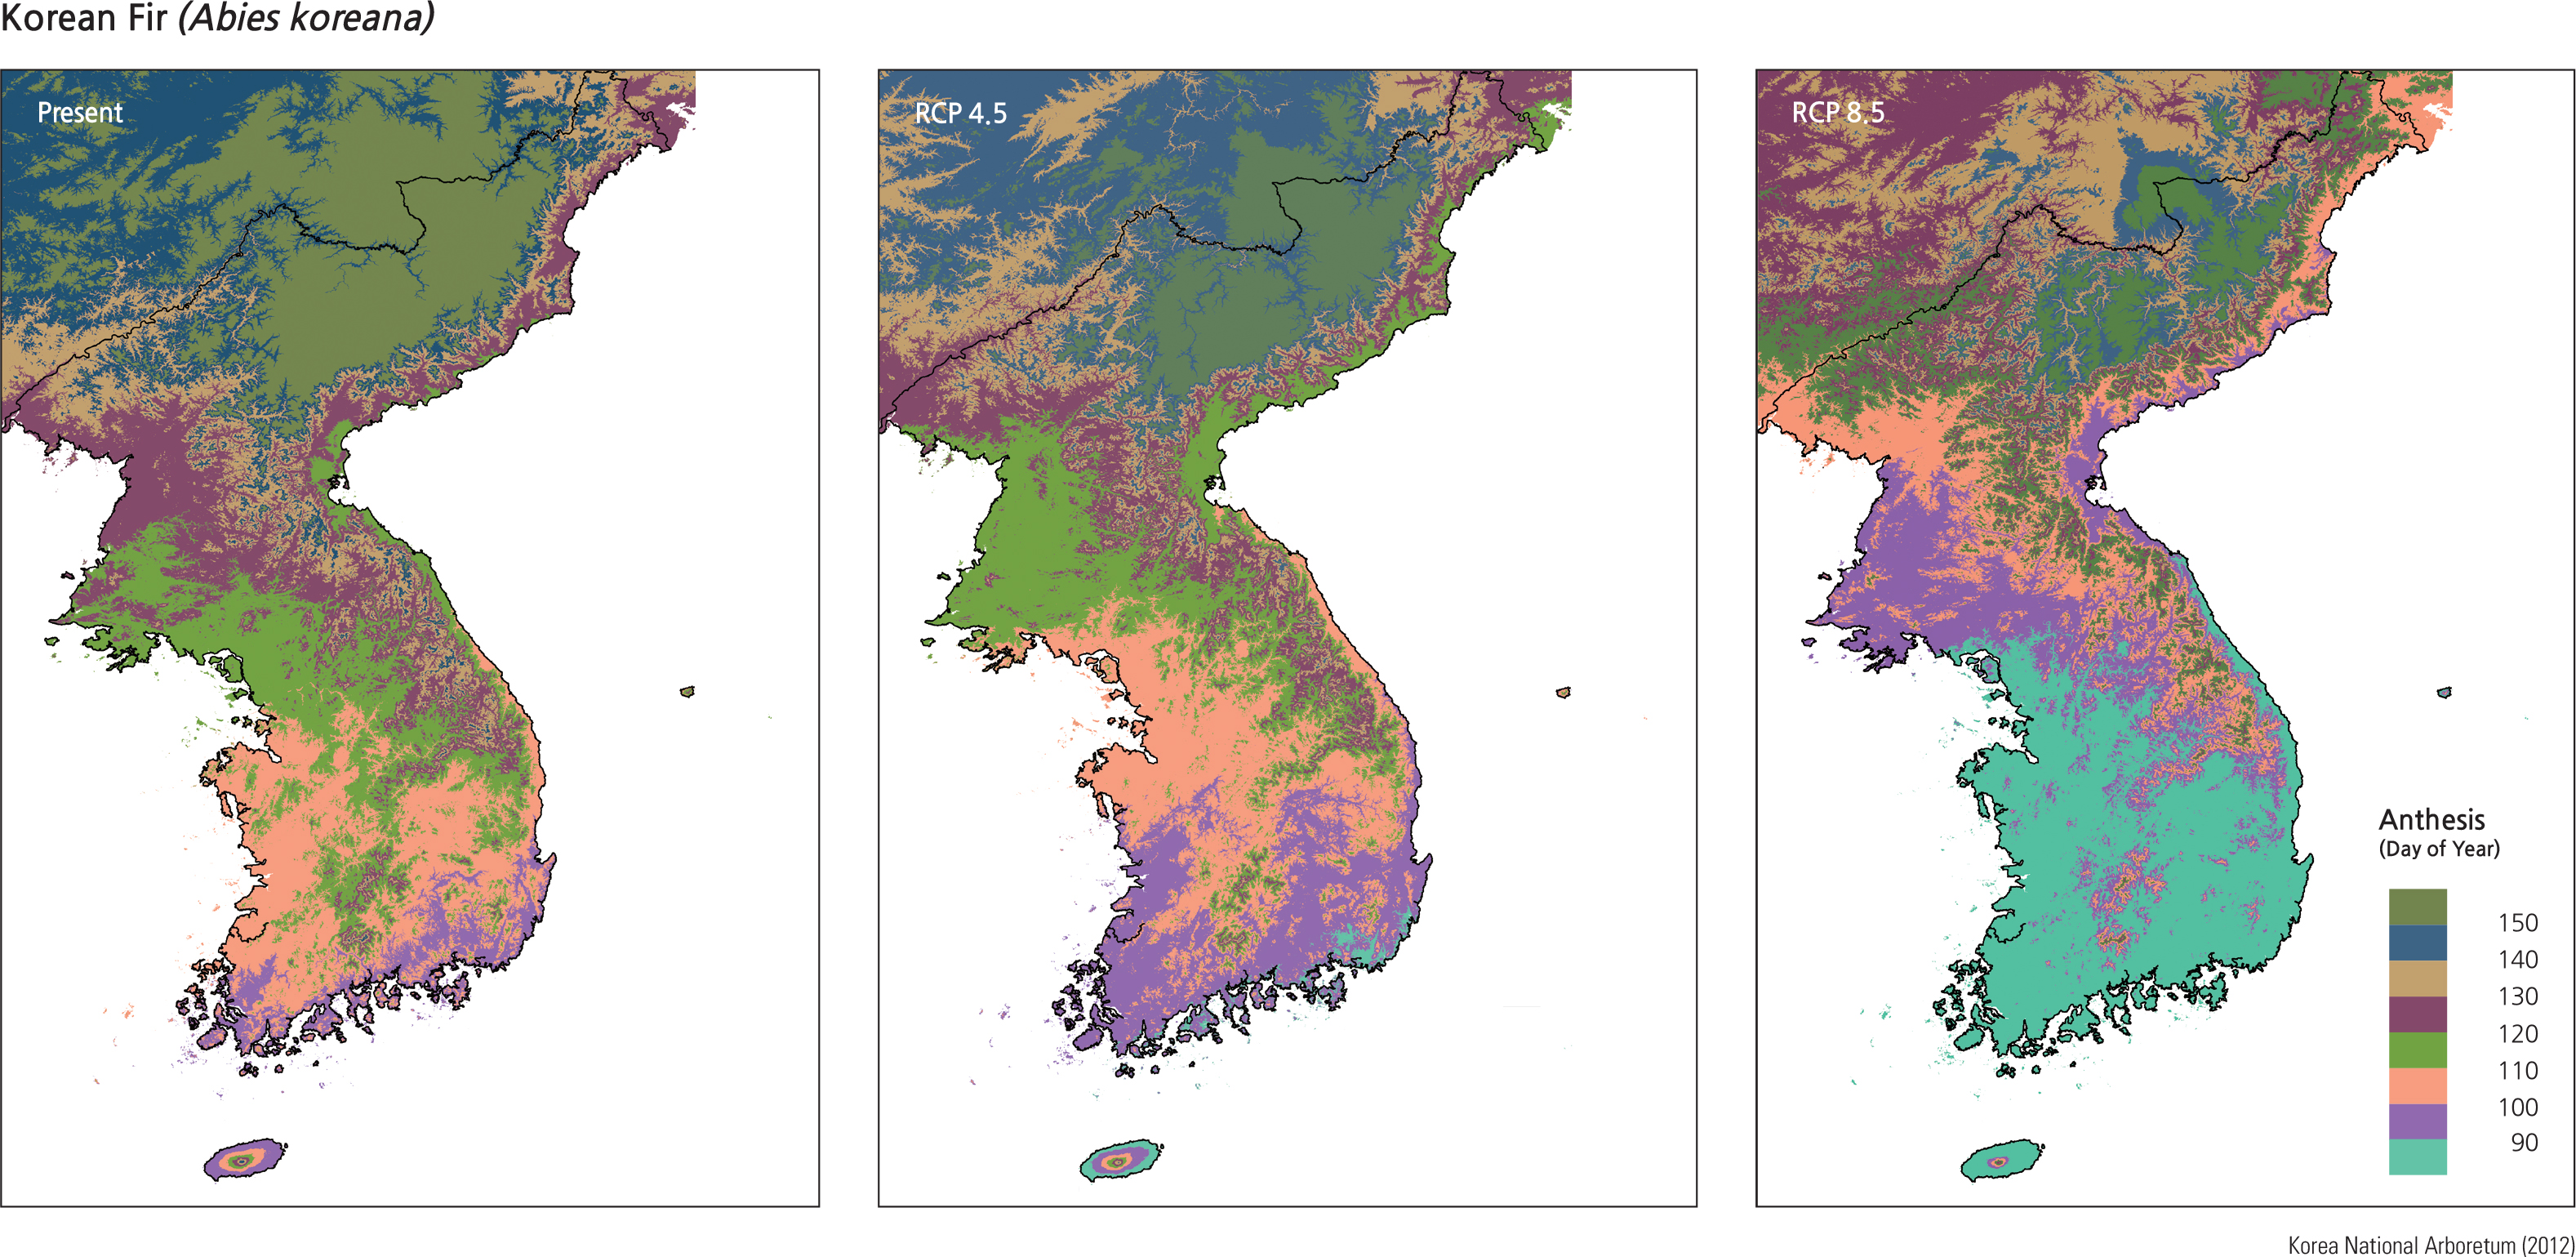
In the case of seasonal variation of plant phenology, the winter bud burst season and leaf unfolding season of rigid-branch yew (Taxus cuspidata) and Korean fir (Abies koreana) are expected to start earlier. Highland plants inhabiting the summits of Hallasan (on Jeju Island), Jirisan (south central), and Seoraksan (east coast) such as Korean fir (Abies koreana), dark-bark spruce (Picea jezoensis), Korean crowberry (Empetrum nigrum), rigid-branch yew (Taxus cuspidata), Khingan fir (Abies nephrolepis), and Korean arborvitae (Thuja koraiensis) are expected to decrease in population. Conservation of northern plants living in isolated environments such as alpine, sub-alpine, islands, and wind holes is becoming an important issue and a necessity. Once again, modeling of these species is based on the IPCC Representative Concentration Pathways (RCP) scenarios (see page 60).
Brief Interpretation of the Maps
The two sets of maps on this page show the anticipated change in when first buds appear and leafing starts in these two species (colors assigned to numbers are number of days after January 1). Each species shows quite different patterns that reflect their growth characteristics. The two sets of differing RCP scenarios are assigned as the results by the end of the century given different assumptions about global warming and socio-political controls of greenhouse gas emissions. RPC 4.6 projects a more conservation global warming effect and RCP 8.5 projects a worst-case scenario.
Please note that coloring across the map shows changes in anthesis where the species exists and should not imply that the species covers the landscape. Each species may be represented by relatively isolated groups of trees or concentrated forest stands. This means that the changes shown represent highly variable numbers of trees and a pixel of color may represent a small number of trees that are not representative of the population as a whole in the area. It would be very difficult cartographically to show the anthesis progress only on existing trees. To map the actual affected individual trees would represent a huge expenditure of time in locating the trees for analysis.
For example, a small group of trees in an urban park surrounded by high rise apartments that generate heat on their own may show a different anthesis color date than in a rural setting five km away. This would show a useful difference in average anthesis that would be invisible on a map of this scale. This situation should warn the reader that great detail on a small-scale map does not necessarily mean high precision.
The size of the anthesis color bands is important to give a general rate of progression of the global warming effect. In the Korean Fir RCP 8.5, the below-90 day band is much larger than the next two bands. What does this imply about the speed of annual maturing of the firs? Could this affect the dates of a fir forest being susceptible to lightning-caused forest fires?
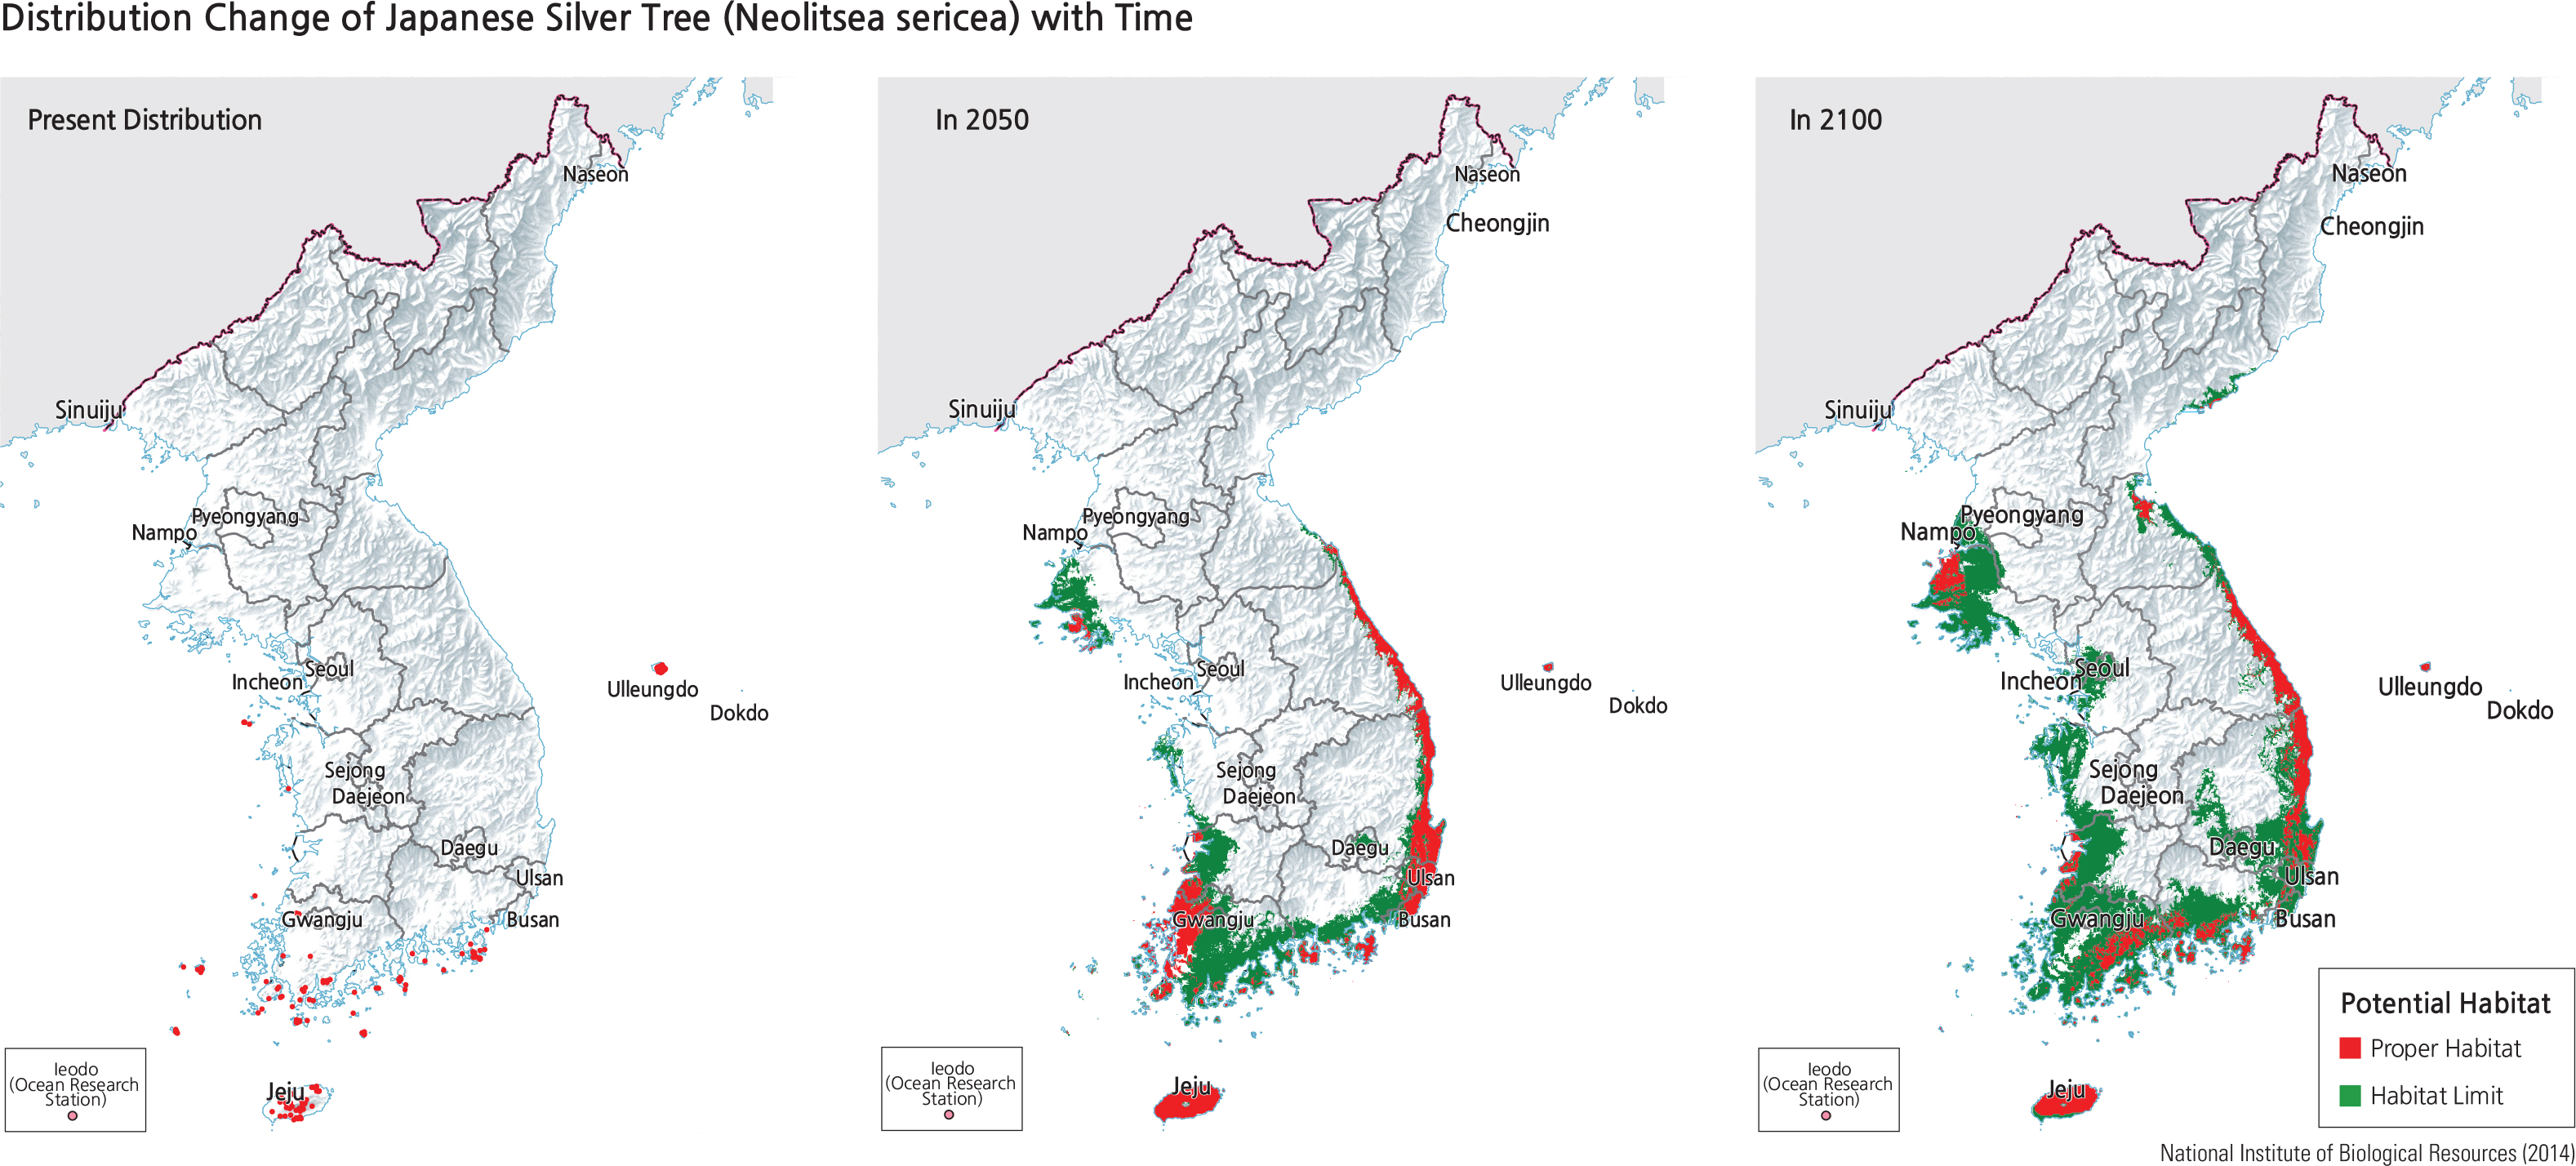
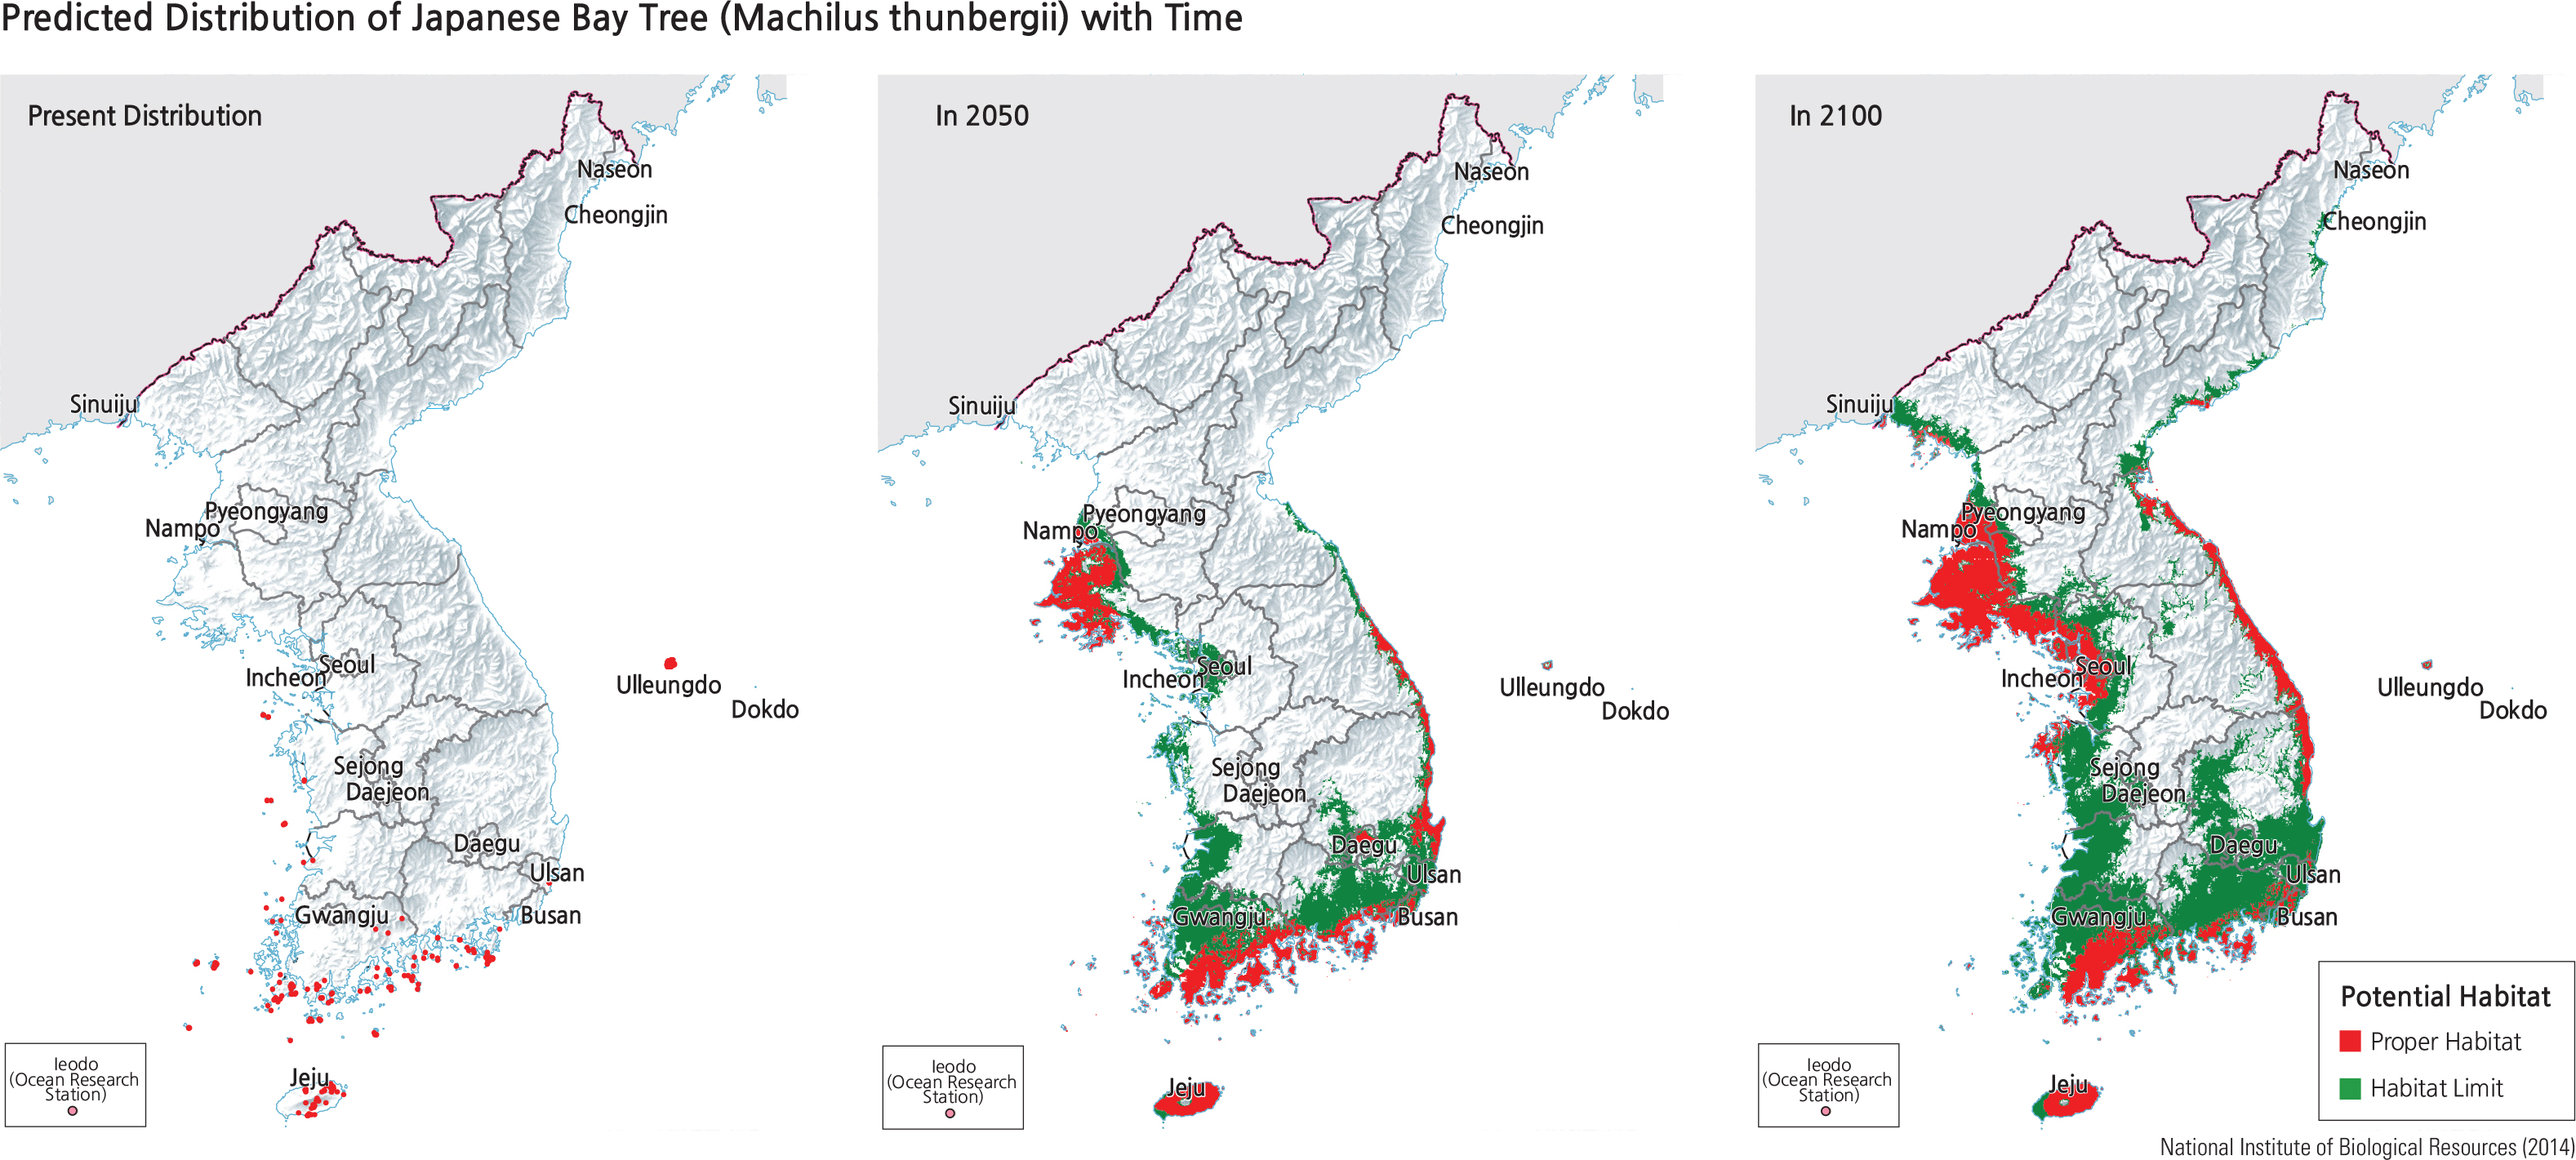
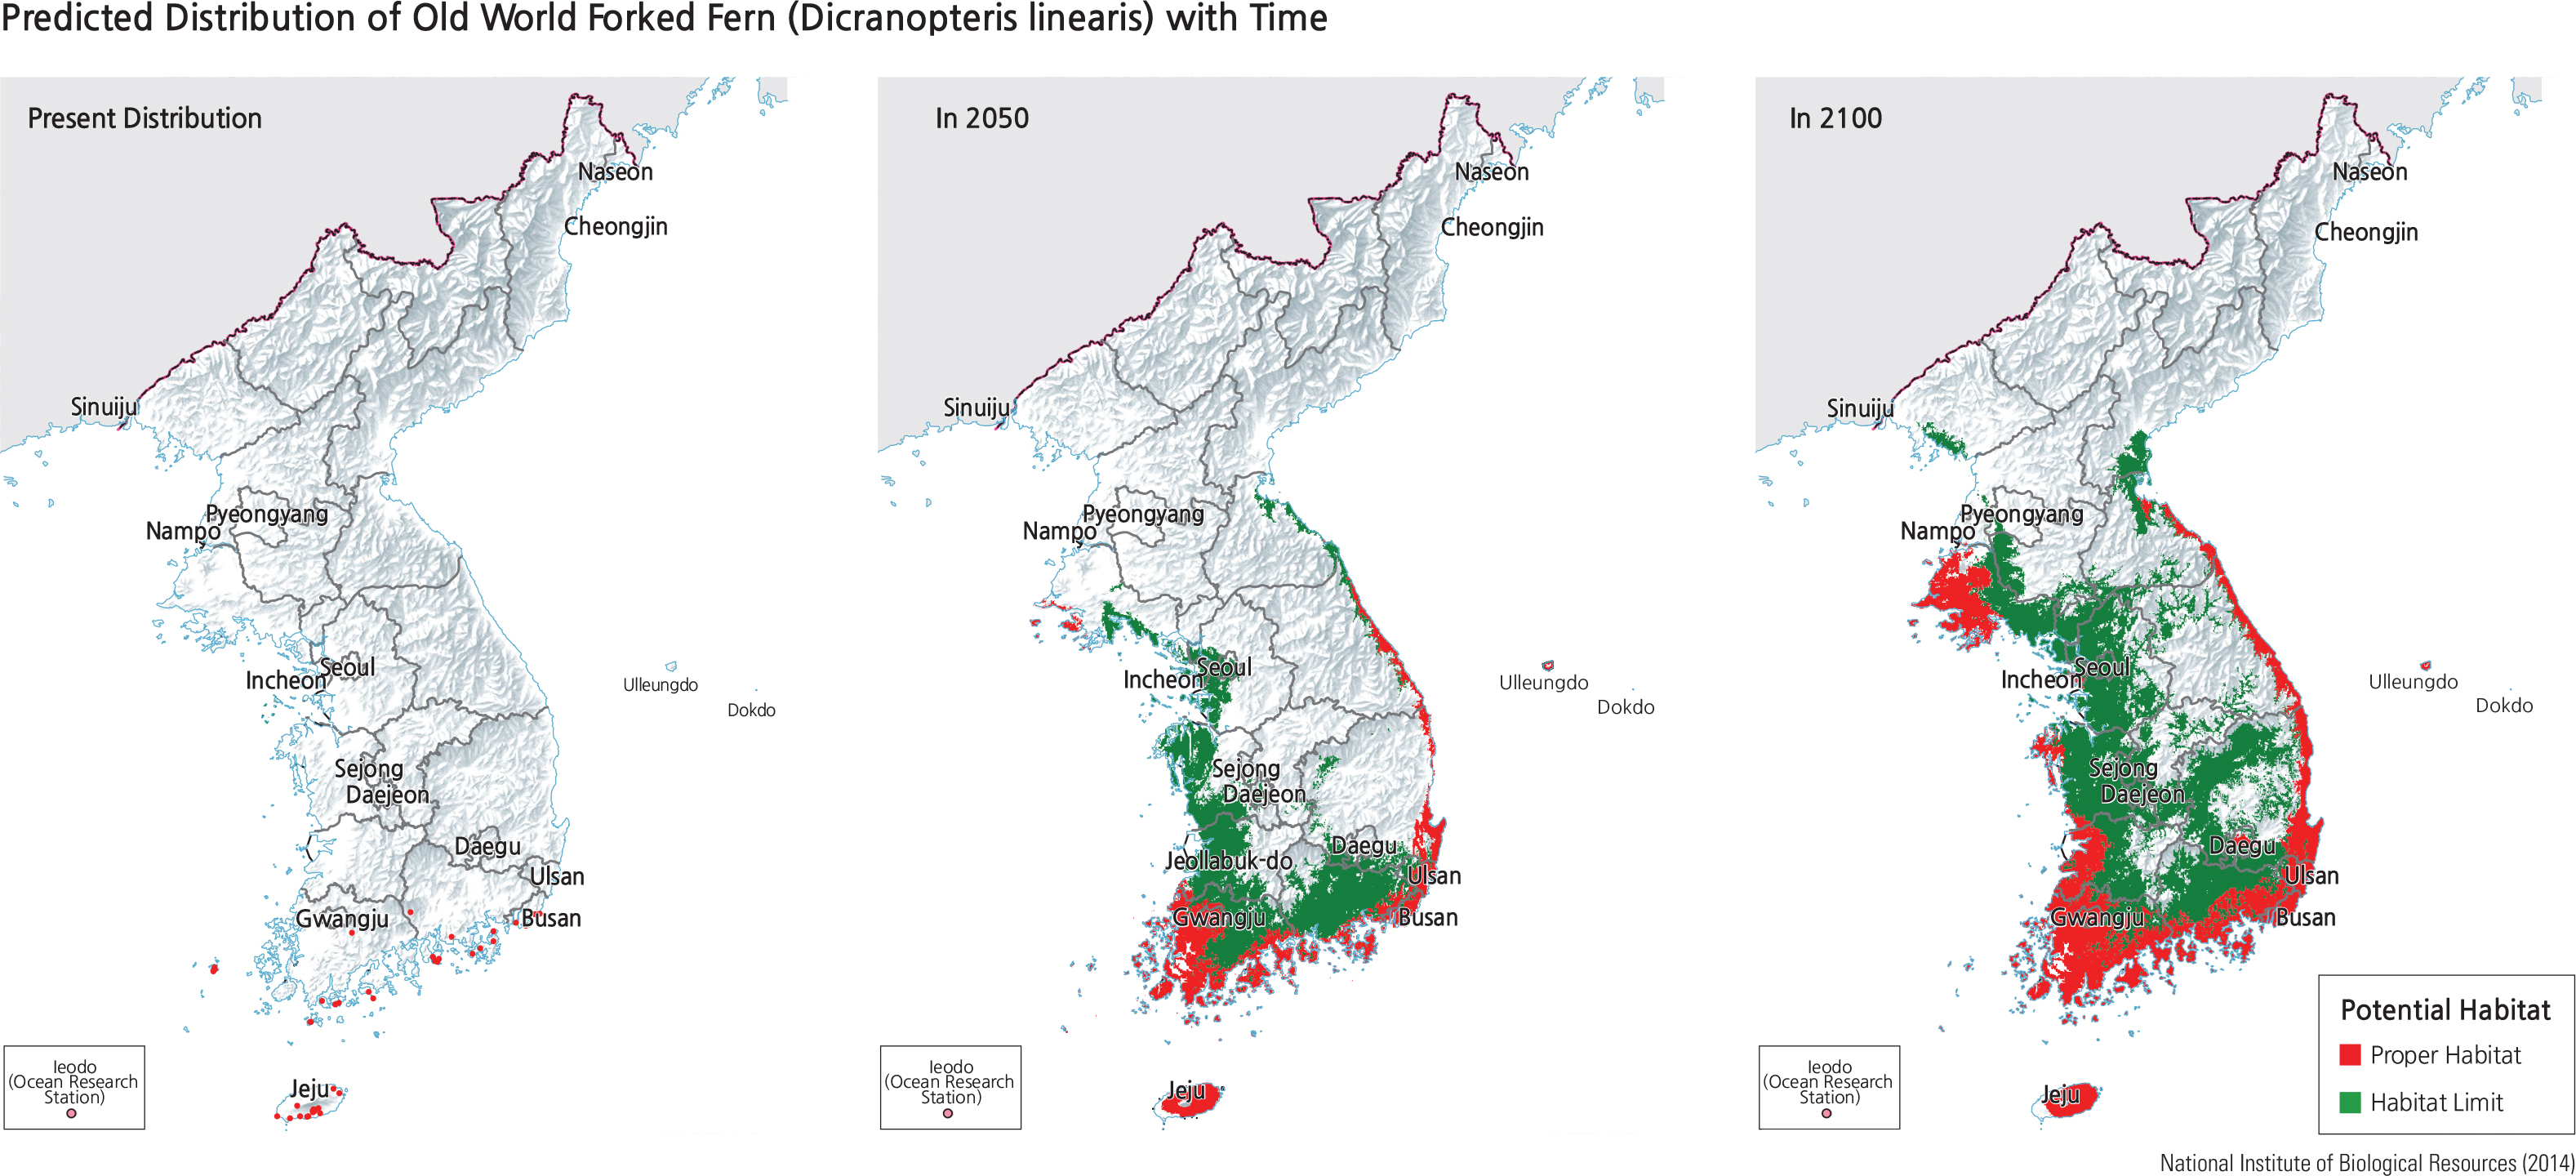
Concerns about the impacts of global warming and extreme weather events call for the preparation of adaptive measures against effects of climate change on the biota in Korea. As a result of these required measures, studies on future spatial changes of some species’ distributions are being carried out to scientifically analyze and estimate the impacts and risks of such re-distributions. These studies also include the development of predictive habitat suitability maps for species that are Climate-sensitive Biological Indicator Species (CBIS) and candidates for CBIS. Future climate projections are based on Representative Concentration Pathway (RCP) scenarios defined by the Intergovernmental Panel on Climate Change (IPCC).
Japanese silver tree (Neolitsea sericea), Japanese bay tree (Machilus thunbergii), and Old World forked fern (Dicranopteris linearis) are some of the representative subtropical evergreen plants in the southern provinces of Korea. These subtropical species are expected to undergo a nationwide spread in their distribution due to accelerating global warming. Therefore, subtropical species are expected to result in a serious competition with the temperate plants inhabiting the region. Continuous monitoring and longterm research for future prediction are proposed to mitigate the expected damage to the biodiversity in Korea. The results of the study are expected to be implemented in the development of climate change adaptation policies for biodiversity in East Asia and in the establishment of the selection criteria for climate change index species.
Brief Interpretation of the Maps
The nine maps of three evergreen species portrayed on page 66 are labeled “resent,”“050,”and “100.”The two future sets of maps are projections made from the RCP scenarios; however, the scenario number that was used in these projected patterns is not supplied as that makes it difficult to assign rates of projected changes to projected years. Ecosystems of specific species are very complicated combinations of environmental conditions. Some species are sensitive to very small changes in one element of those conditions and some can exist under very broad ranges of multiple conditions.
Notice the size of the three evergreen's ecosystems. They exist in very small island areas, but are variable in size even on small Jeju. However, when the size of the potential ecosystem is projected into the future, the evergreens are much larger on the mainland, but that does not mean they will actually occupy the possible environmentally fit areas in those projected years. Projecting the future is a fascinating process but also one that may not become a reality for many unforeseen reasons yet to be understood.
Almost all of the projected “roper”and “imits”habitats on the mainland are contiguous, postulating movement of the species in their habitats. If the first mainland “contact” or “rigin”points did not occur in 2040, would that make the species extinct in 2050?