The population of a country or a place can be studied in several different ways—each providing valuable information as well as foundations to make projections on increasing or decreasing trends. We can study the distribution of a population (where people are located); the density of the population; the net change that involves natural increases (births), decreases (deaths), and migrations (in and out of an area); the structure or composition such as age pyramids that show the percentage or absolute numbers of each age group; the ratio between male and female; the fertility rate; the labor force; the aging population; and many other social, economic, housing, and health characteristics. Understanding the Korean population picture will greatly help the government assign resources appropriately, make better spatial plans, and improve on living environments.
Geographically, the population is concentrated in the Greater Seoul Metropolitan Area. In 1949, the Greater Seoul Metropolitan Area had 21% (4.2 million) of the total population. By 2010, this increased to 49% (23.8 million). The population percentages in all other regions declined during this period. Particularly, the Honam region (which is comprised of Jeollabuk-do and Jeollanam-do Provinces in southwest Korea), with a shrinking population, experienced the highest drop. From 1949 to 2010, the population of Korea grew by 28.4 million to 48.4 million. The Greater Seoul Metropolitan area gained approximately 19.7 million, followed by 6.4 million in the Yeongnam area (which is comprised of Gyeongsangbuk-do and Gyeongsangnam-do Provinces in southeast Korea). These two areas account for about 92% of the total population increase during this period. This population growth also parallels the economic growth for these areas. Resources such as capital, technology, and labor have been concentrated in these two regions during the period of the fastest economic development of Korea.
The majority (over 90%) of the Korean population lives in urban areas. As of 2010, there were many neighborhoods in urban areas with population densities exceeding 10,000 persons per square kilometer, particularly in the Greater Seoul Metropolitan Area and regional metropolitan cities such as Busan, Daegu, and Gwangju.
Depending on how population data are collected, there are multiple population statistics such as resident registration population, estimated population, and the census population. The resident registration population uses the household registration data, and it is usually the largest of the three statistics. Frequently, an individual’s actual residence is different from his or her registered residence for a variety of reasons; to help address this issue the population census is conducted every five years. In between the official censuses, Statistics Korea (the Korean census bureau) publishes an estimated population every year to provide information between censuses. Because the population census cannot attain a 100% response rate, the resident registration population is considered the highest total, followed by estimated population and census population.
Population density in Korea increased from approximately 210 persons per square kilometer in 1949 to 470 persons per square kilometer in 2010. Except for Bangladesh and some city states, Korea has one of the highest population densities in the world. Until 1966, both the Greater Seoul Metropolitan Area and the Honam area had higher population densities than the national average; by the mid-2010s only the Greater Seoul Metropolitan Area exceeded the national average. The population density of the Greater Seoul Metropolitan Area increased from approximately 350 persons per square kilometer in 1949 to 1,990 persons per square kilometer in 2010. It is one of the highest in the world, except for some city states such as Monaco (18,500 persons per square kilometer) or Singapore (7,230 persons per square kilometer). Reflecting this trend, the geographic center of Korean population continues to move towards the Greater Seoul Metropolitan Area.
Brief Interpretation of the Maps
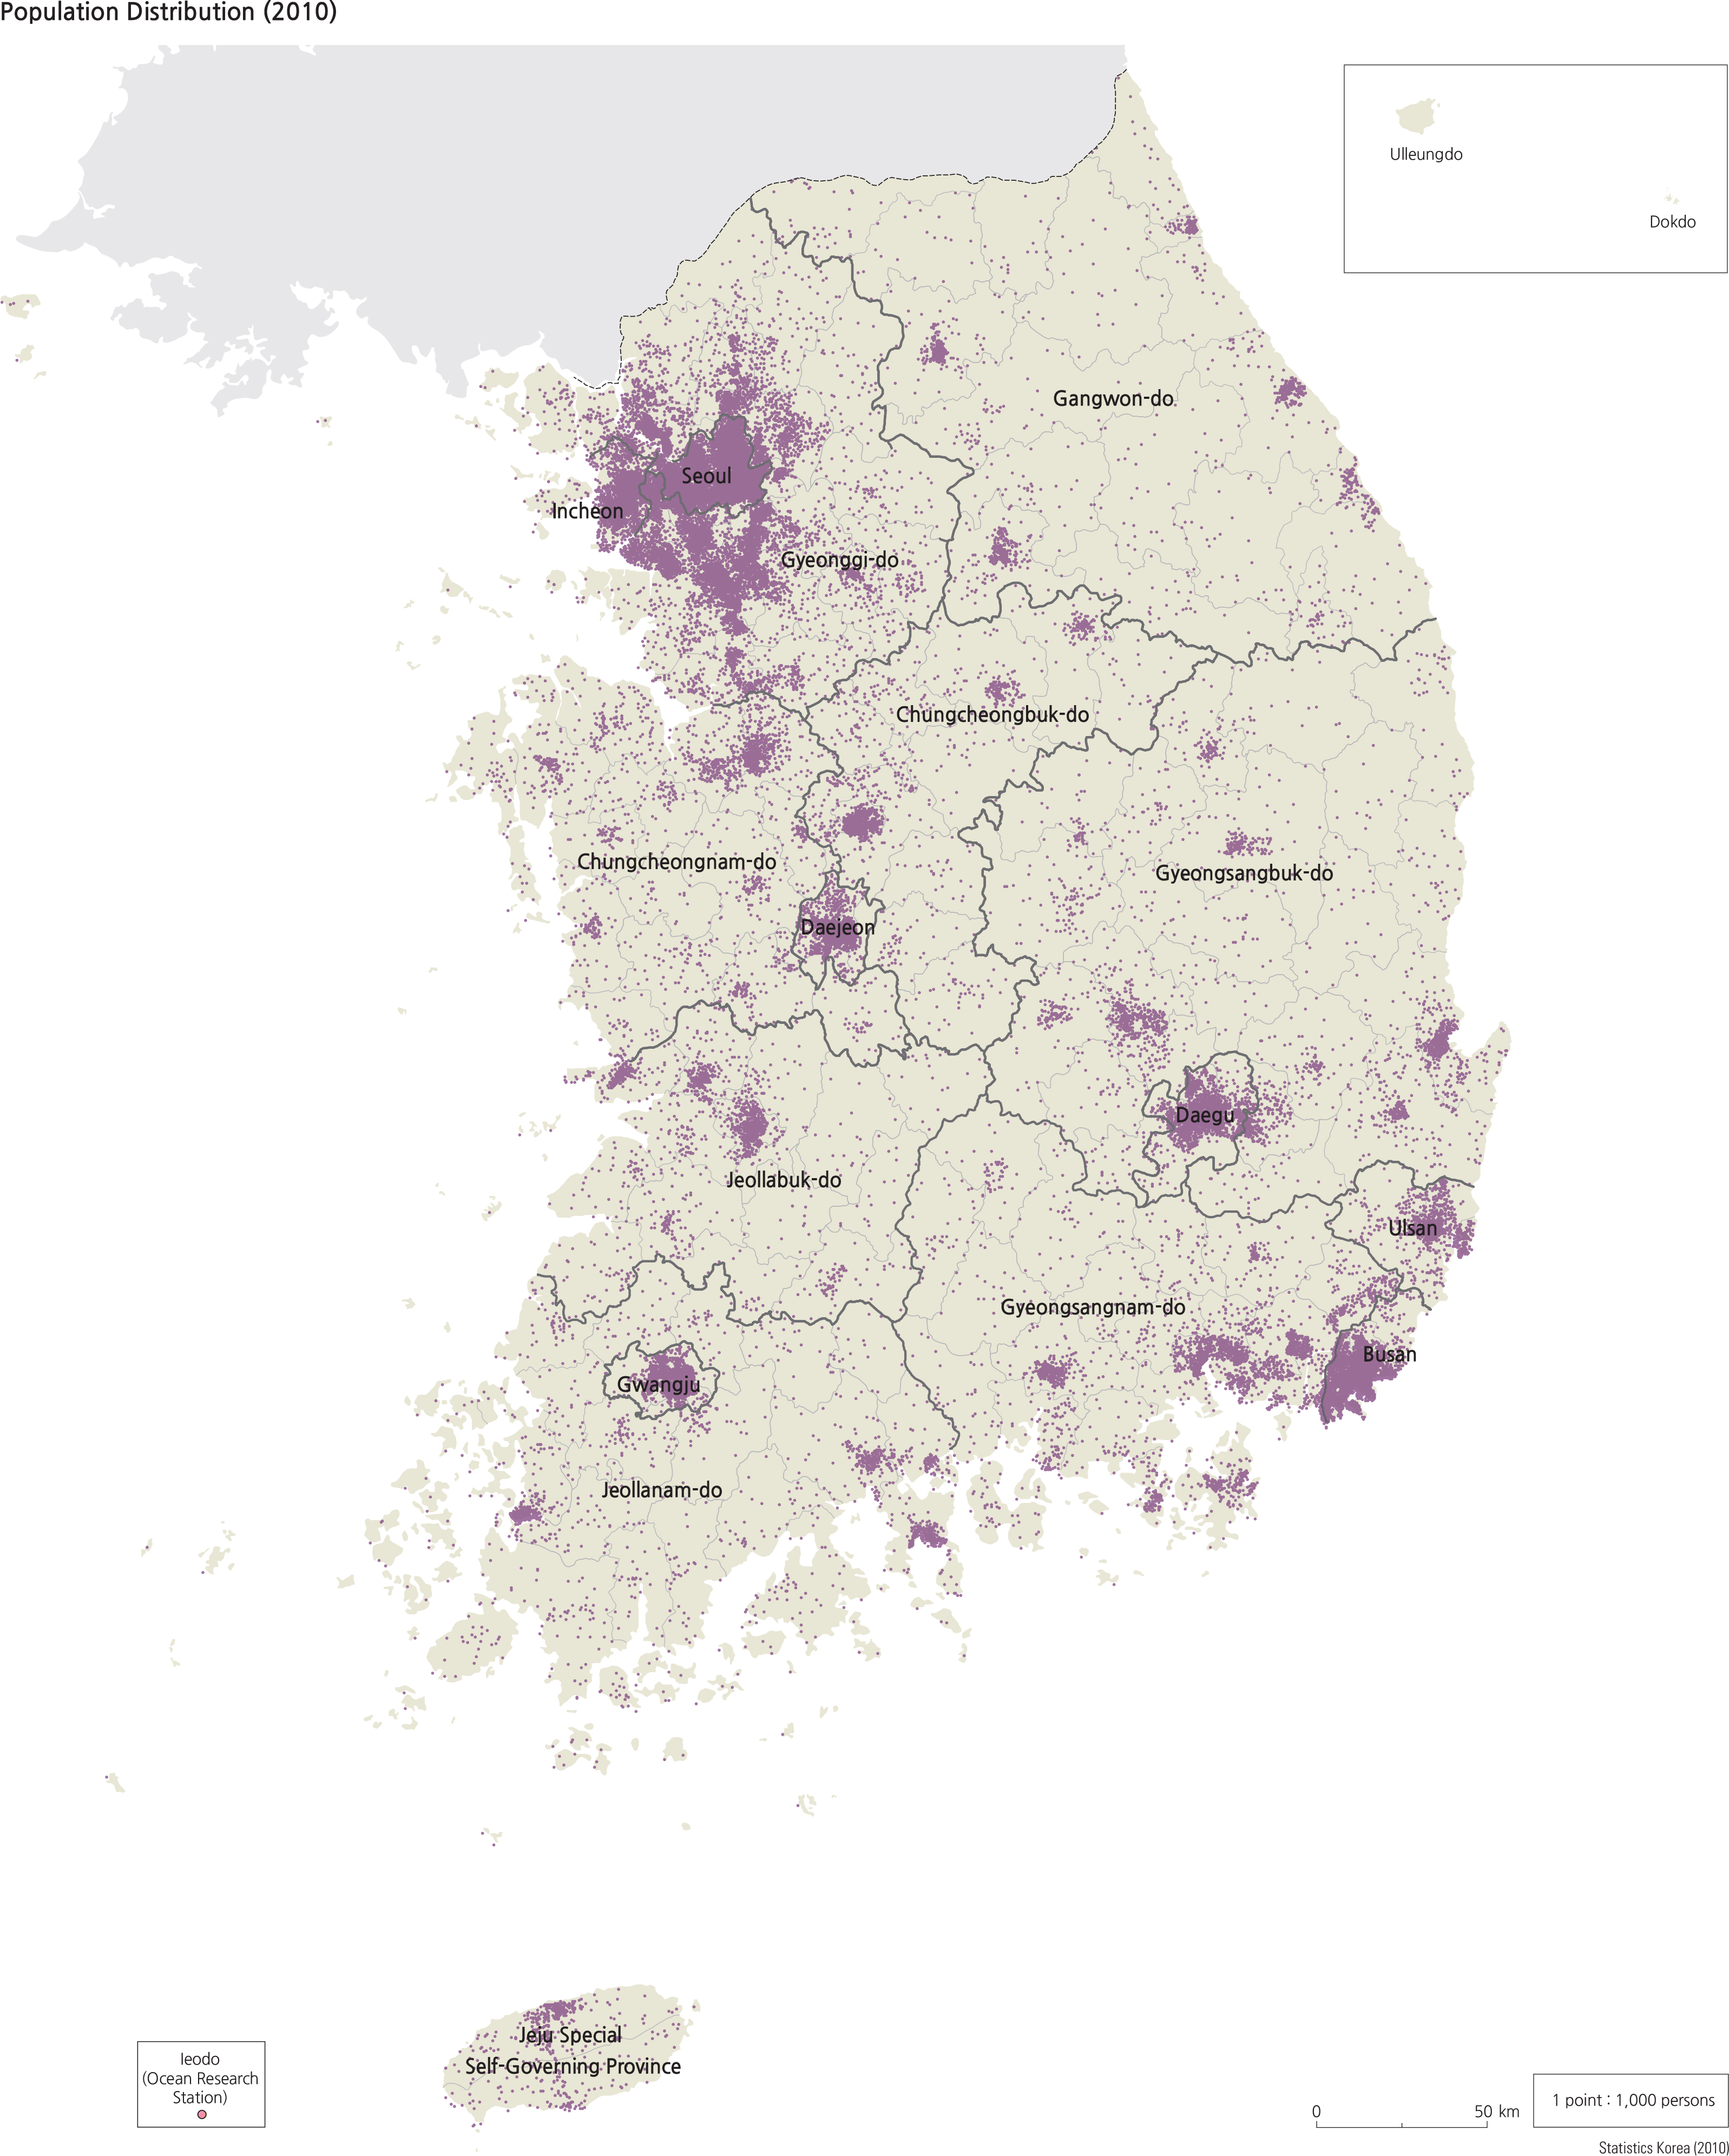
The Population Distribution (2010) map is a dot map with each dot representing 1,000 persons. It distinctly shows that the population is clustered around large and
small urban areas. Comparing this map with transportation network maps of Korea (pages 74-75), one can readily see the correlation of population distribution along the major branches of the transportation infrastructure. The government has invested heavily in industrial and economic centers and linking them with an efficient transportation network; these centers provide jobs as well as social services which attract population. Thus, the population distribution pattern correlates with the patterns of industrial and economic centers. Much smaller populations do exist in rural areas, as evidenced by the sparse and scattered dots on the map.
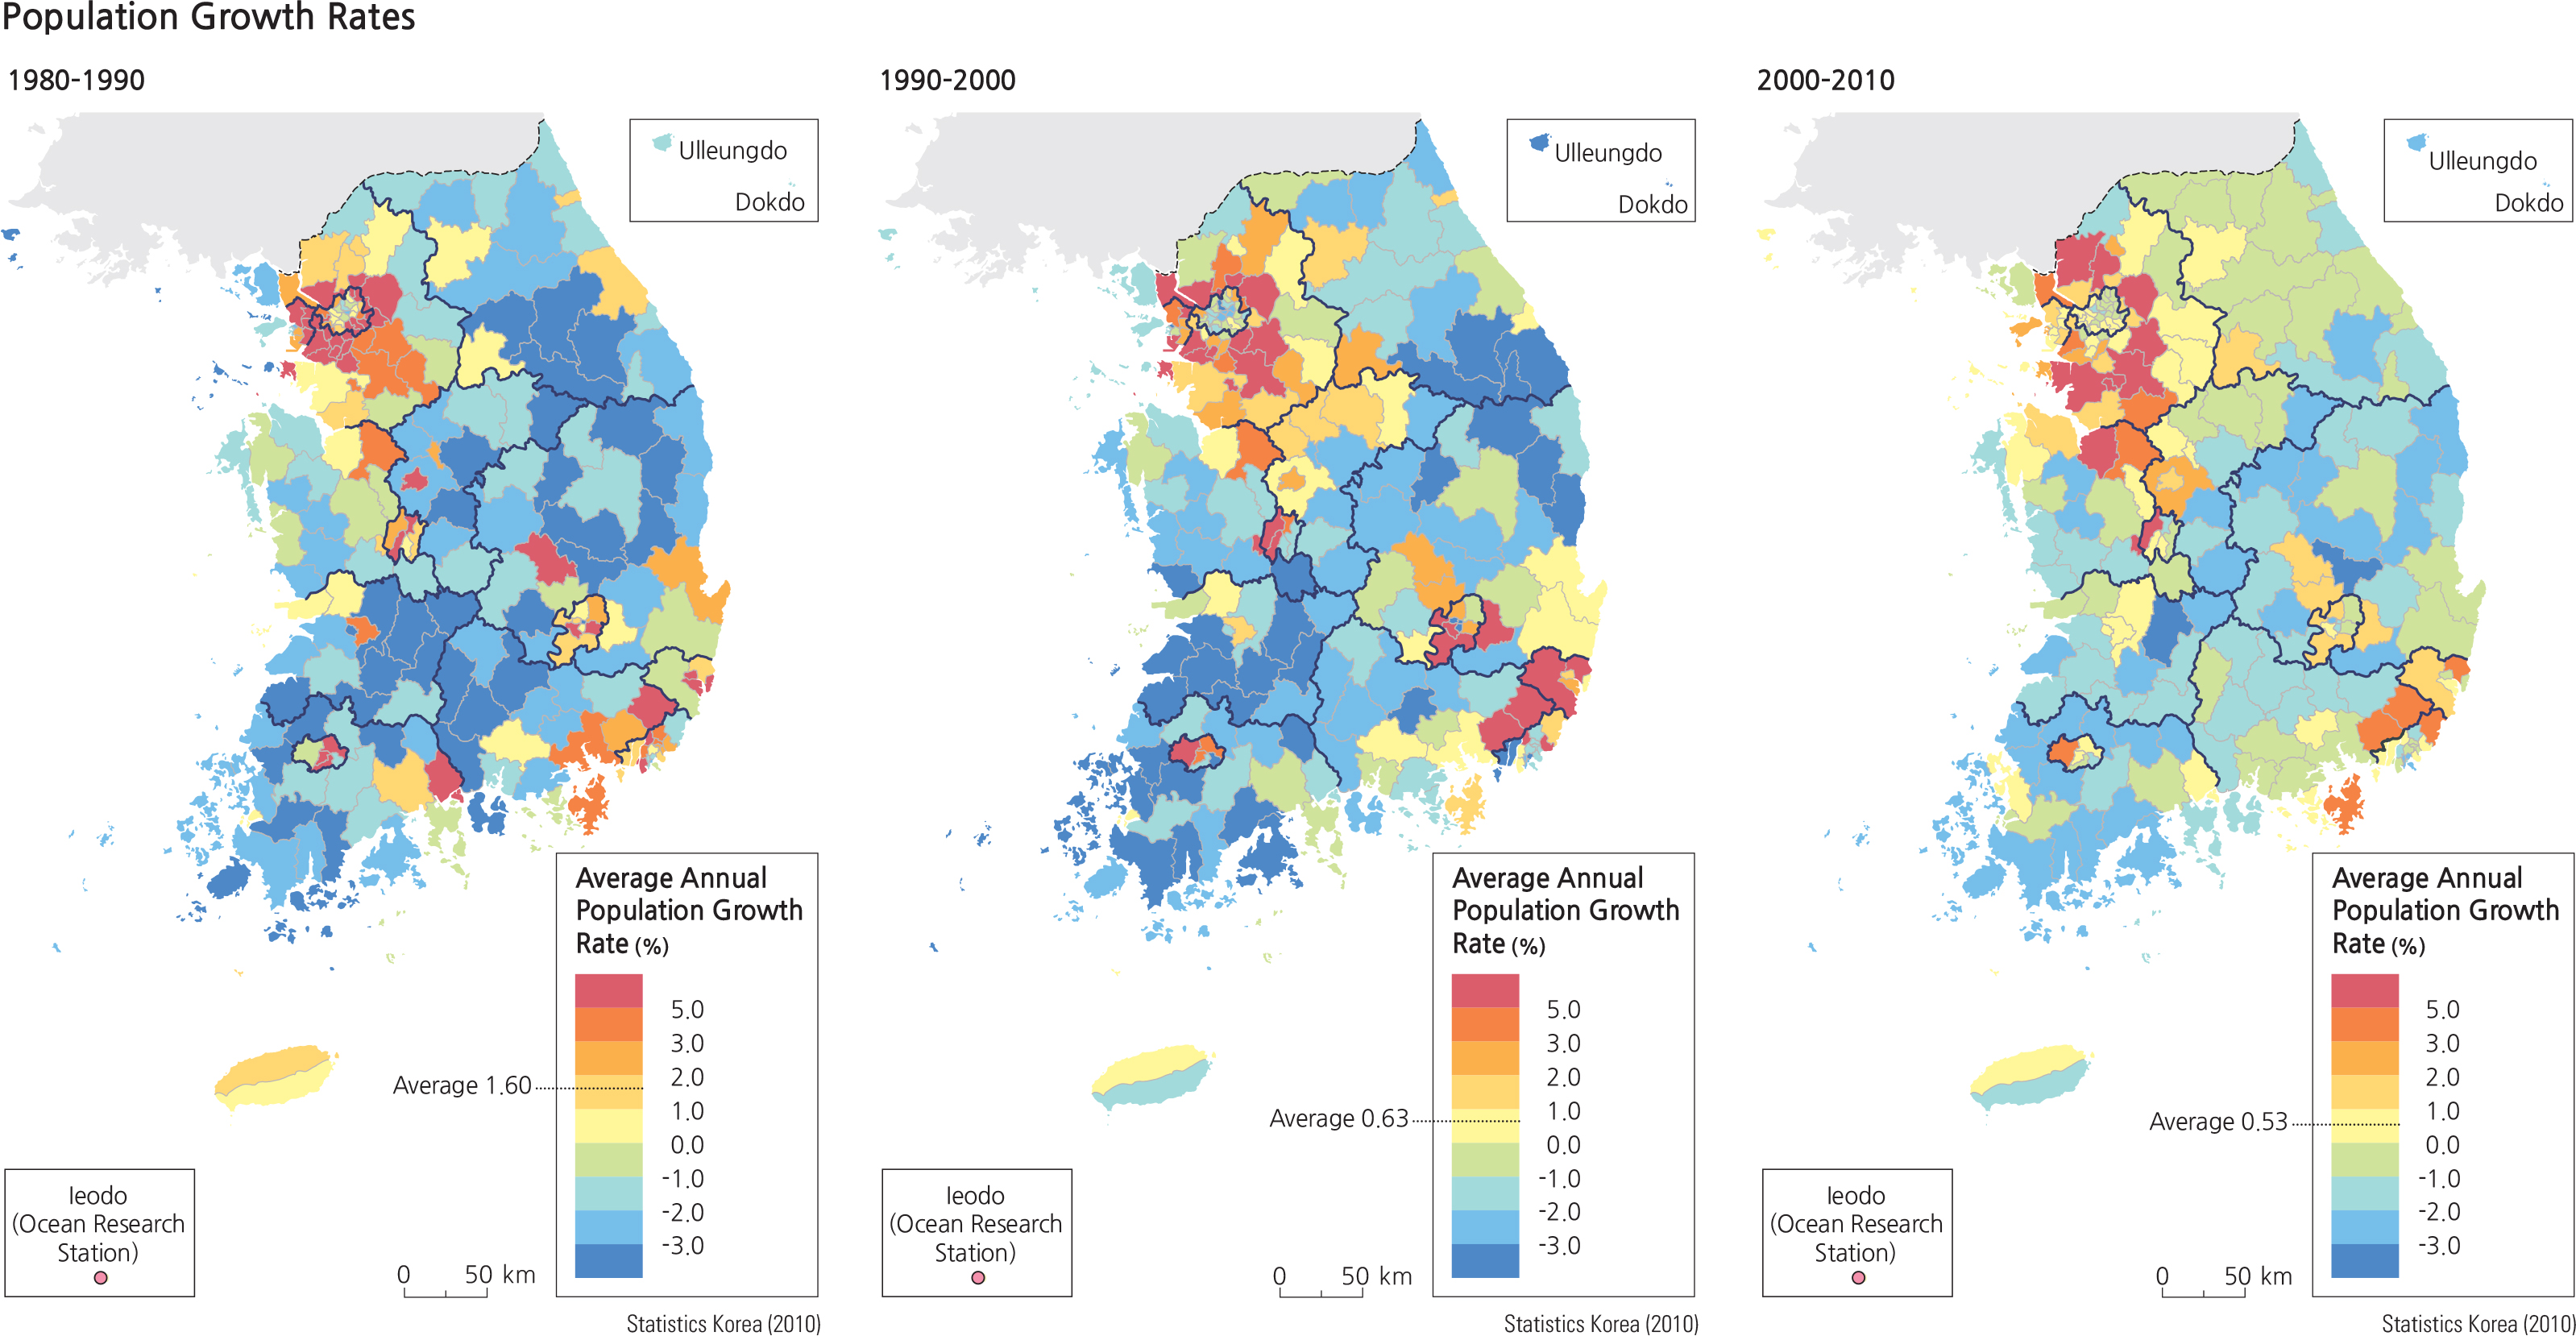
The three maps that depict population growth during three decades (1980-1990, 1990-2000, and 2000-2010) show the changes in growth rates. All three maps illustrate declining growth rates in the -si/-gun/-gu level across the northeast to southwest axis while rates increase generally in urban centers. On closer examination, Seoul and Busan are shown to lose population to the surrounding respective suburbs. The decline rate is lower in the rural areas for the 2000-2010 periods because much of the area had already been depopulated in earlier time periods.
Given that most of the industrial and economic centers have long been entrenched in the current locations, do you expect to see great spatial changes in the population in Korea? If so, how would these changes come about? If not, how would factors such as natural increase or decrease, migration, or changes in fertility rates affect population spatial patterns?