In the process of rebuilding the nation, stabilizing the government and transforming the land, careful thought and legislation must be implemented to realize successful results. Korea has implemented the Spatial Planning Program that must consider a very complex and necessarily harmonious interplay of economic growth, land development, environmental issues, urbanization, transportation efficiency, population distribution, employment, proximity between the work place and home, health care, education, and other social welfare and social services that taken in totality will produce a sustainable high quality of life.
Spatial planning in Korea has been greatly advanced with the development of the national territory since 1960. It is the standardized and refined framework that is utilized to maximize the efficient use of Korean territorial land and water bodies. Spatial planning is also a key component in the Comprehensive National Territorial Plan (CNTP), regional development plans, and comprehensive city/county plans. The intent of spatial planning is to seek balanced approaches to land development, to enhance the competitiveness between regions, and to pursue the environmentally-friendly management of land.
More specifically, the CNTP is a master plan to efficiently manage territorial land resources in a manner that is compatible with the goals and underlying strategies of national policies. The first CNTP (1972–981) was implemented in 1971; it was followed subsequently by the second CNTP (1982–991), the third CNTP (1992–2001), and the fourth CNTP (2000–020). After the implementation of each of the first three comprehensive national territorial plans, newer concerns and unanticipated situations and priorities were learned. New insights were envisioned and adjustments were made to improve planning strategies for the future.
With the rapid economic growth and urbanization in Korea national development progressed in an unbalanced manner. In order to narrow the development gap between regions, various regional development plans have been carried out. Plans such as the Enterprise City, the Innovative City, and the Multifunctional Administrative City have been designed and implemented. In the mid-2010s, a five-year regional innovative development plan has been executed with the aim of promoting local economic self-reliance through regionally specialized development. Additionally a district development promotion plan has also been applied to areas that remain significantly underdeveloped. A culture and tourism development plan has also been prepared to help foster more distinctive regional development projects.
The Fourth Comprehensive National Territorial Plan reflects the integrated national territory of the twenty-first century. It seeks to realize a globally oriented national territorial structure and to promote globally competitive cities based on “Wide Area Economic Zones.” To achieve this goal, the Fourth Plan established a national supraeconomic network of regional axes which linked Wide Area Economic Zones as well as the coastal areas with inland areas, and further linked the three coastal areas and the border area between South and North Korea.
Brief Interpretation of the Map
This map illustrates details on Korean developments and requires careful examination of the symbols for a full comprehension of the various distributions of development structures. While transportation networks stand out and have been adequately addressed with previous maps, the map includes distributions of industrial complexes, high tech complexes, innovative cities, enterprise cities, national parks, ports, and airports. The highest concentrations of national industrial complexes are along the south coast of Korea, around Seoul and the immediate surrounding areas around Seoul. Some are scattered in the central and western portions of the country. High tech industrial complexes are those that specialize in digital innovations; they are mostly located along the Seoul-Gwangju Corridor but always close to urban centers and with easy reach to the expressway.
Innovative cities are engaged in research and development, and are scattered in the west and the south. There are fewer enterprise cities than innovative cities; these are focused on promotion of businesses. They are purposely located away from major cities with the aim of promoting the local economy.
Thus, the planning process is thoughtfully managed to take advantage of local geographies as well as promoting national interests. This particular map is the result of the culmination of three previous versions of spatial planning. As the nation continues to grow with varying degrees of geographic concentration, new developments and new opportunities will continue to define new challenges for an ever changing set of spatial planning components.
The purposes of spatial planning are multifaceted: easing congestion in metropolitan areas, spreading out the location of different industries, sustaining an efficient transportation network nationwide, and providing citizens with a high quality of living. While national parks are not designed to provide important financial gains, they serve as leisurely spaces that support an escape for citizens from daily work stress and perhaps even places to find solitude. Describe the distribution of national parks. What can you conclude about accessibility to the parks? There are several ports along the northeast coast and there are many in the south. Do you think that the northeastern ports serve the same function as those in the south? What do you think are the main uses of the northeastern ports?
The Development of Transportation and Communication
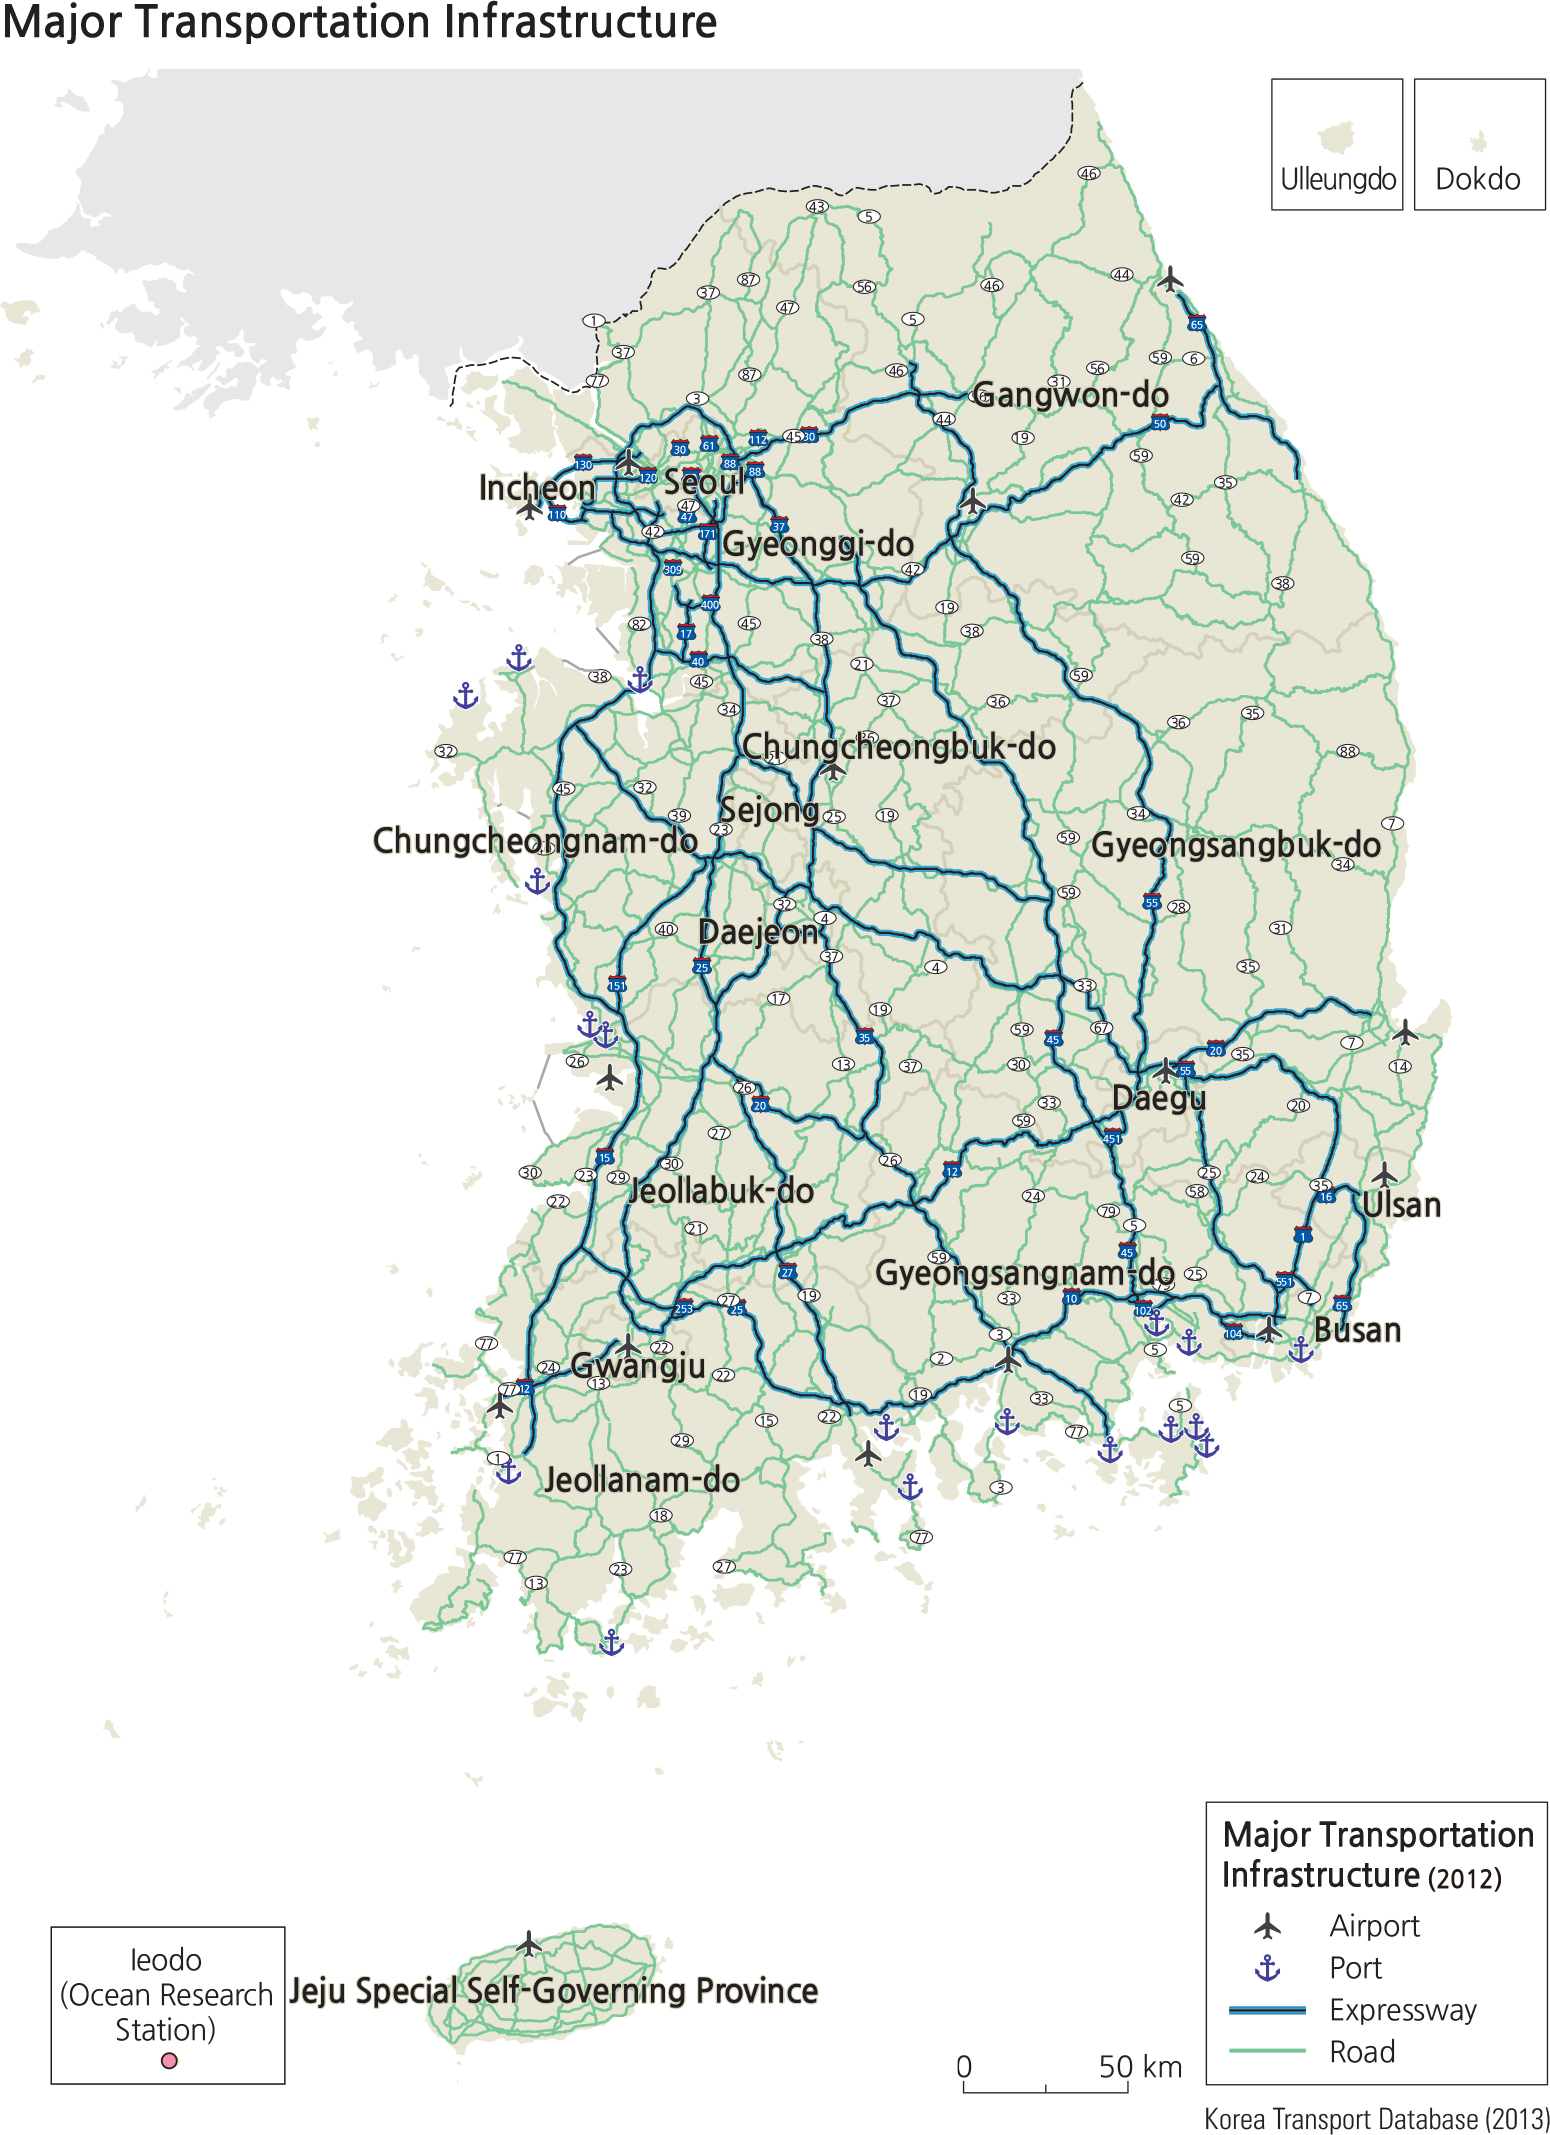
One of the most important facilities that enable a nation to grow is the transportation infrastructure. It allows for the movement of people, goods, raw materials, food, and other necessary supplies. Roads, railways, airports, and ports are all essential facilities in the process of building a nation.
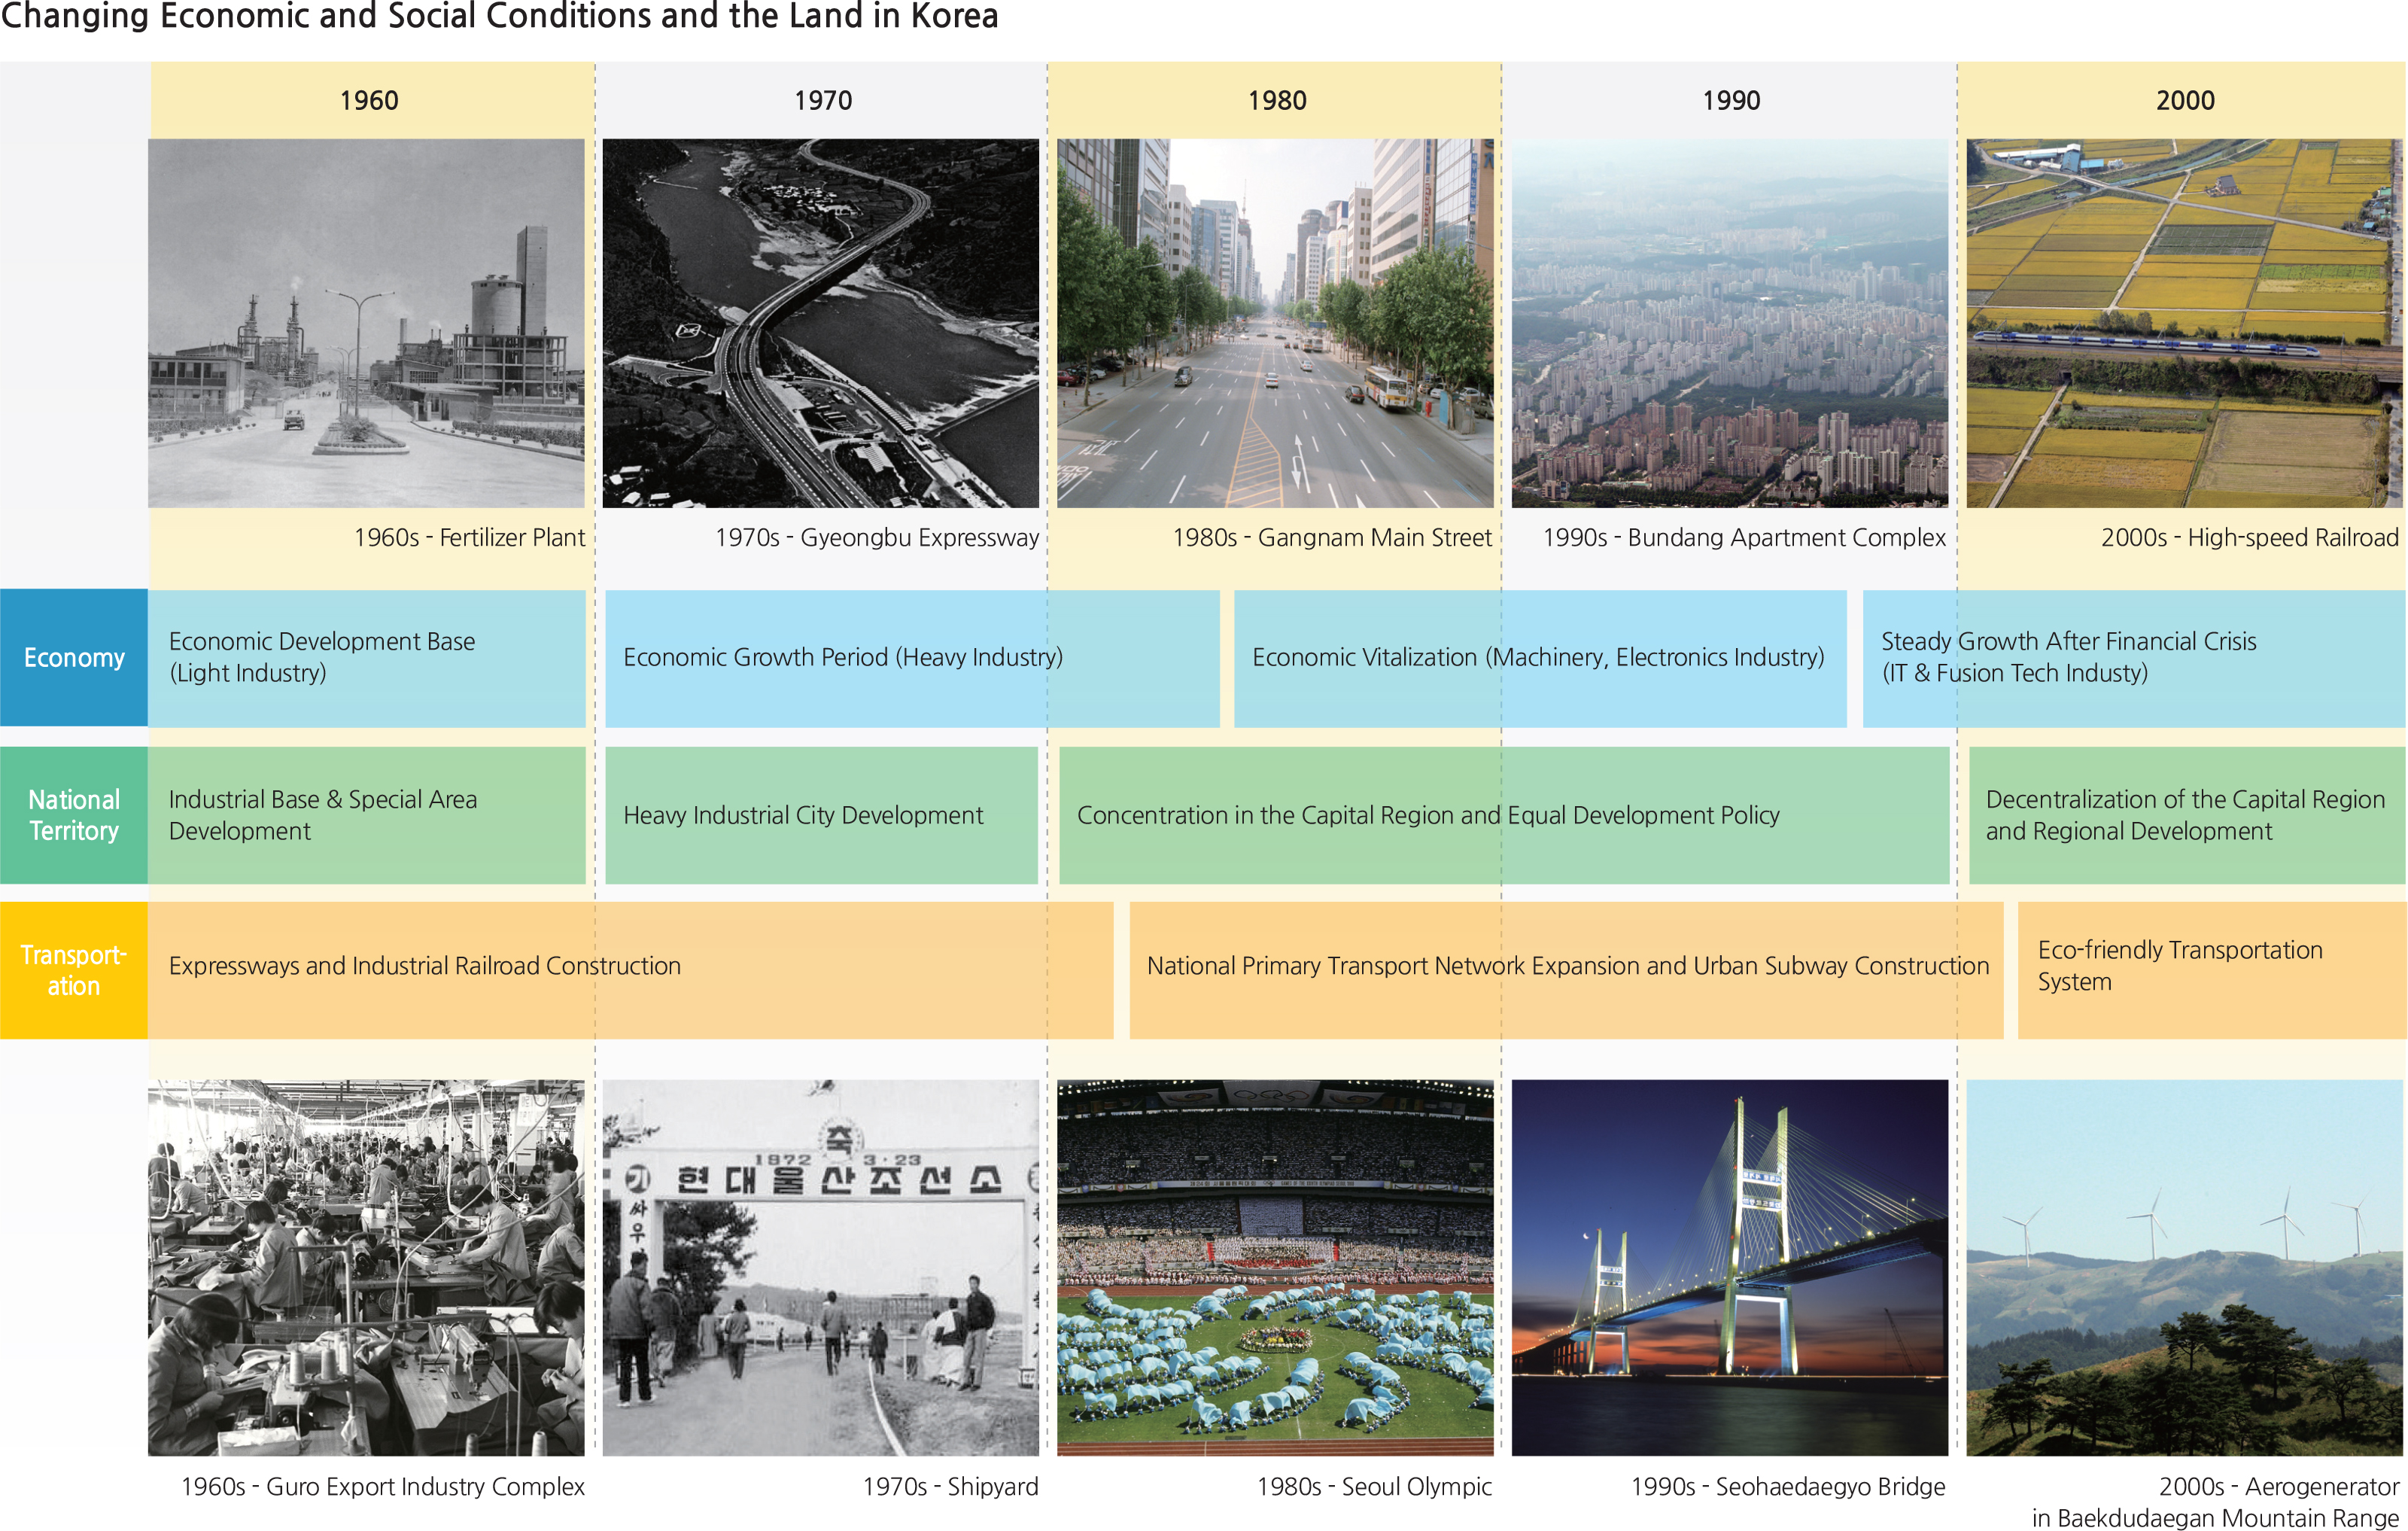
Since the 1960s, construction of transportation infrastructure took place rapidly. Major national networks such as expressways, railways, airports, and seaports were built and served as the backbone for continued transportation expansion. Numerous important industries were developed along the Gyeongbu Axis, and in order to service those industries a main transportation network was established to connect Seoul with Busan. With the opening of the Gyeongbu Expressway in 1970, the entire nation became more accessible to commuters, making it possible for travelers to move point-to-point in the country within one day (“One-Day Life Zone”). With the opening of the Gyeongbu High Speed Railway in 2004, it became even more so. Literally, a “Half-Day Life Zone" became available.
The cargo capacity at Korean ports has been increasing steadily. Total capacity increased from 82 million tons in 1980 to more than one billion tons in 2013. Busan and Gwangyang are the ports that process the largest amount of cargo in Korea, processing 27% and 20%, respectively. The number of vessel passengers also has increased steadily. It was 8.2 million in 1990, and doubled to 16.1 million by 2013. Categorizing vessel passengers into visitors and island residents, the number of trips by island residents decreased, while trips by visitors have greatly increased. The Mokpo port accounts for the largest portion of passenger travel (39.2%), followed by the Masan port (14.0%) and the Yeosu port (13.3%). As of 2013, there were 55 ports: 14 national ports, 17 local ports, and 24 domestic ports.
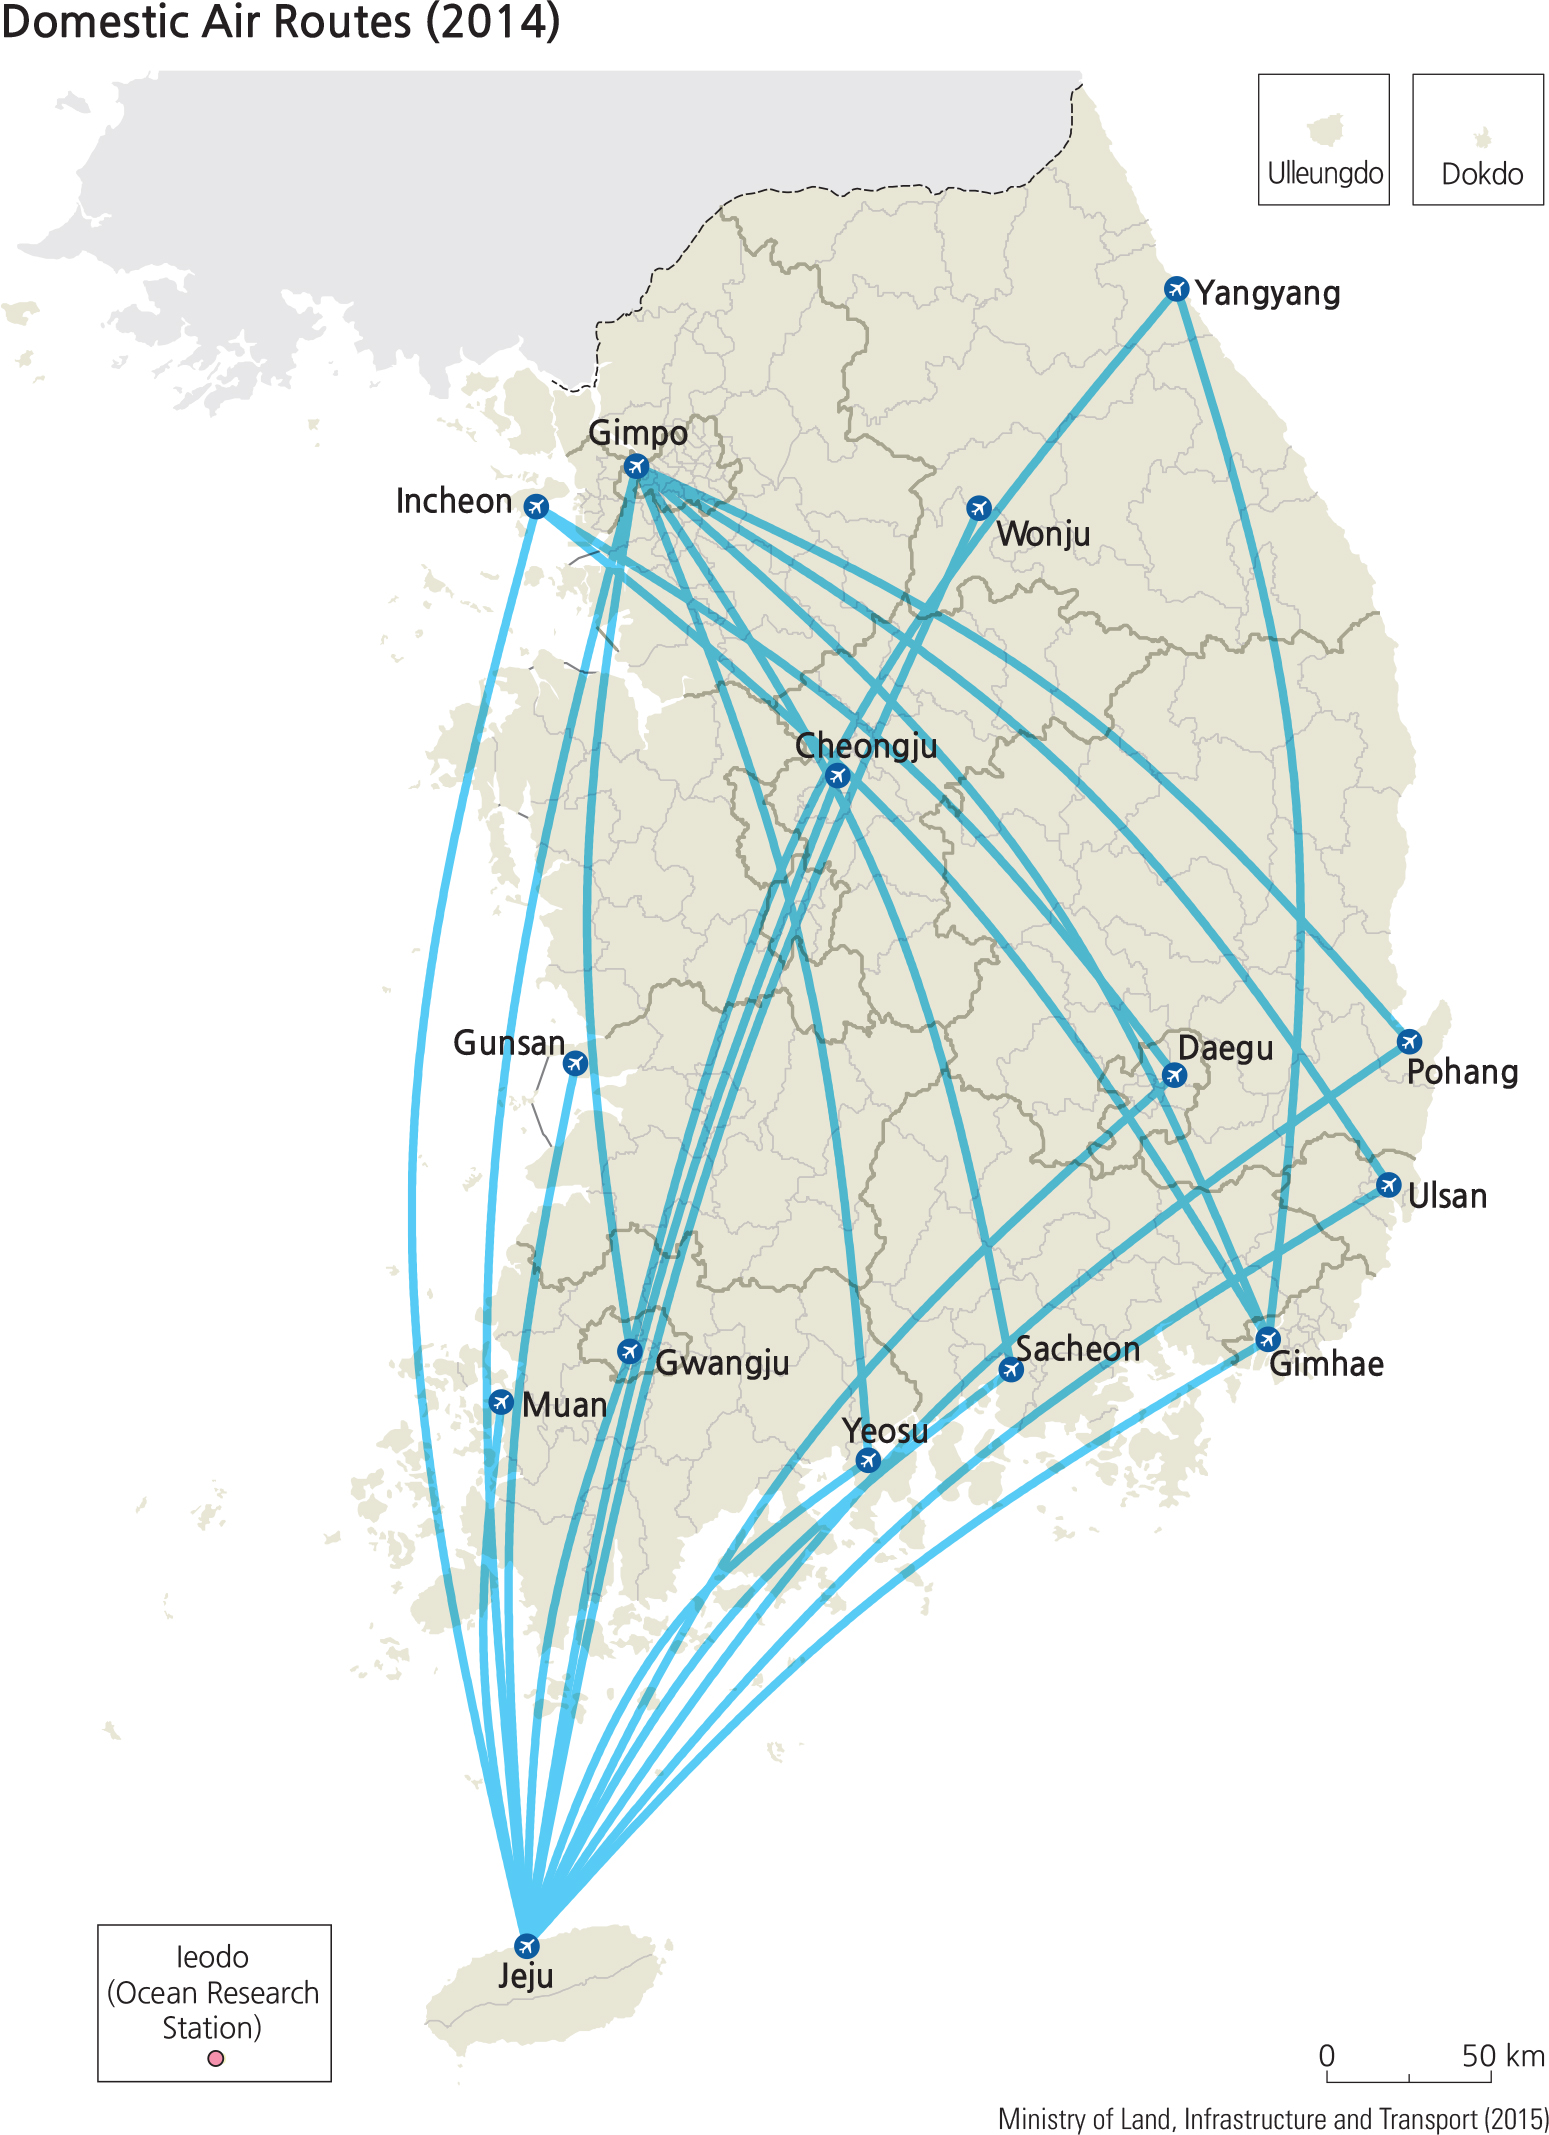
Korean airport capacity was 73 million passengers and 2.9 million cargo tons in 1999. It increased to 152 million passengers and 6.8 million cargo tons by 2014. The growth of airport capacity is in line with the global increase in air travel during the period. Comparing domestic and international travel, domestic travel shows little change during the mid-1990s, followed by a slight increase after 2010. On the other hand, international travel steadily increased after the 1990s, with some inflection points during specific periods. A total of 77 airlines operated in Korea during 2013 (7 domestic airlines and 70 foreign airlines), serving the destinations of 152 international cities in 51 countries. The most frequent international destination is Southeast Asia (33.1%), followed by Japan (24.2%) and China (22.6%). Domestically, the Gimpo (Seoul)-Jeju route has been the most popular, accounting for 53.9% of domestic trips.
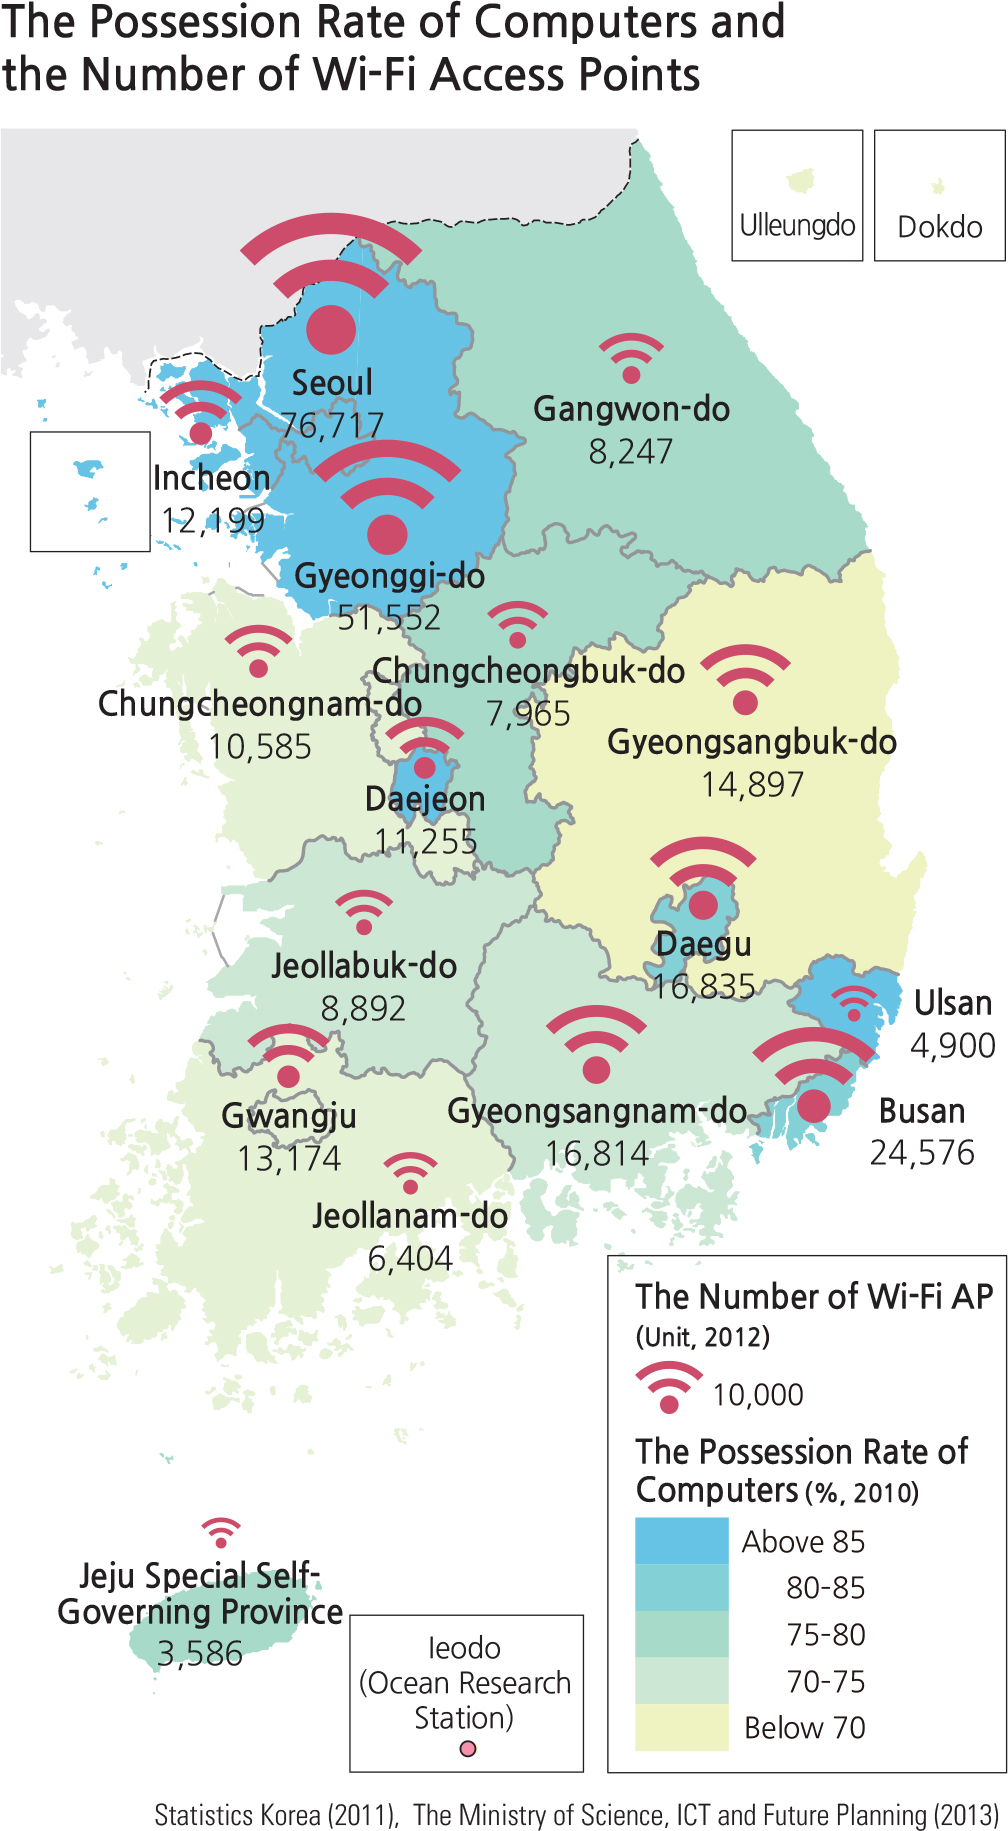
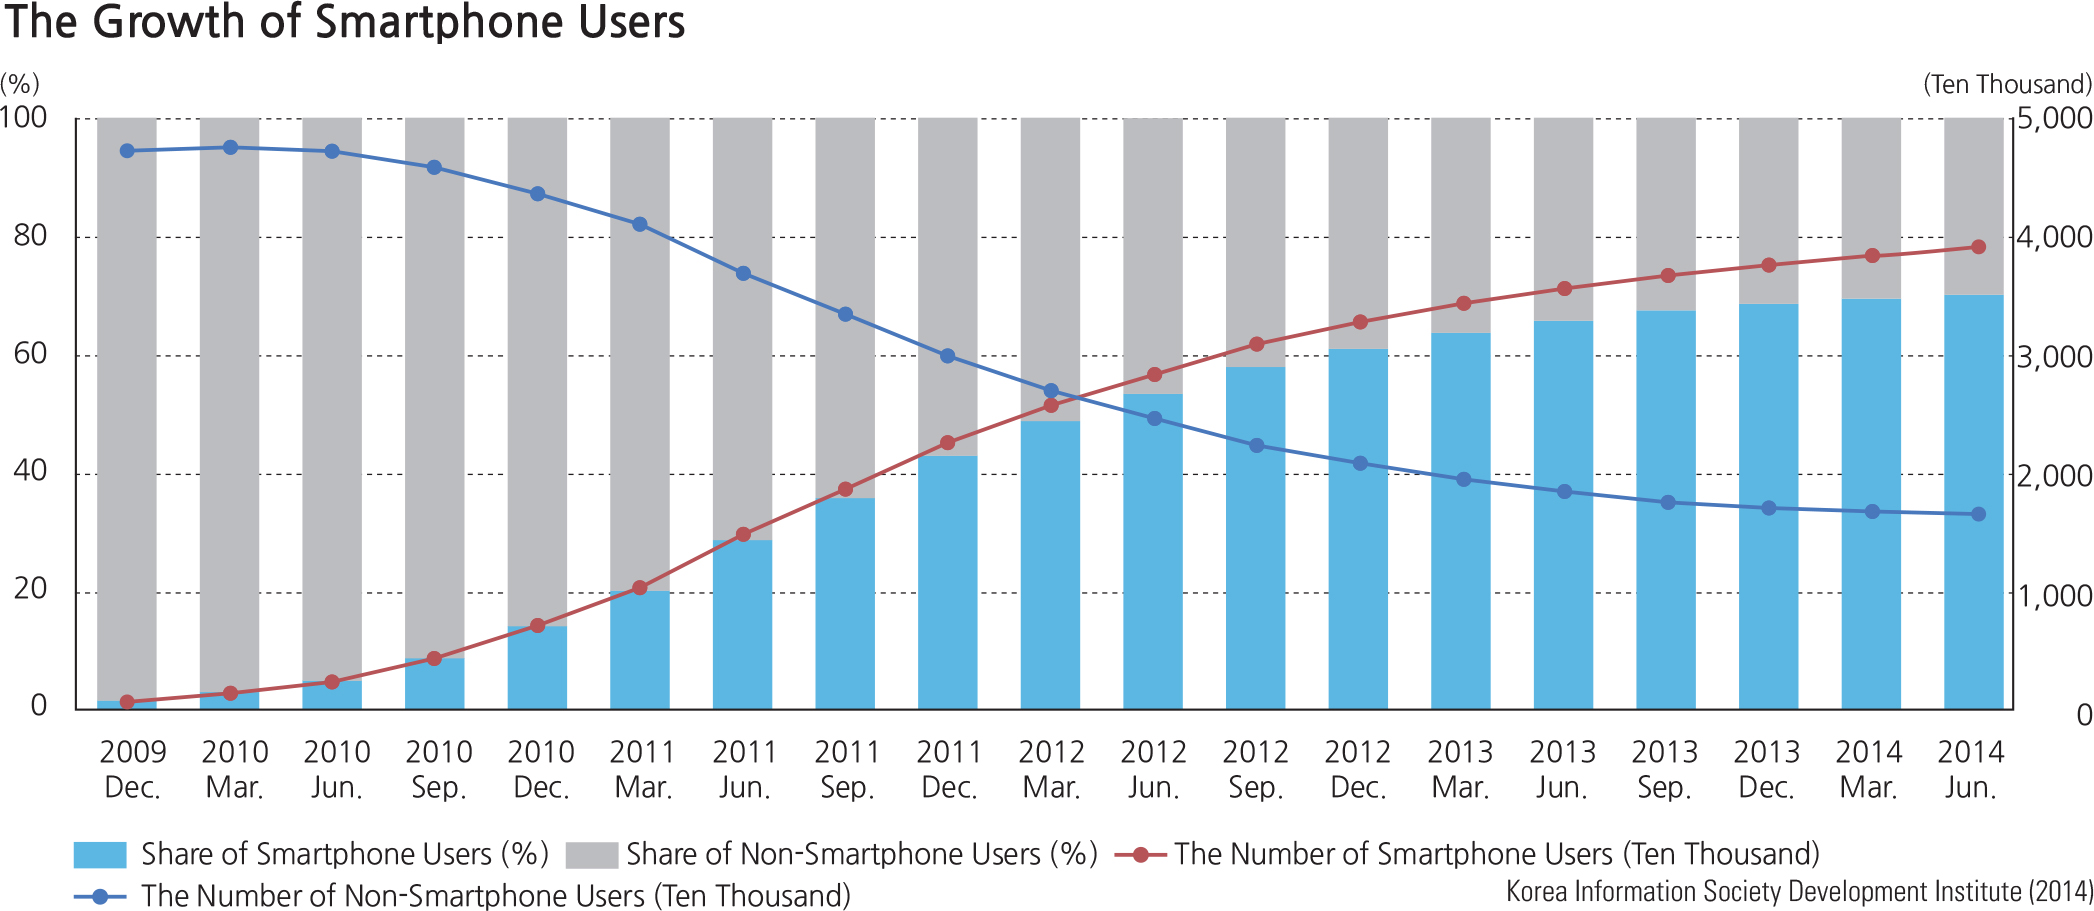
As computers became more widely used, communication through diverse digital devices continued to grow. The development of the Internet, in particular, has made a massive amount of information accessible to people using computers, cell phones, and tablets. Unlike in the past, the bilateral exchange of information is taking place in a diverse and complex manner. The local telephone companies, which were the most important communication providers in the past, have been steadily losing subscribers dropping by 20% between 2004 and 2012. Simultaneously, the number of mobile phone subscribers has continued to increase by as much as 46% during the same time frame. Among mobile phone subscribers the use of smart phones has soared. Since 2012, the number of smart phone users has exceeded that of regular mobile phone users, and the customer market share of smart phone providers has exceeded 50%. As of 2011, 78% of the South Korean population has access to the Internet and 65.2% uses wireless Internet. The number of wireless Internet users has also dramatically increased due to the widening distribution of smart phones.
Brief Interpretation of the Maps
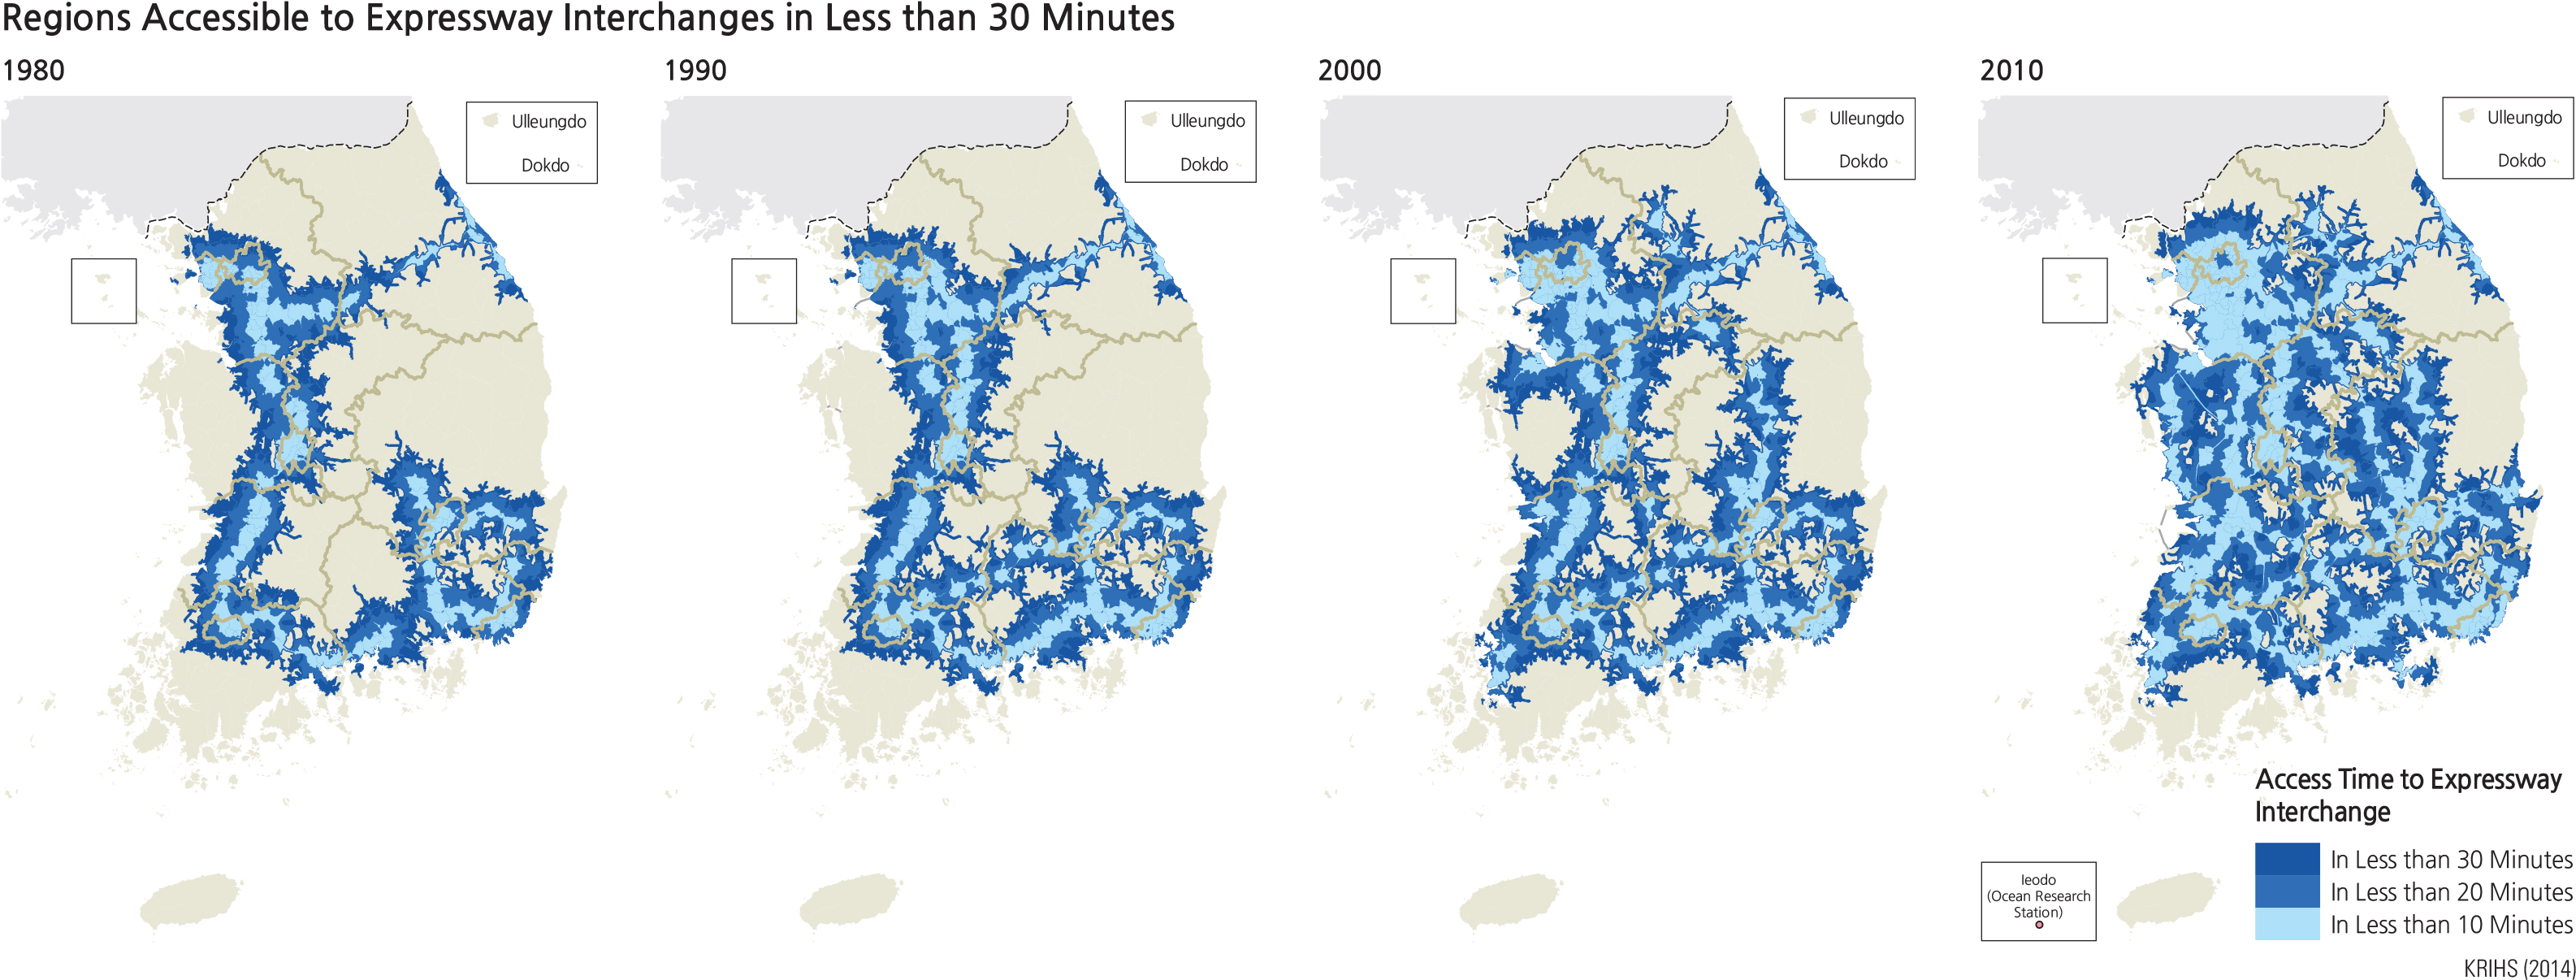
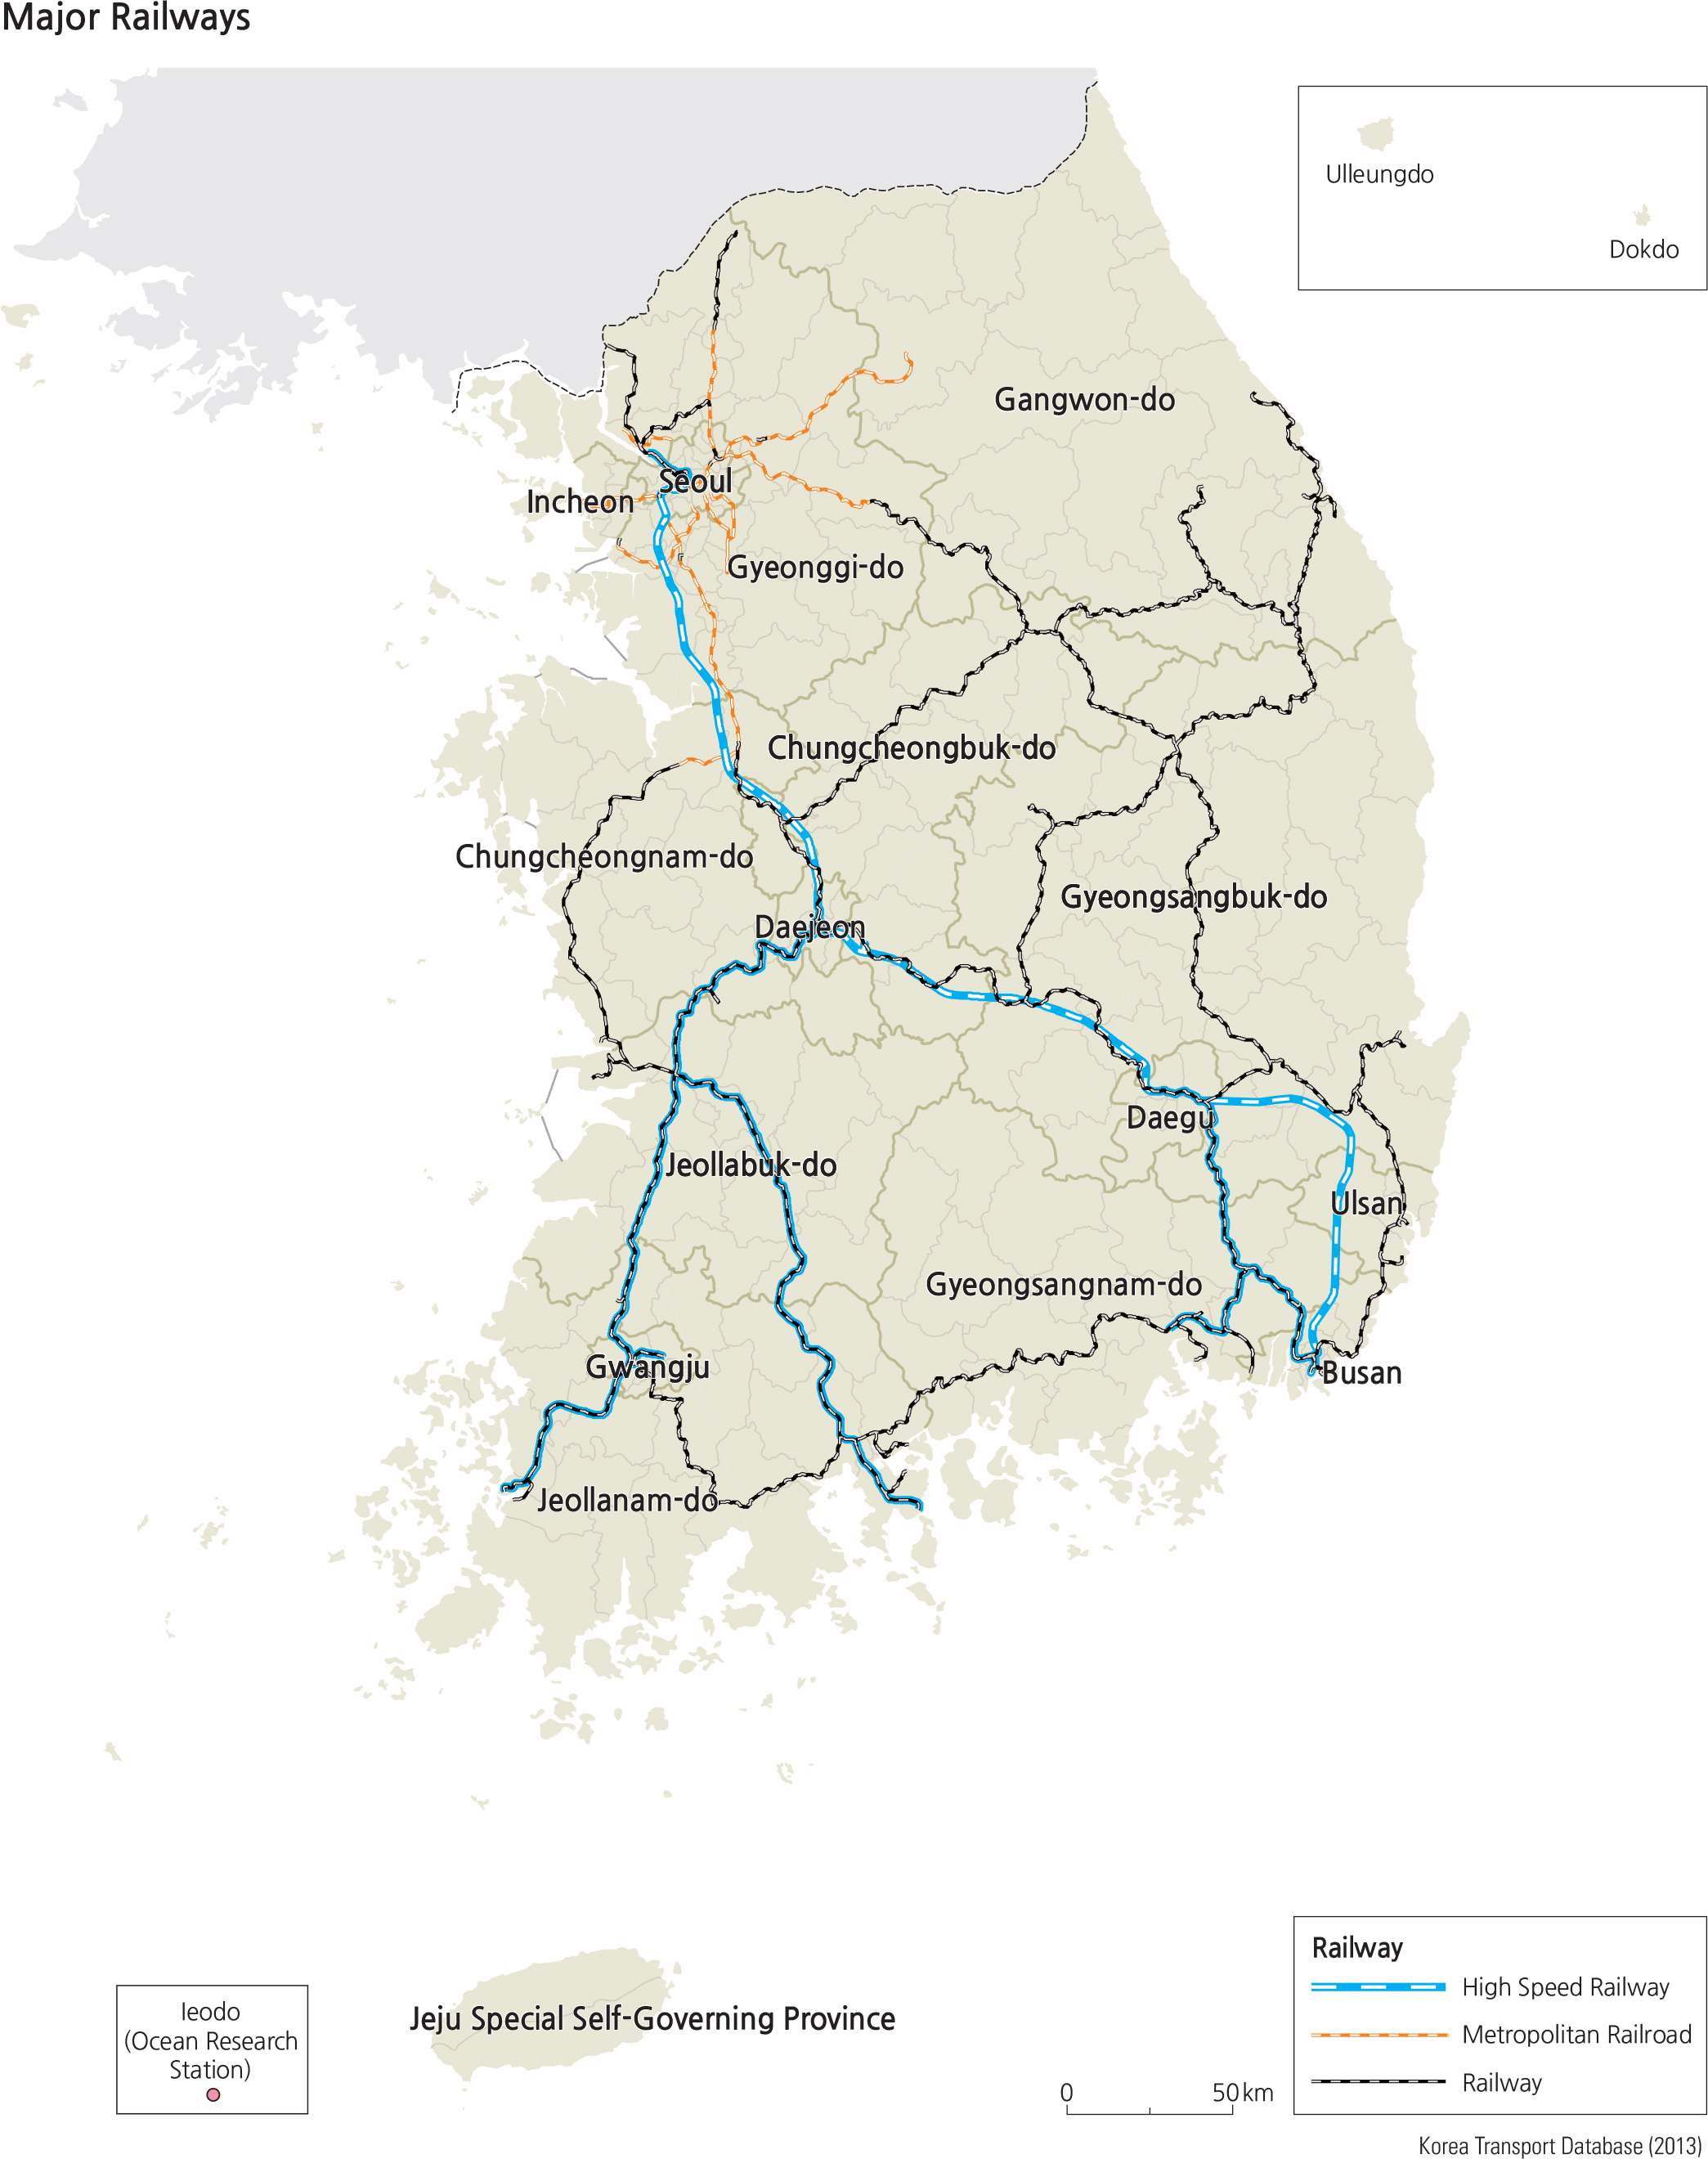
The Infrastructure Map depicts the location of all the airports, ports, expressways, and major roads. It is a complex pattern that blankets the entire country. Consistent with other maps that show development, the north and northeast coastal regions have much less infrastructure, mostly due to topography and the proximity to North Korea. The air traffic map clearly illustrates the northsouth trend with no east-west air travel, perhaps because it may be more feasible to drive the east-west span. The four maps display a time-series spatial arrangement of the time it takes to reach any expressway entrance. This map series is a testimonial to the rapid improvement of the efficiency of expressway traffic, and to the coverage of the nation that is serviced by expressways. It also grows parallel to the Korean automotive industry, giving citizens greater freedom of travel on the road. The railroad map identifies the highspeed rail connections between Seoul, Busan, Gwangju, and major cities along these lines. Other railroads also blanket the nation, even to parts of the northeast coast. Perhaps the most intriguing graphics are the distribution and volume map of Wi-Fi usage and the graphs on the number of Internet and smart phone users. The great success of Korean high tech manufacturing and communication industries has enabled the Korean citizens to become global citizens who are cognizant of global events. Given the current pattern of the transportation system, do you feel that Korea has achieved the national transportation goals? Justify your answers. Is there still room for improvement? Make suggestions for improvement and where these changes should be implemented.
Urbanization
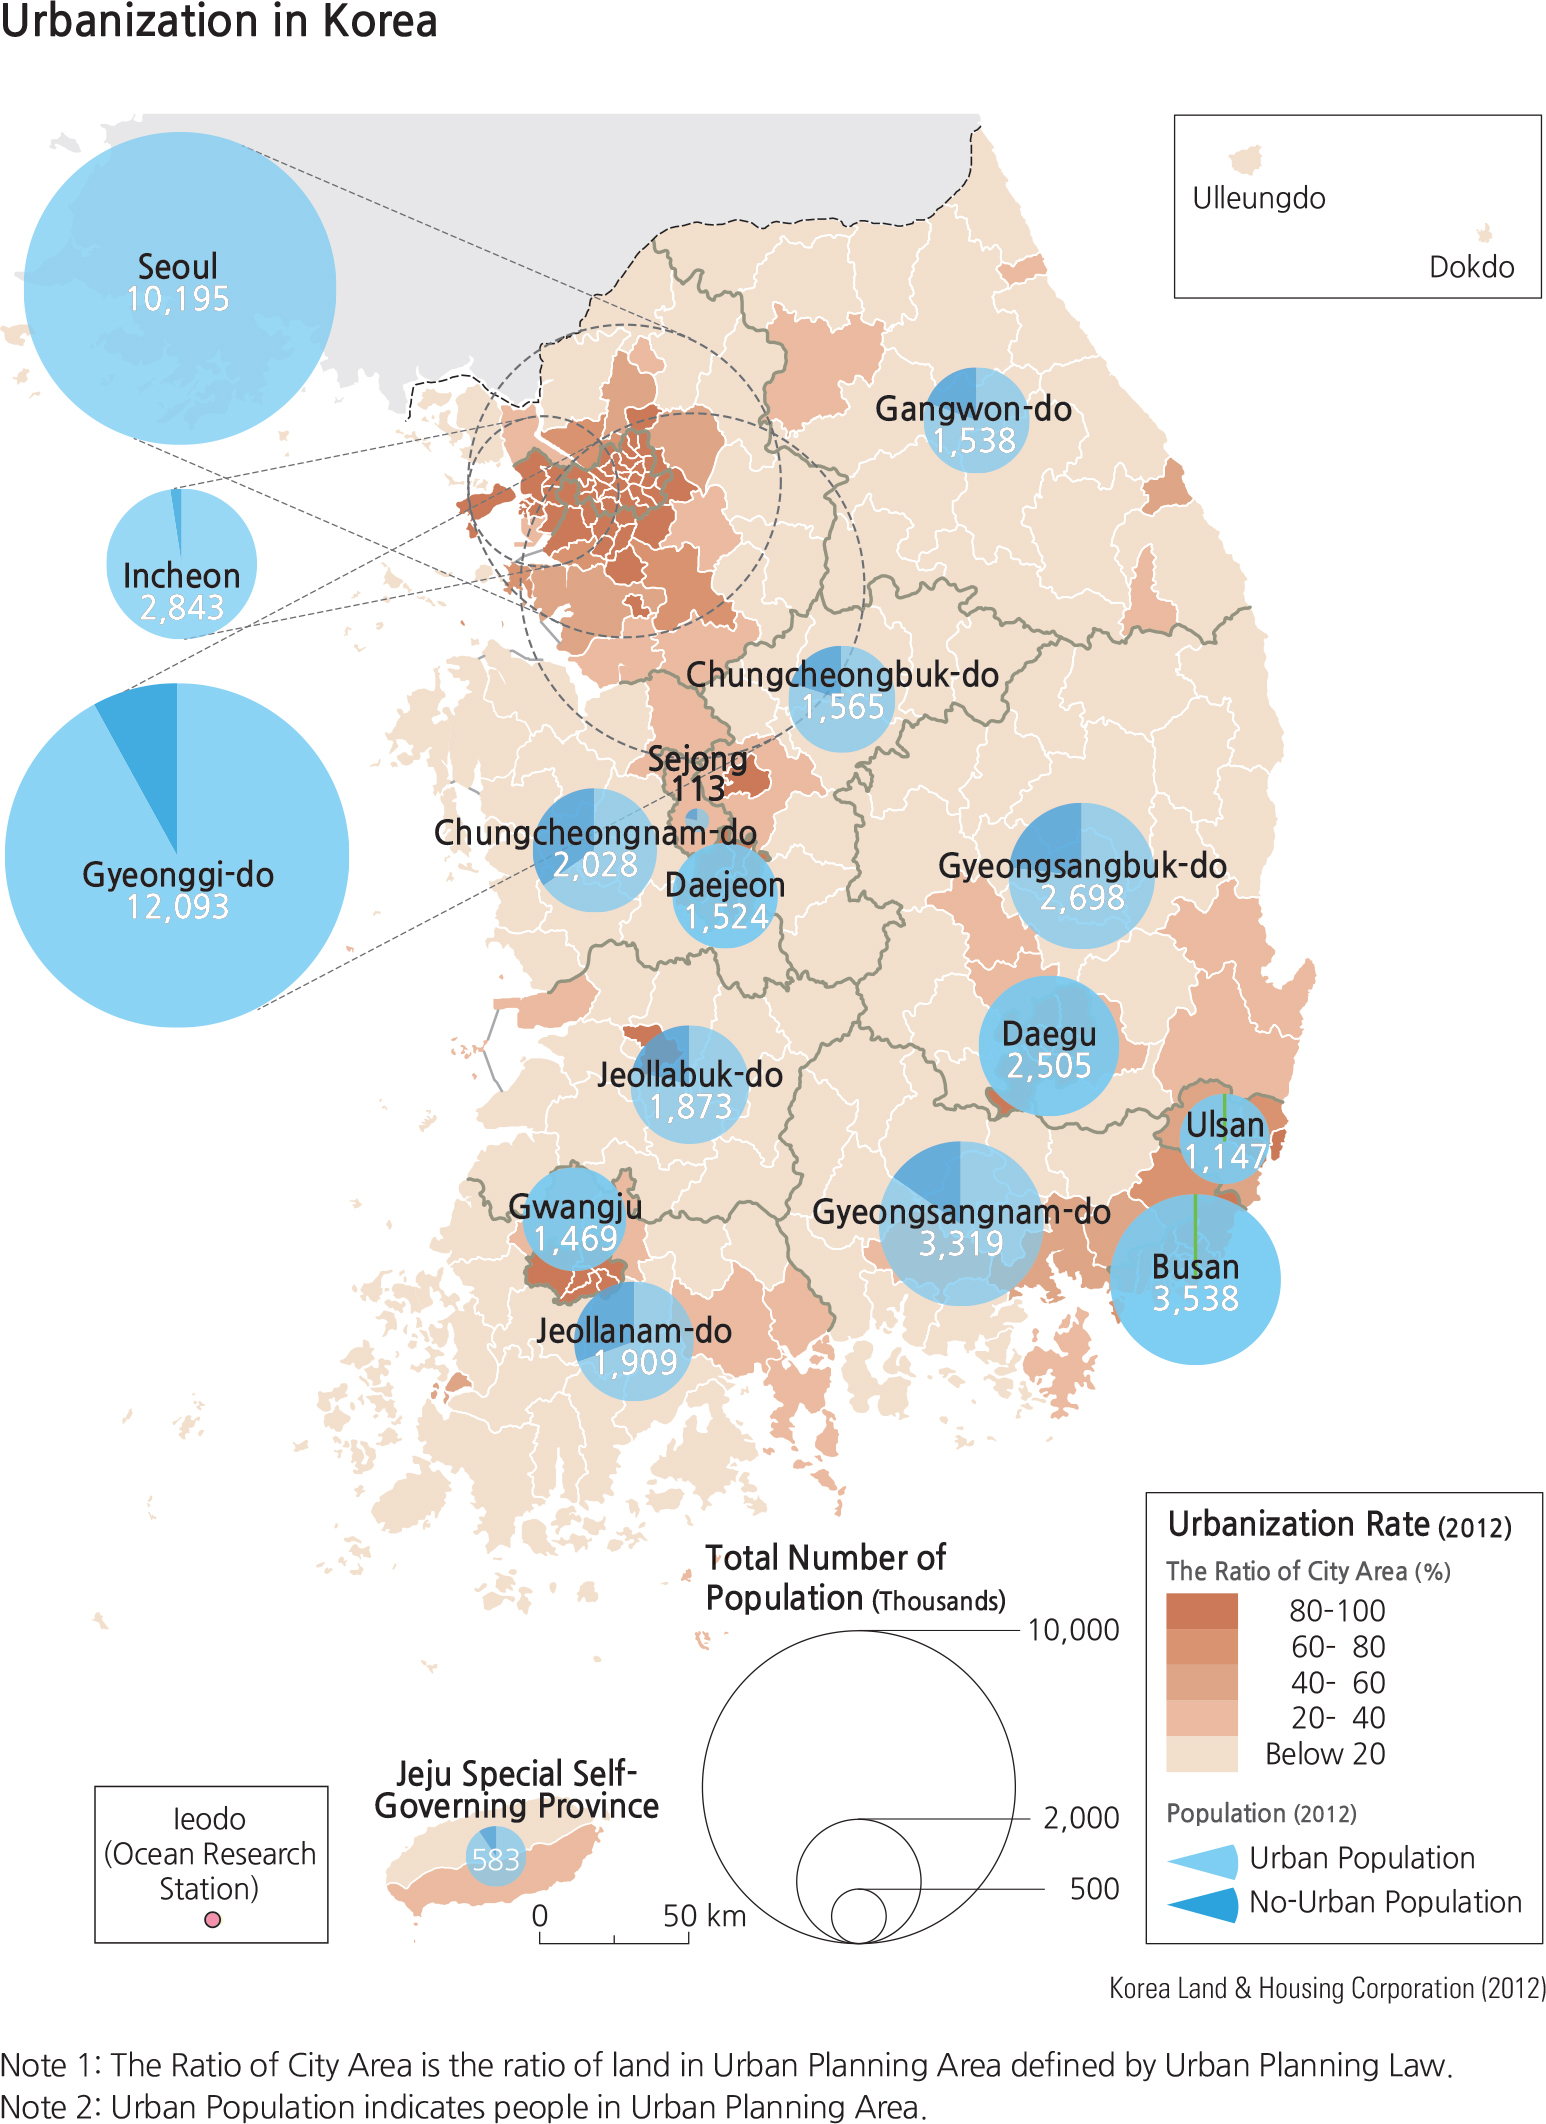
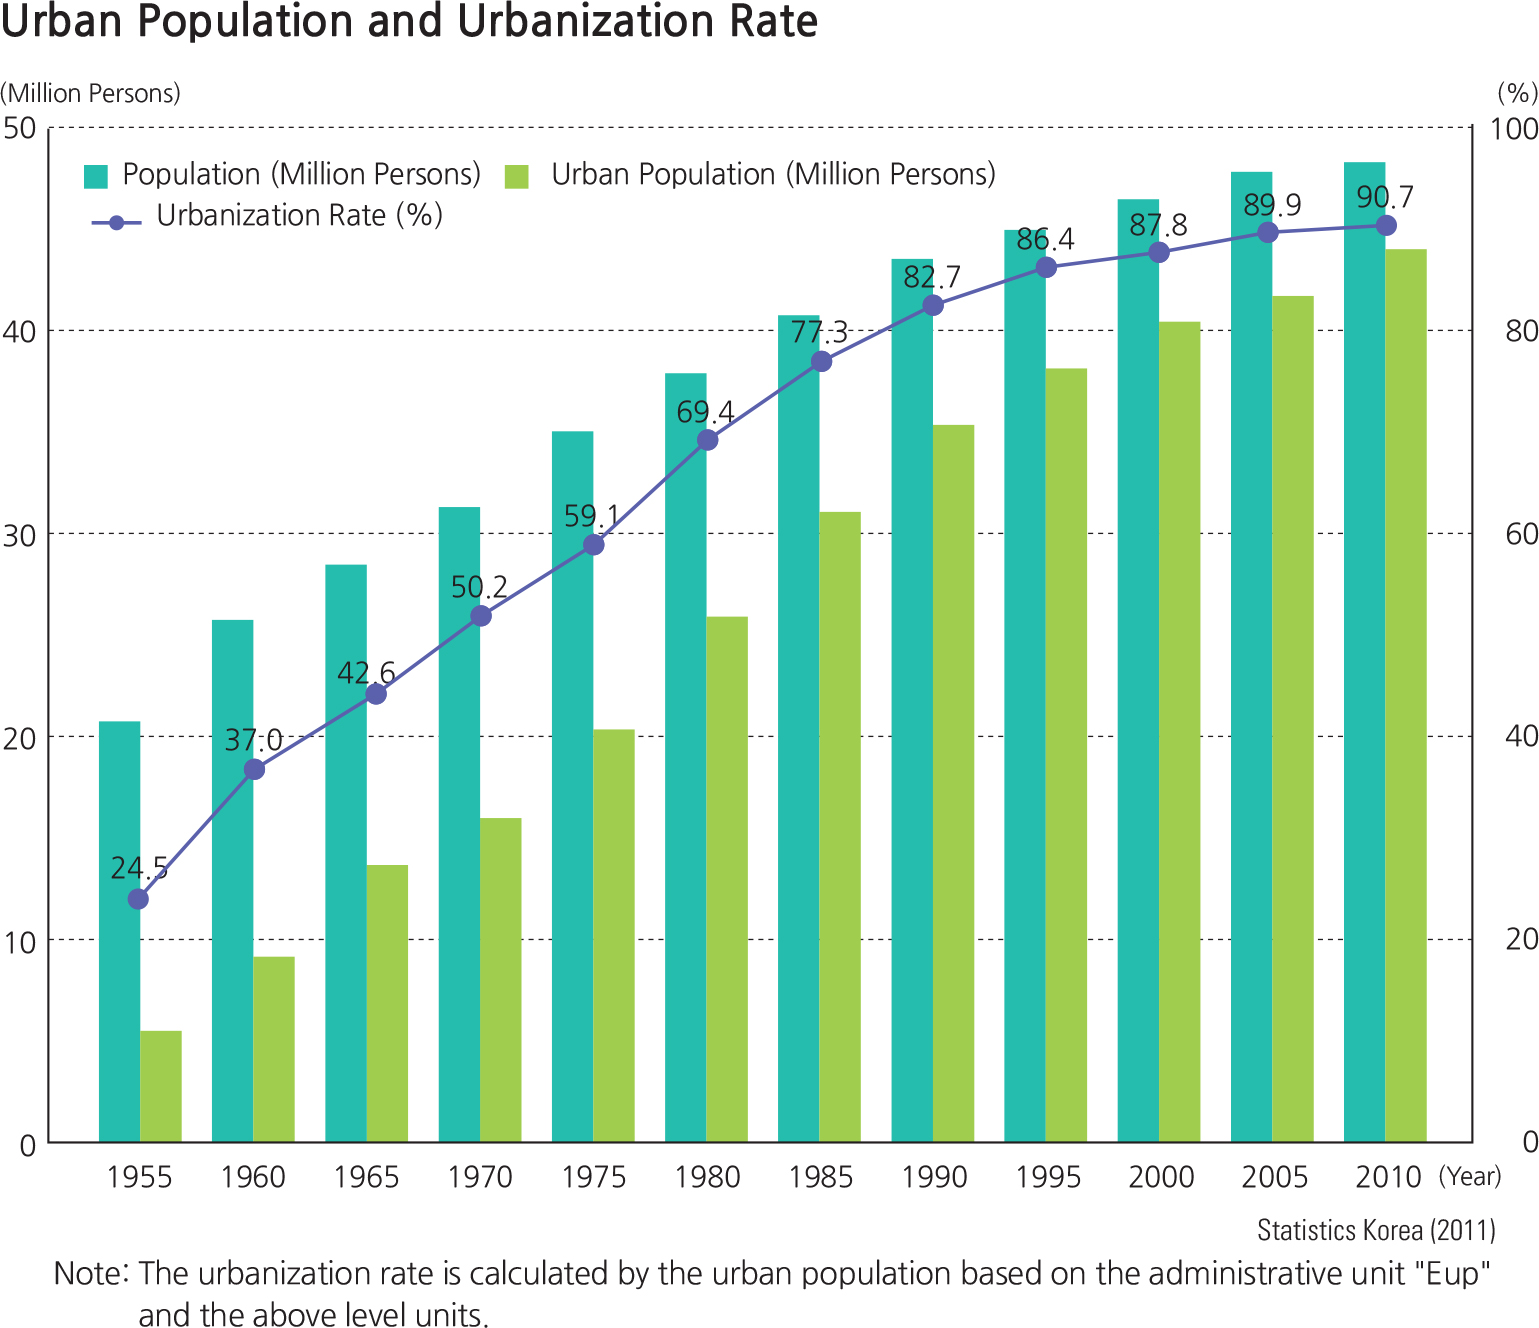
The most notable change in –the Korean landscape over the past 60 years is increasing urbanization. The representative indicator of this process is the urbanization rate that shows the share of people living in urban areas out of the total national population. This statistical number can differ depending on which administrative level unit, the Dong level or the Eup level, is used to designate an area as urban or rural. According to the Eup level, the Korean urbanization rate has exceeded 90%. The rate of increase was rapid until the 1980s, but it has since slowed down. This slowing trend indicates that Korean urbanization has entered a final phase from the earlier acceleration phase. The Seoul-Busan region and the immediate surrounding area as well as other metropolitan cities, all exhibit high urbanization rates.
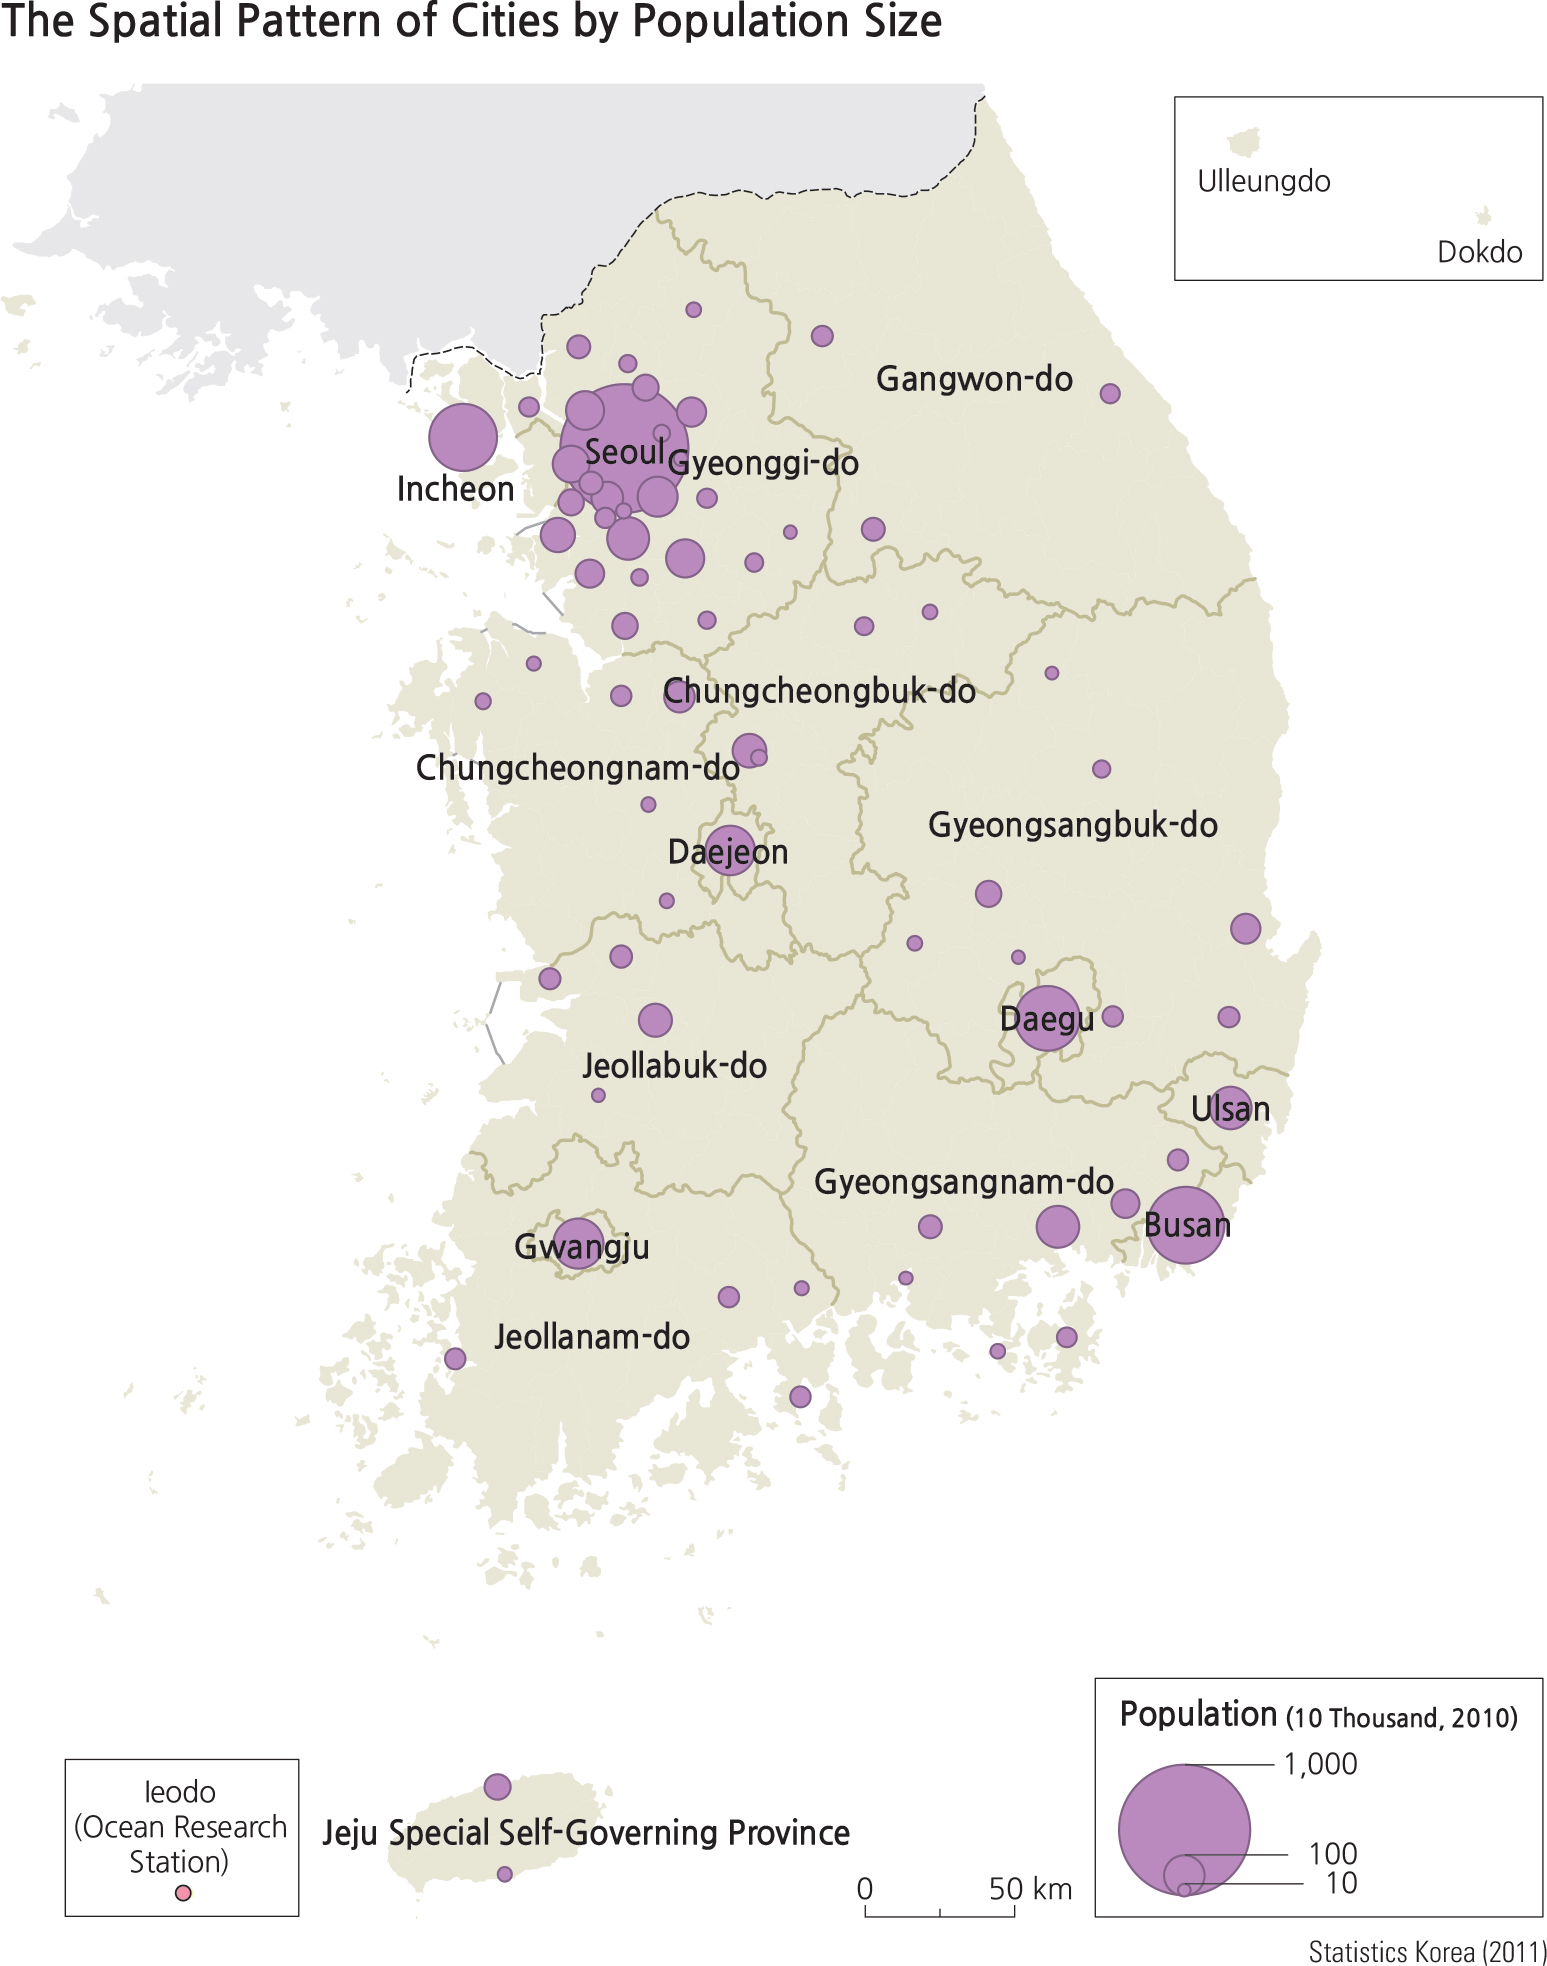
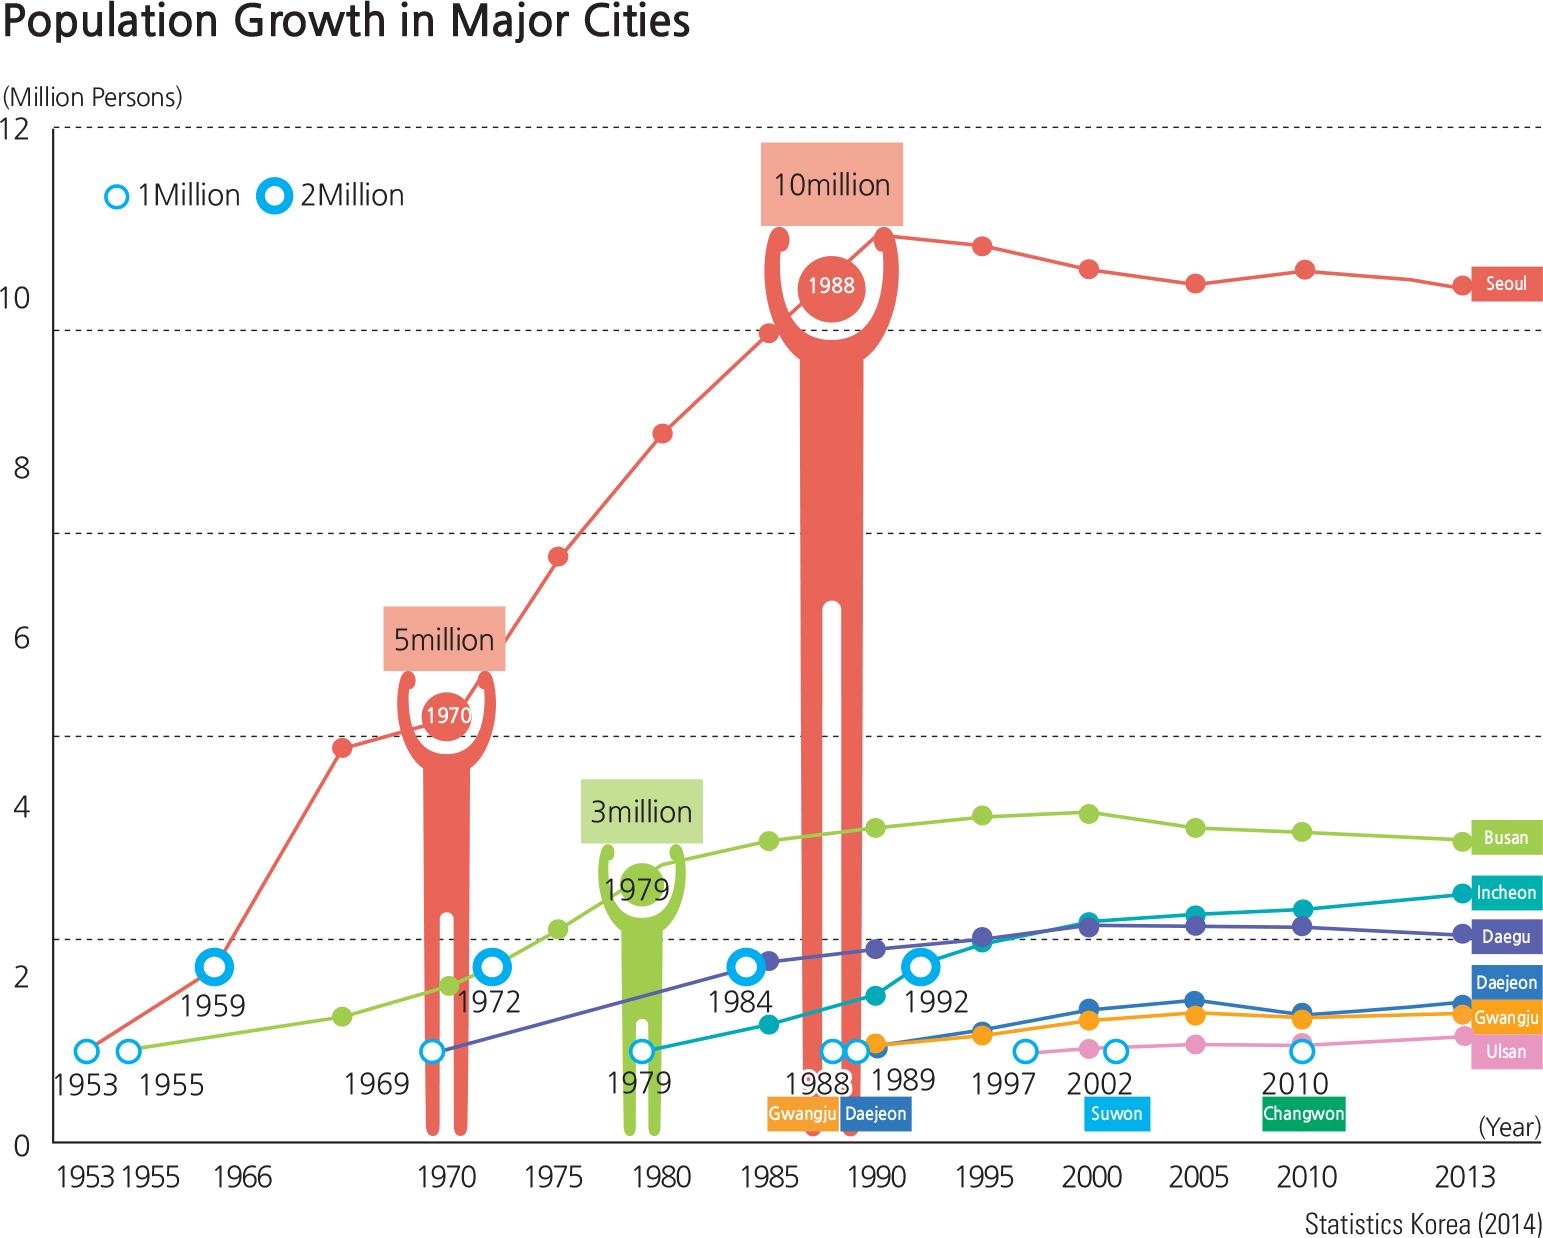
The list indicating urban growth in Korea when each city reached 1 million residents is shown here in chronological order: Seoul (1953), Busan (1955), Daegu (1969), Incheon (1979), Gwangju (1988), Daejeon (1989), and Ulsan (1997). Among cites that did not meet the metropolitan definition, Suwon exceeded 1 million in 2002 and Changwon in 2010; Goyang and Seongnam are likely to follow. Seoul exceeded 10 million in 1988 and became a megacity even by international standards. Busan, the second largest city, exceeded 3 million in 1979; however, the population stagnated and has decreased in the mid-2010s. The distribution of cities by population size depicts a clear trend of port city development along the southeastern coastal industrial zone as well as the expansion of the greater capital area. These two urban centers in particular prompted the construction of the Gyeongbu Axis or transportation linkage.
The advent of a population increase led to urbanization, both in terms of the increase in the overall number of cities as well as expansions of the cities. In addition, as urban residents moved into the suburbs, urbanization expanded into nearby regions forming greater metropolitan areas. As cities expand, so does the demand for housing and transportation infrastructure; there is likewise a concordant increase in the number of people commuting to and from work or school in the city centers. In the case of the Seoul metropolitan area, the number of commuters from Incheon and Gyeonggi-do to Seoul was 239,000 in 1980; this number increased to 669,000 in 1990, to 1,072,000 in 2000, and to 1,423,000 in 2010. The number of people who commute from Seoul to the suburbs has also increased from 152,000, to 336,000, to 527,000, and to 572,000 during the same decades, respectively. The number of commuters within Seoul has increased significantly as well as that of commuters between the city and the province. In 1980, as many as 3,109,000 people commuted to work or school within Seoul, but that number gradually increased from 4,680,000 in 1990 to 5,257,000 by 2010. The number of people commuting to work or school within Incheon increased from 343,000 in 1980 to 644,000 by 1990, to 983,000 by 2000, and to 1,237,000 by 2010. In particular, the number of people commuting to work or school within Gyeonggi-do increased considerably from 937,000 in 1980 to 1,768,000 by 1990, to 3,441,000 by 2000, and to 5,111,000 by 2010. City buses provided the primary mode of transportation for almost 50% of those people commuting to work or school in 1980, but the percentage of people using the city bus system decreased to less than 20% of the total commuters by 2010 because the means for commuting has become increasingly diversified due to the construction of subway systems and increases in the use of personal transportation. In 2010, approximately 18% of commuters in Seoul relied on the subway systems for their daily travel.
Brief Interpretation of the Maps
Both the urbanization rate map and the spatial pattern of cities map exhibit similar patterns that begin with the linkage of Seoul to Daejeon. The linkage then split into two, one to the southwest to connect to Gwangju and the other to the southeast to connect to Daegu and Busan and other southwestern cities that are industrial centers. These cities attract population because of job opportunities.
The four maps that show commuter traffic in the greater capital area are time sequence maps between 1980 and 2010. The two maps on the left display the increase and changing pattern of commuters between Seoul and the immediate surroundings. The very obvious change is the volume of commuters that have increased over the three decades. Another observable change is the direction of the commuters; by 2010, there was a significant amount of commuters coming into Seoul from the northeast, which did not occur in 1980.
The two maps on the right illustrate the changing patterns of intra-urban commuters in Greater Seoul. From these maps, the volume of intra-urban commuters appears to have declined; however, the origins and destinations have changed. In 1980 commuter origins and destinations centered on Jung-gu whereas in 2010 they shifted to Gangnam-gu. This is a very significant change in the intraurban commuter spatial pattern.
Referring to the two maps on the right from the Growth of Commuter in the Capital Region maps, what kind of questions can you raise as to why there is a significant change that attracted commuters to go to Gangnam-gu? Is it because of better housing, or jobs, or even entertainment, as Gangnam-gu has a lot of attractions?
Urban Revitalization and New Towns
Since the beginning of rebuilding Korean urban structures in the 1960s, many areas in the inner cities have become old and inadequate for population demands of the 21st century. In order to cope with the physical, social, and economic deterioration of the inner-city, the central government announced the national urban regeneration policy guidelines in 2013. The target areas were selected by three specific indices: decrease in population, decline of industry, and deterioration of housing and overall community condition. Based on these criteria the government has designated 13 regions that are a high priority for development according to urban regeneration policies. Those priority regions have been categorized into one of two types: economic revitalization or community restoration. Since 2013, the projects have been financed by the urban regeneration fund with the expectation that individual pilot projects will result in positive ripple effects throughout the region.
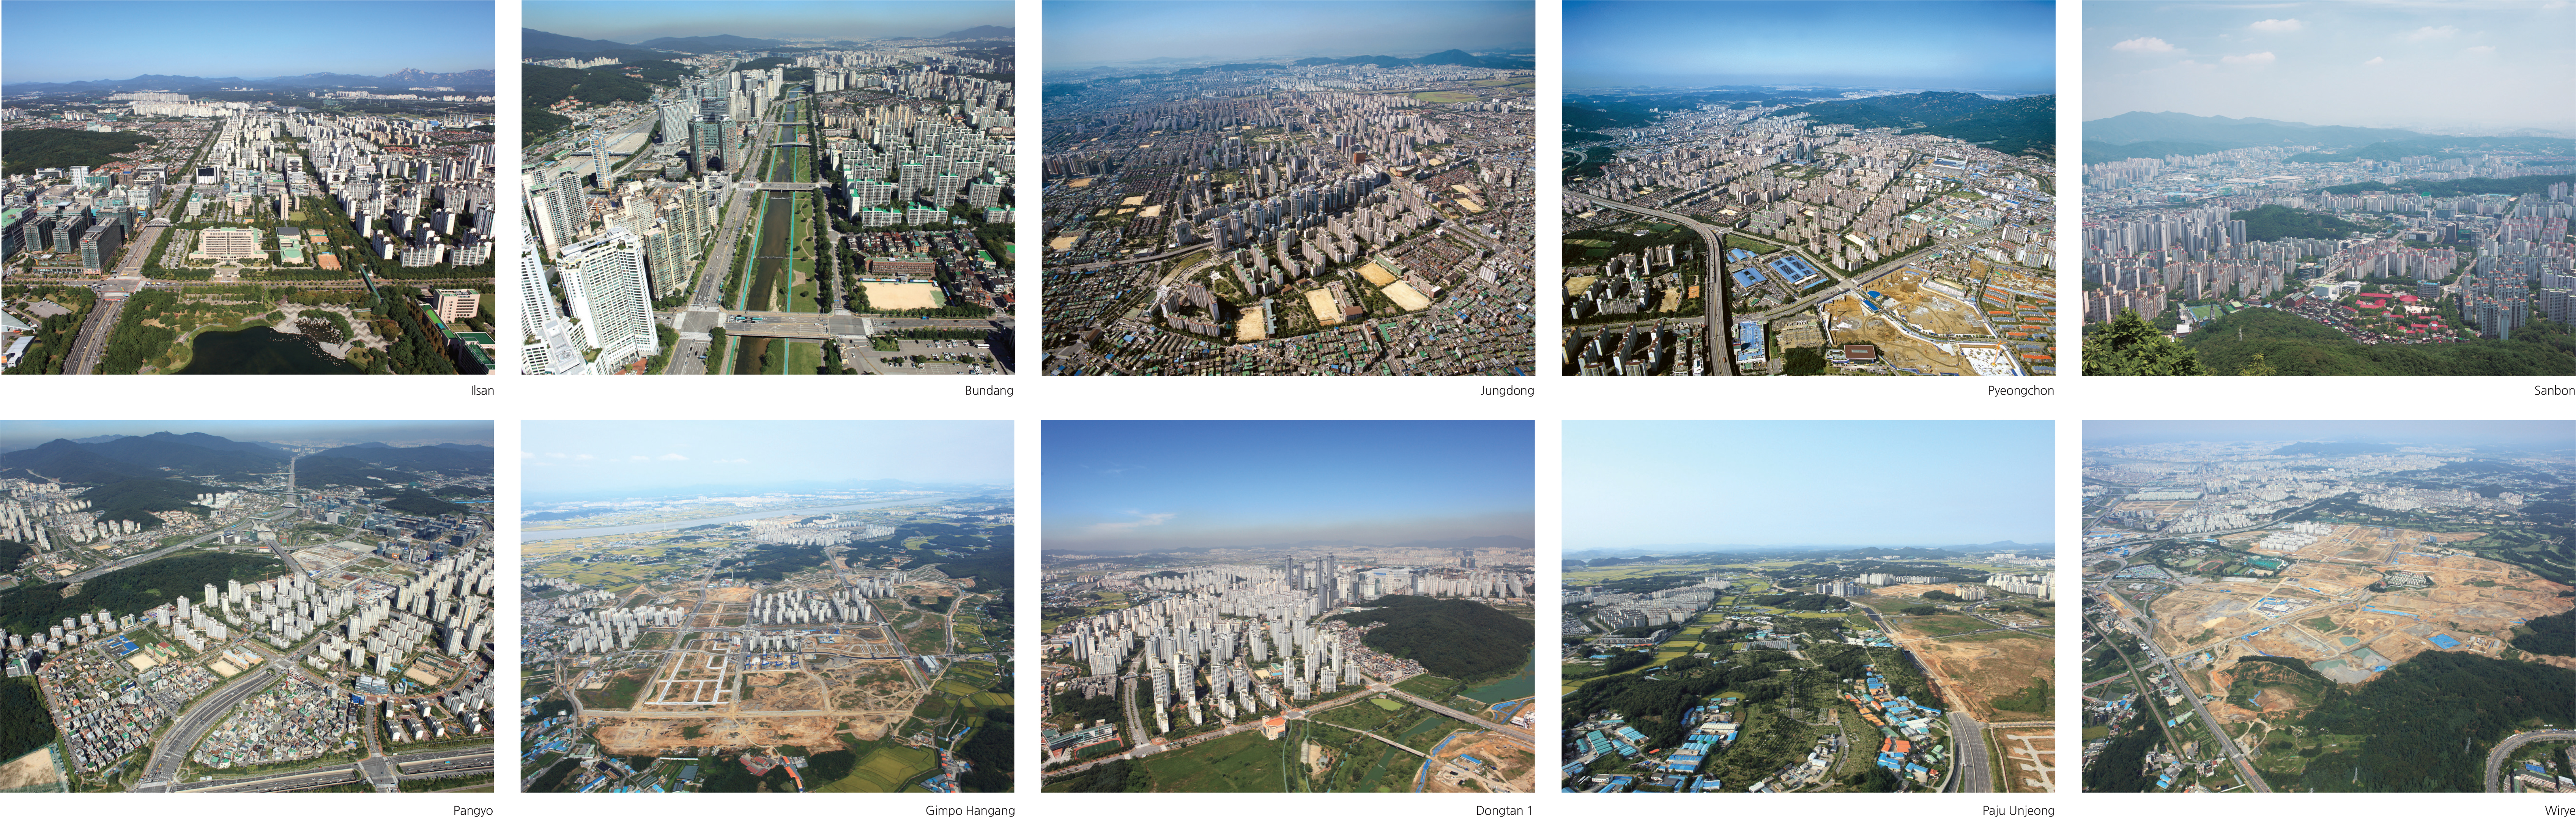
The construction of new, entirely modern towns in Korea began in earnest after the 1960s. This new town policy was centered upon two goals: first, the development of the national territory and all regions of South Korea, second, the resolution of urban problems.
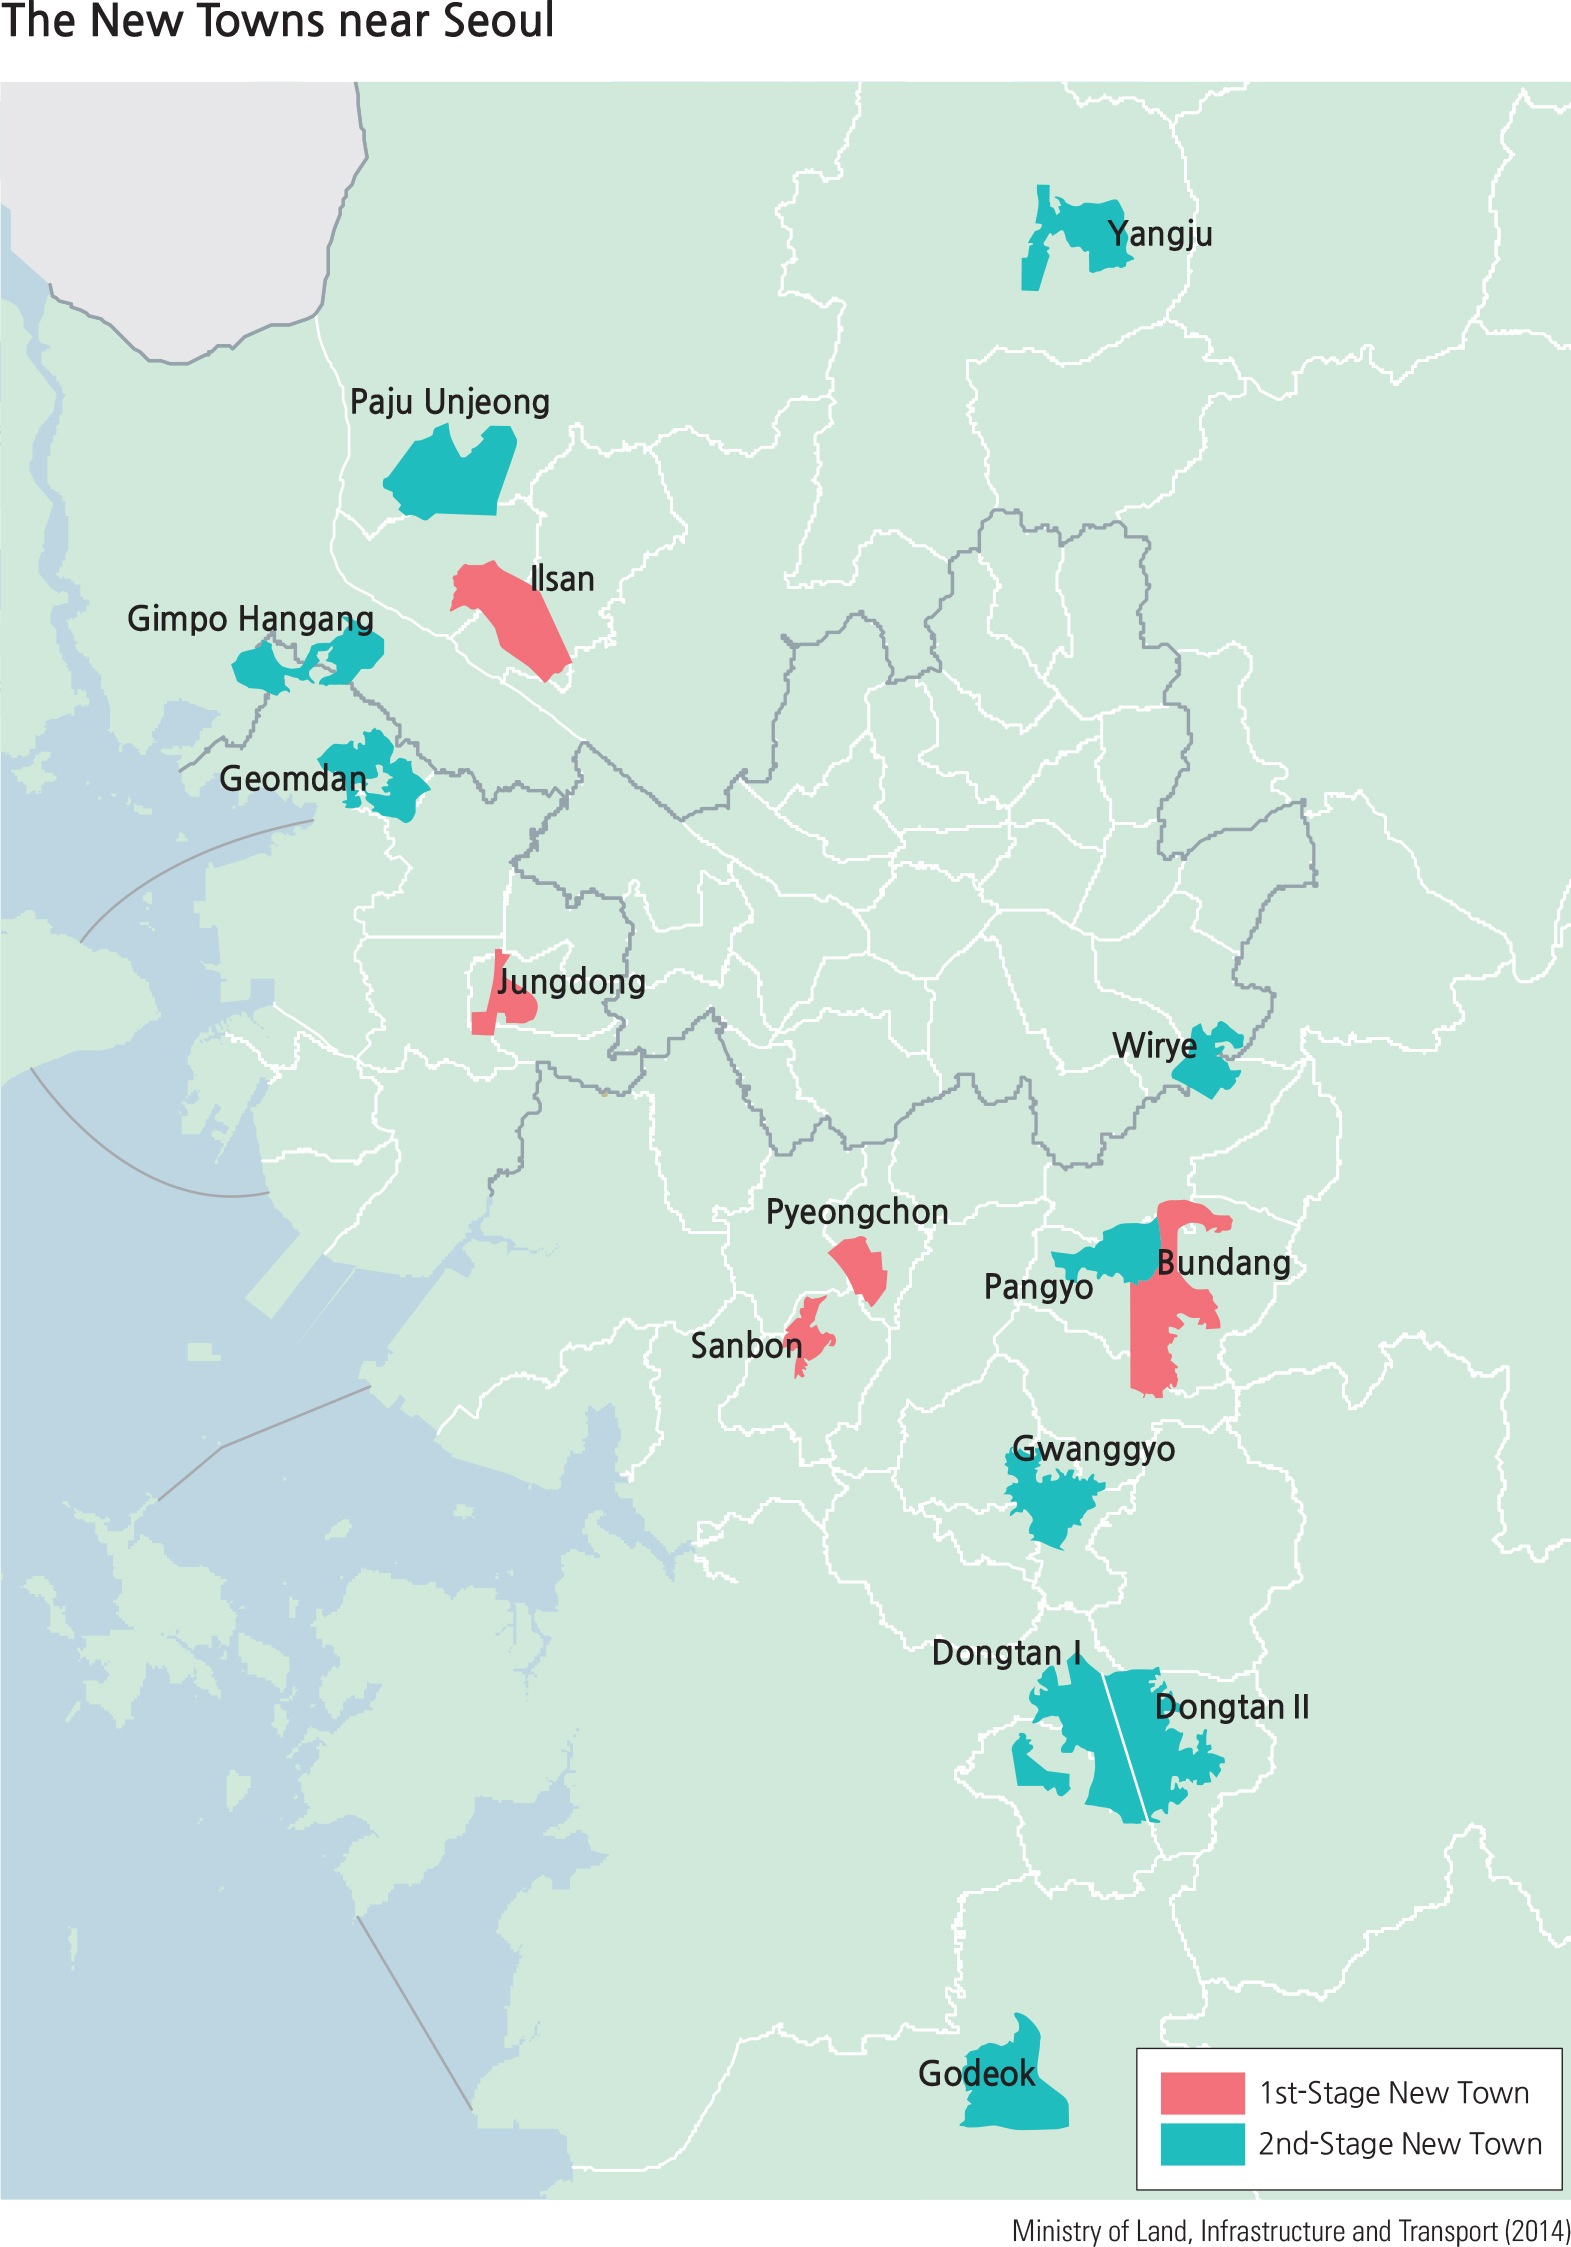
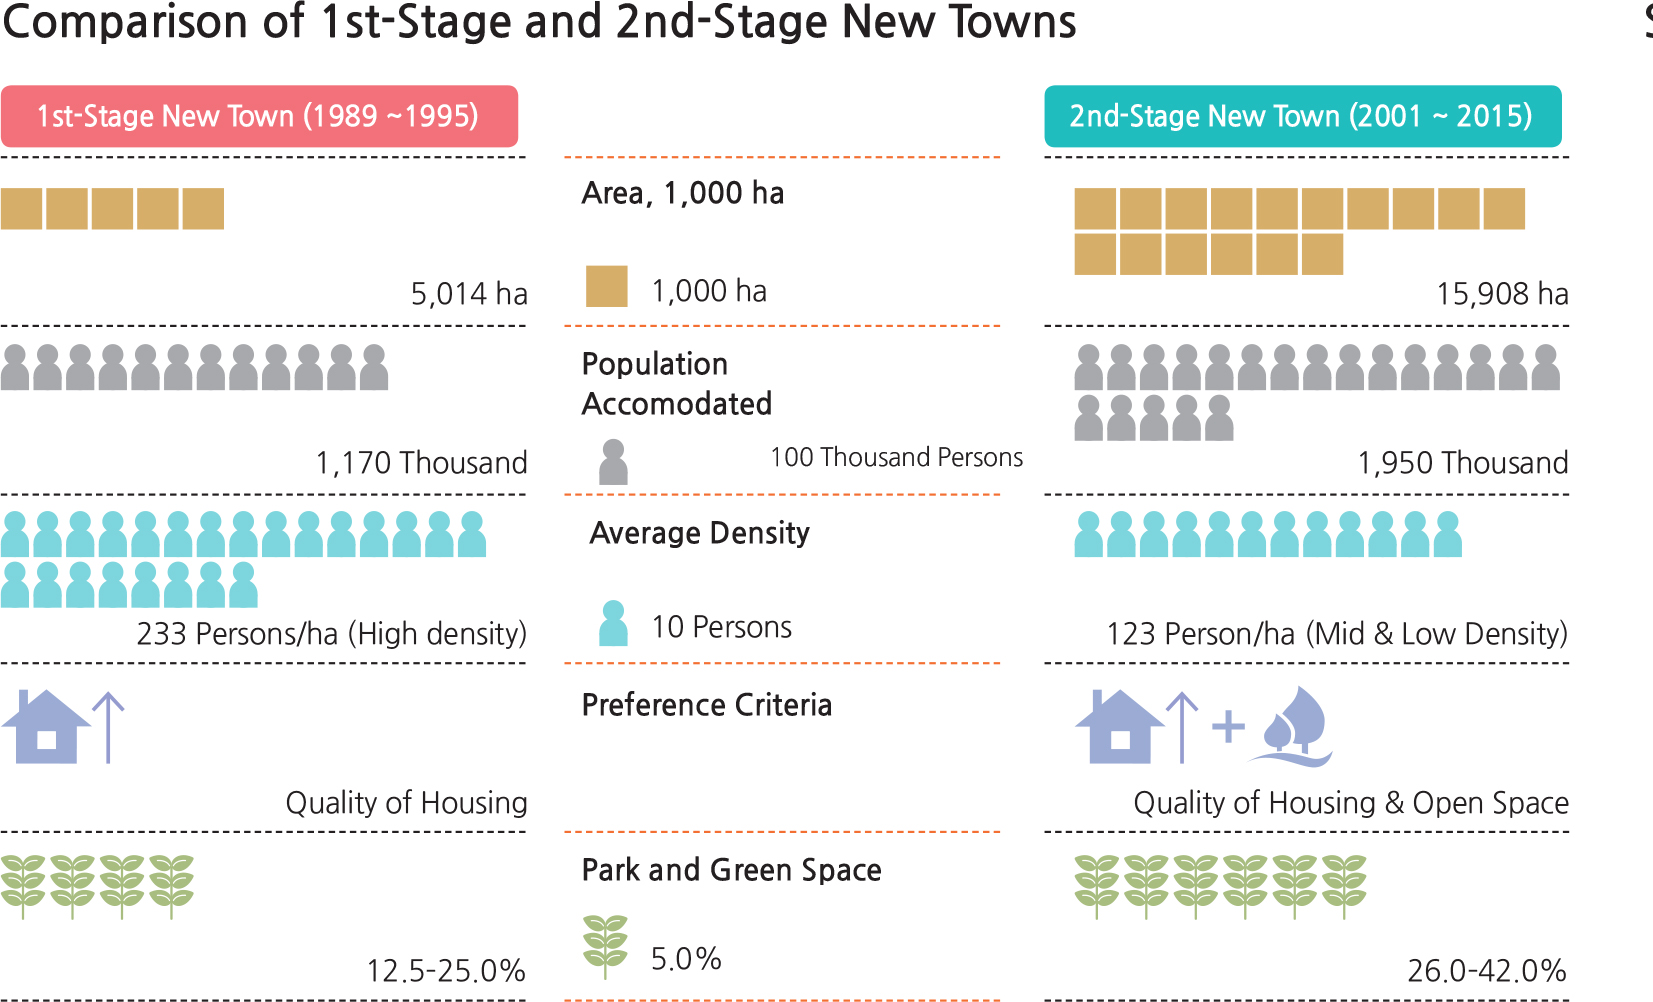
During the 1970s, industrial cities were constructed in maritime regions with the primary goal of promoting heavy chemical industries. The construction of Changwon as a newly industrialized city with a population of 300,000 led to the use of the term of “New Town.” In the 1980s new towns in large cities were constructed in both Mok-dong and Sanggyedong with the primary goal of providing adequate housing. Five new towns in the capital area associated with this First Stage New Town Development were also constructed as a part of a plan to facilitate population dispersion by building two million homes. Daejeon-Dunsan and the Gyeryong area were constructed to facilitate the partial relocation of administrative functions out of Seoul and into the greater metropolitan area. Bundang, Ilsan, Pyeongchon, and Sanbon were all First Stage New Towns.
By the 1990s, there were many criticisms of these simultaneously developed large-sized new towns, and the policy trend shifted toward the development of small-sized communities that were dispersed through the outer areas surrounding major metropolitan communities. Unfortunately, this attempt to redress the problems of First Stage New Towns was hindered by many serious obstacles, not the least of which included the lack of suitable infrastructure. By the turn of the last century, Second Stage New Towns were constructed according to the concept of planned cities. The goal of these was to redress the problems created by the past approach to development and to supplant the smaller-sized dispersed development model with a more idealized model. Pangyo, Dongtan, Gimpo Hangang, Paju Unjeong, Yangju, Wirye, Godeok, Geomdan, Asan, and Daejeon-Doan are all examples of planned cities.
A new approach to developing Korean national territory resulted in the adoption of a multi-core distribution structure that shifted the focus from the capital region to the nation at large thereby allowing more region-to-region balance. This approach to decentralization can be seen in projects such as the construction of multiple “Enterprise Cities” in the late 2000s that were central to the government strategy to foster five mega-regional economic
zones and two individual economic zones. The goal was to provide a broader distribution of development initiatives which might help to create competitive agglomeration economies. The main strategy was to attract private investments and to expand the growth potential in each mega-regional economic zone.
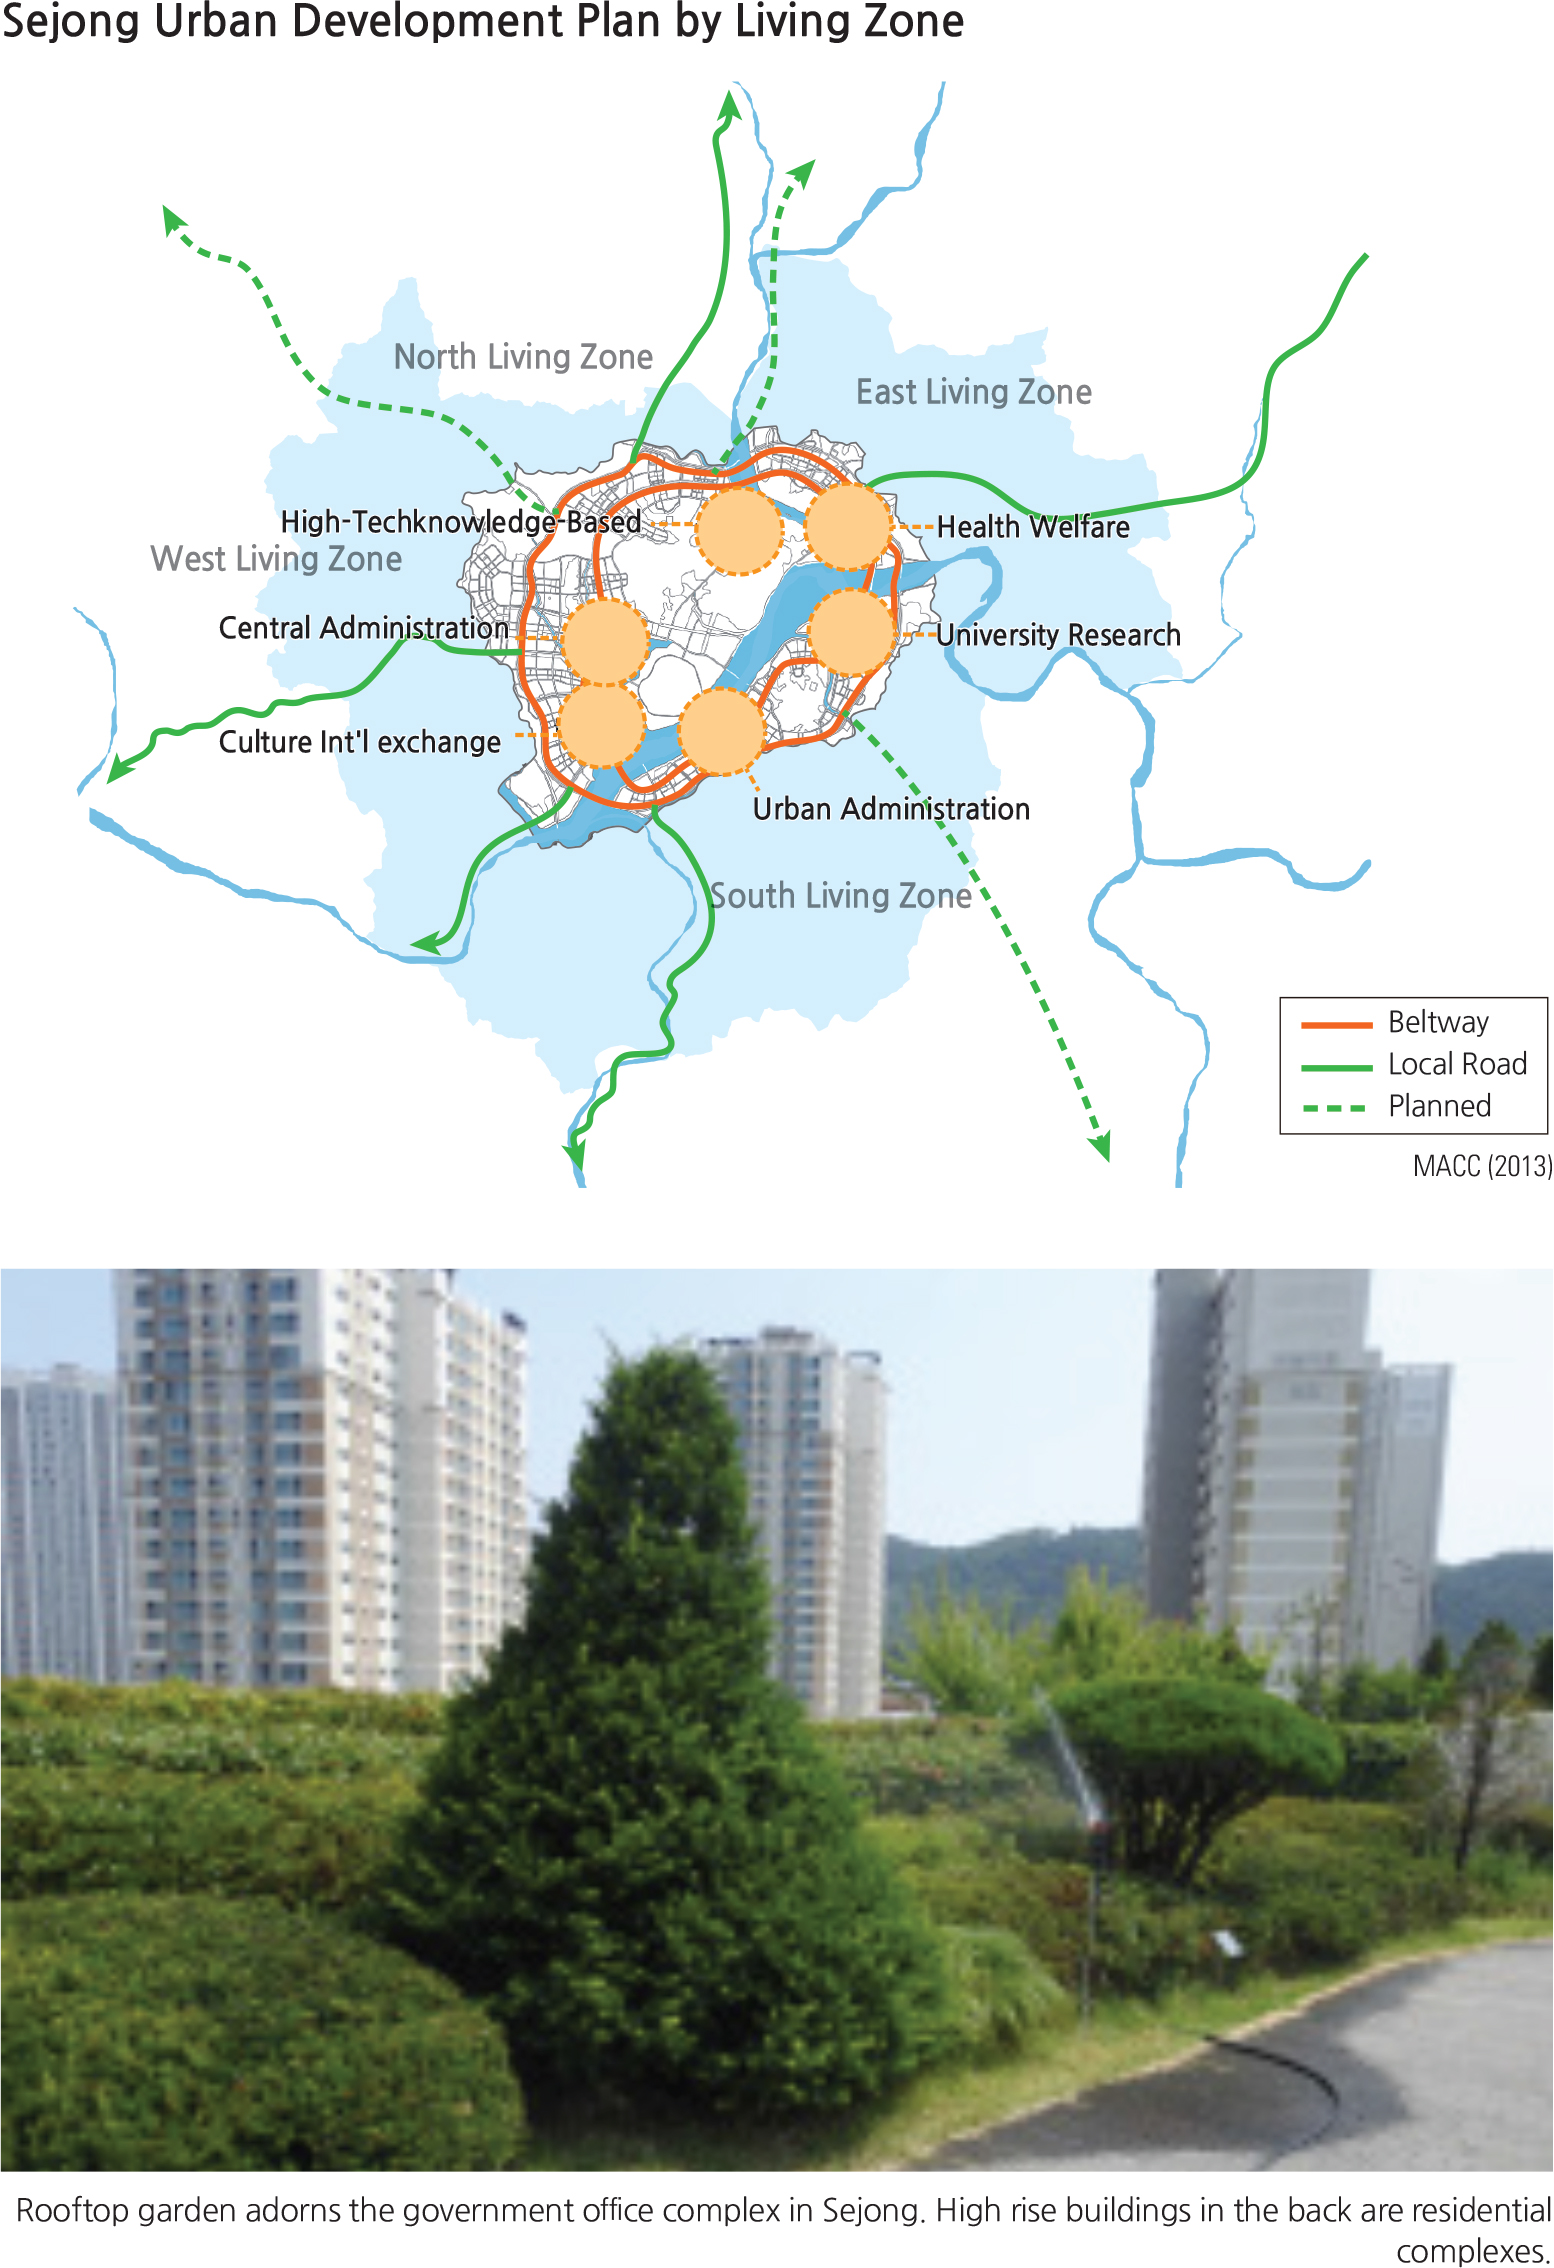
High rise buildings in the back are residential complexes.
The case of Sejong City, which was built as a completely new city to house many governmental ministries, is a prime example of carefully researched and planned exemplary work in urban planning. Here, the government office complex is designed with sufficient housing with comfortable dwellings for government workers who were moved here from Seoul. Rooftop garden spaces and exercise facilities adorn the government office complex.
The Park Geun-hye government established a new regional development policy that created what was called the “HOPE Area,” in which all basic daily services are integrated into a single living area. Here “HOPE” refers to the first characters of four policy visions, “Happiness, Opportunity, Partnership and Everywhere.” The new policy was designed to establish autonomous development plans based on local conditions and aims to improve the quality of life for local residents no matter where they are located: in the rural areas, the rural-urban transition zones, or the core of the cities.
Brief Interpretation of the Maps
The Sejong City map illustrates the careful urban planning process that maximizes the interactions between government, high-tech development, university research, medical facilities, cultural centers, and residential districts. The new town map shows the boundary of Seoul and proximity to the First Stage New Town and Second Stage New Town developments. The Second Stage was implemented to correct some of the unforeseen inadequacies of the First Stage New Town developments.
If you are building a completely new city, list and discuss the major work that you have to do to achieve this accomplishment. What must you