In addi t ion to a funct ional government , good transportation infrastructure, and sound spatial planning, the transformation of a nation also needs economic growth and successful industries. Since the founding of the Republic of Korea in 1948, there was a gradual transformation of the Korean economy from agriculture, fishery, and forestry to that of industrialization. Plans for industrialization began in the 1960s that resulted in achieving growth rates of 8.4% in the 1960s, 9% in the 1970s, and 9.7% in the 1980s. Manufacturing, in particular, maintained an average growth rate in excess of 10%: at 16.8% in the 1960s, 15.8% in the 1970s, and 12.2% in the 1980s even with decadal fluctuations.
Since the 1980s, the government adopted a different strategy, and promoted and implemented several ideas including export-oriented manufacturing, development of
intellectual talent to conduct research and development across all industries, and encouraged ‘chaebols’ or conglomerates. Through spatial planning, the government
also developed multiple port facilities along the southeast coast that expedite import-export activities. This strategy began to pay off in the 1990s when the high-tech manufacturing industry rapidly expanded because Korea had the vision of developing intellectual talent in research and development.
As these industries developed, the need for service industries became more important and ultimately became indispensable. Service industries such as banking, financial services, insurance, freight, logistics, communication, and digital services dramatically expanded since the 1990s. By the 2010s, the service industry has become the highest source of employment in the nation.
Primary industries such as agriculture, fishery, and forestry greatly declined from 40% in the 1950s to only 3% of the national economy by the 2000s. During the same period, manufacturing increased from 12% to 27.4%. These recent trends of the Korean economy illustrate the evolution to secondary (manufacturing) and tertiary (service) industries.
The measurement of the success of a nation is normally based on economic indices. Different nations adopt different indices. In Korea, such measurement is based on the Gross Domestic Product (GDP) along with the total number of establishments and employees, value added by industries, international trade and balance of payments, research and development activities, local finance, and other statistical indicators. According to the World Bank (2014), the gross domestic product (GDP) of Korea was ranked 12th in the world in 2014 at 1,486 trillion won, or 1,410 billion USD.When the GDP is adjusted to reflect the Purchasing PowerParity, it ranked 13th place.
An analysis of the changes in the industrial structure by industrial sector reveals that the proportion of the gross domestic product accounted for by the agriculture, forestry, and fishery industries declined sharply to only 2.3% by 2014. Mining and manufacturing was at 30.3% in 2014, demonstrating a continuous increase. Services and other tertiary sectors increased to 67.4% by 2014, showing a proportional increase. These trends illustrate how the industrial structure of Korea was reorganized after 1970, with –the proportion of the Korean GDP evolving from a primary industrial structure to predominantly secondary and tertiary industries.
Brief Interpretation of the Maps
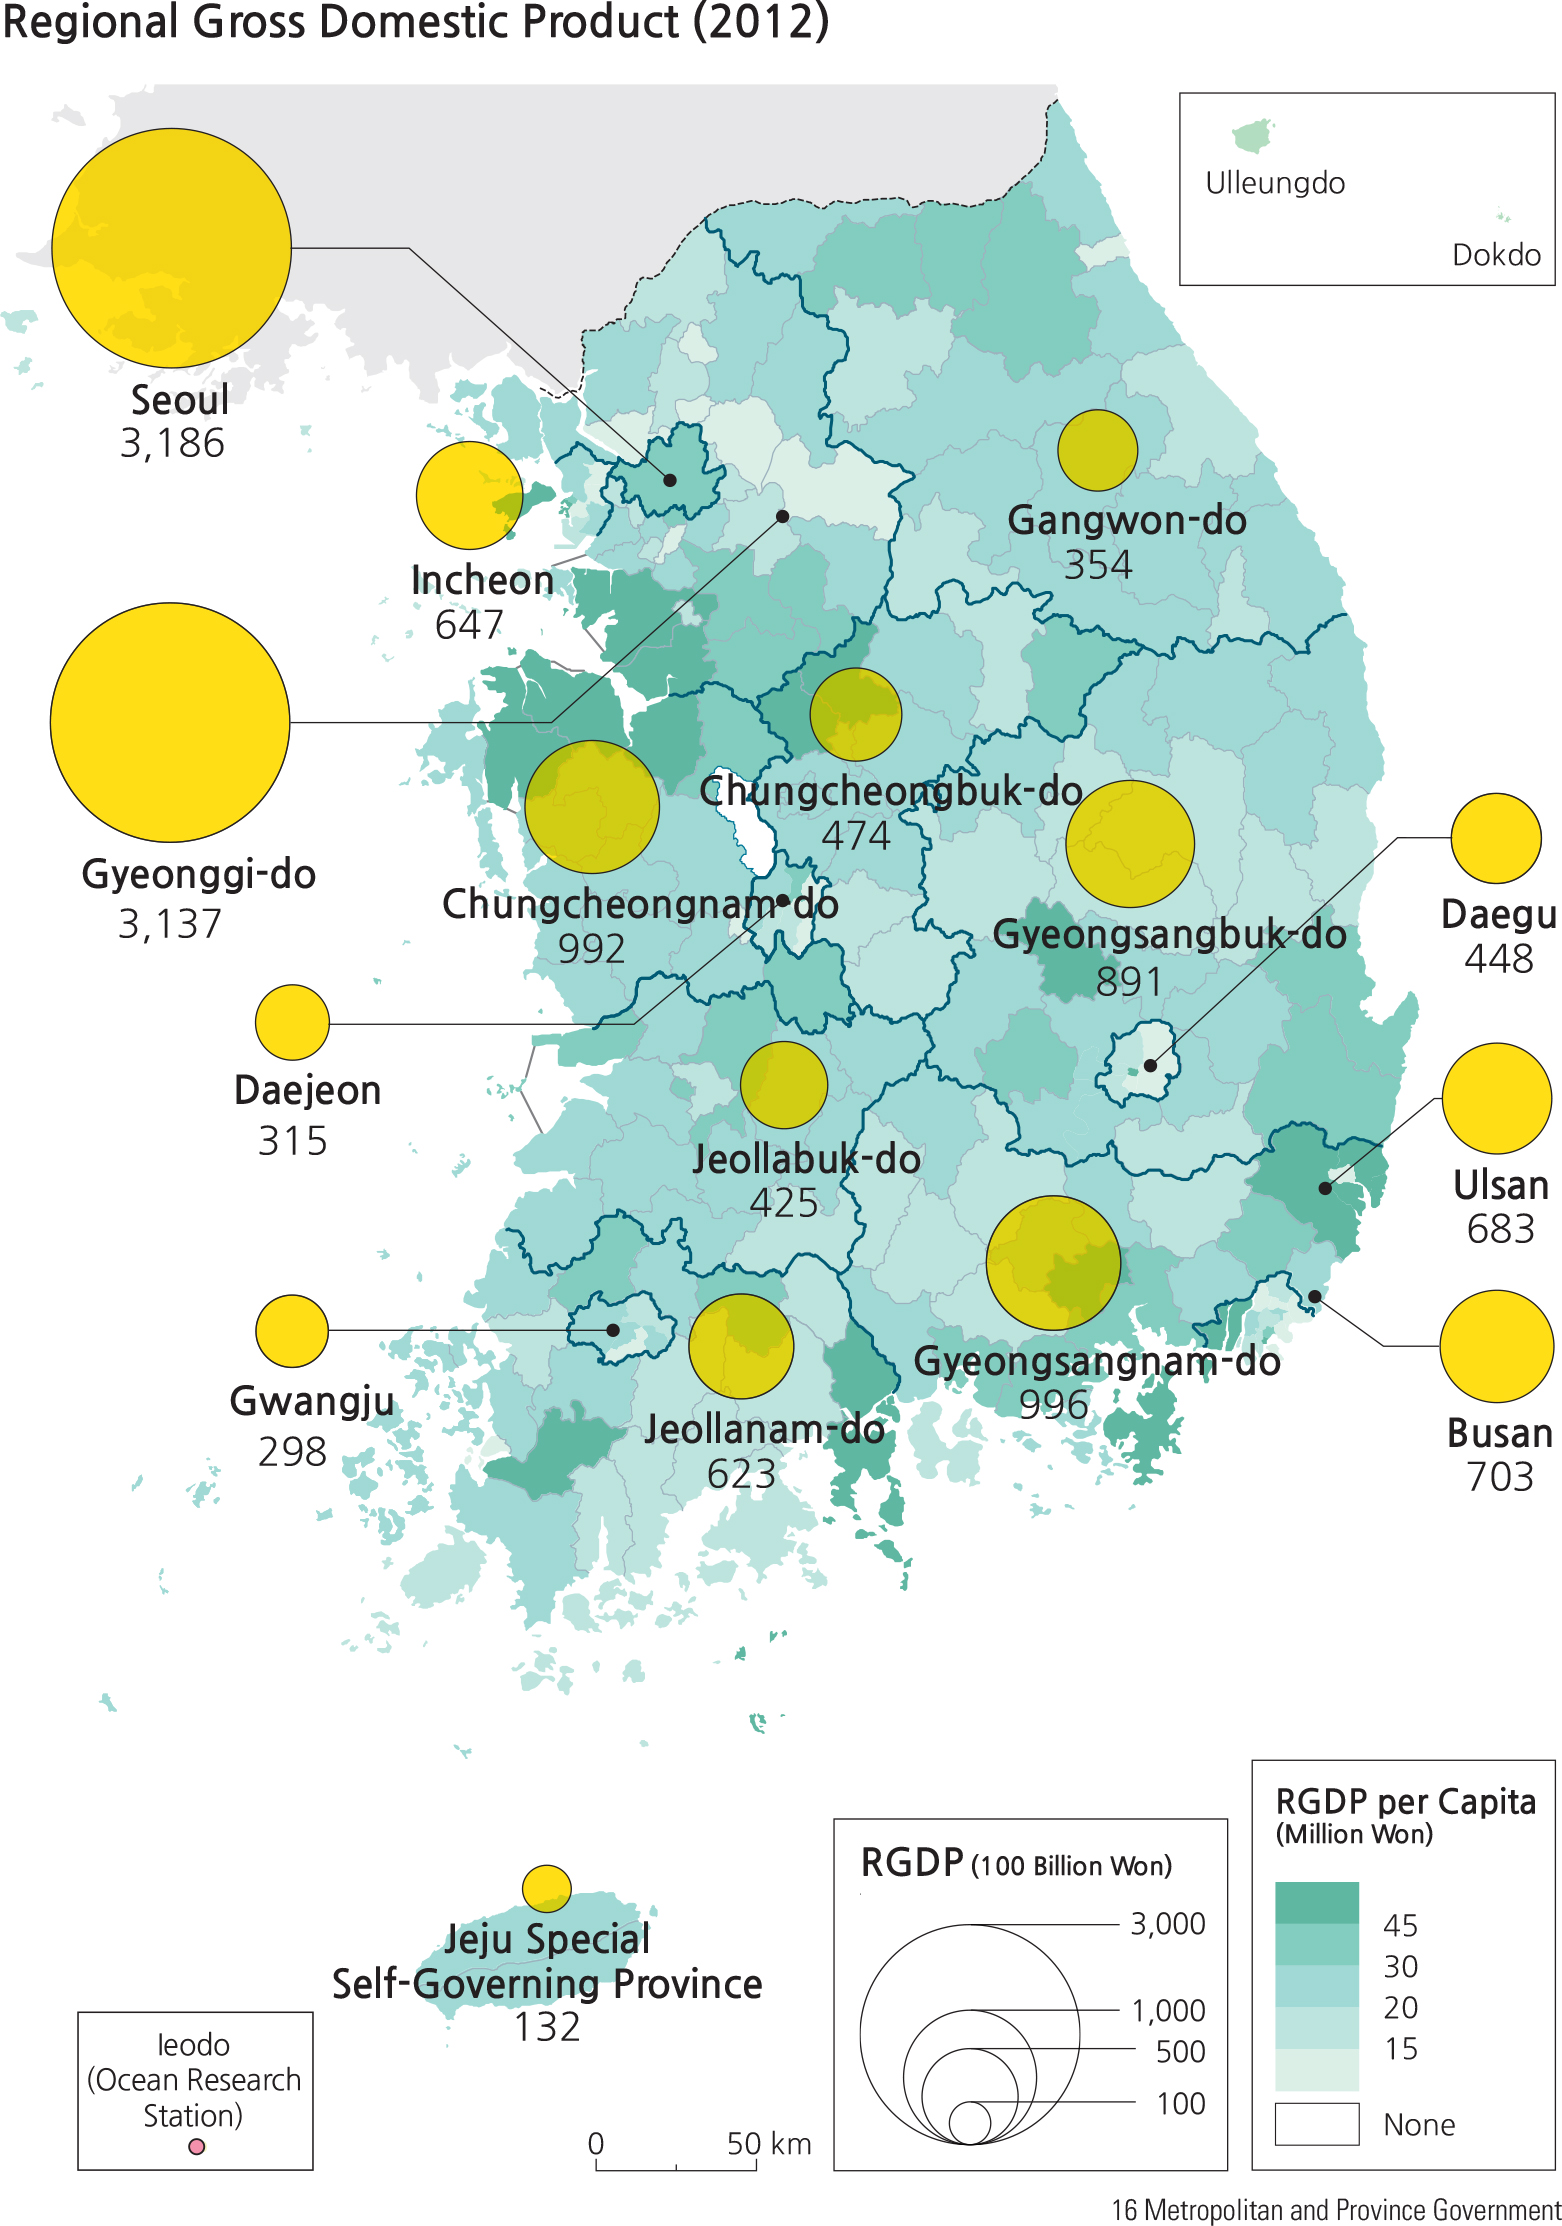
The 2012 Regional Gross Domestic Product (RGDP) map displays two related but quite different distributions of economic information. The graduated circles on this map depict total RGDP in 100 billion won per metropolitan and province units and are concentrated as expected in urban and more industrialized districts. The choropleth data illustrates RGDP per capita in 100 million won in si-gungu sub-districts of provinces. The per capita map element shows a quite different data set. Although the patterns are similar there is an additional type of difference. The per capita information displays a color code that represents an average of all the residents of the sub-district that gives a sense of the differences in general composition of the population in the sub-districts. Compare the sub-districts of Ulsan and Busan. Although both have nearly the same RGDP, Ulsan has a higher per capita data value than Busan and a much higher per capita value than nearby Daegu.
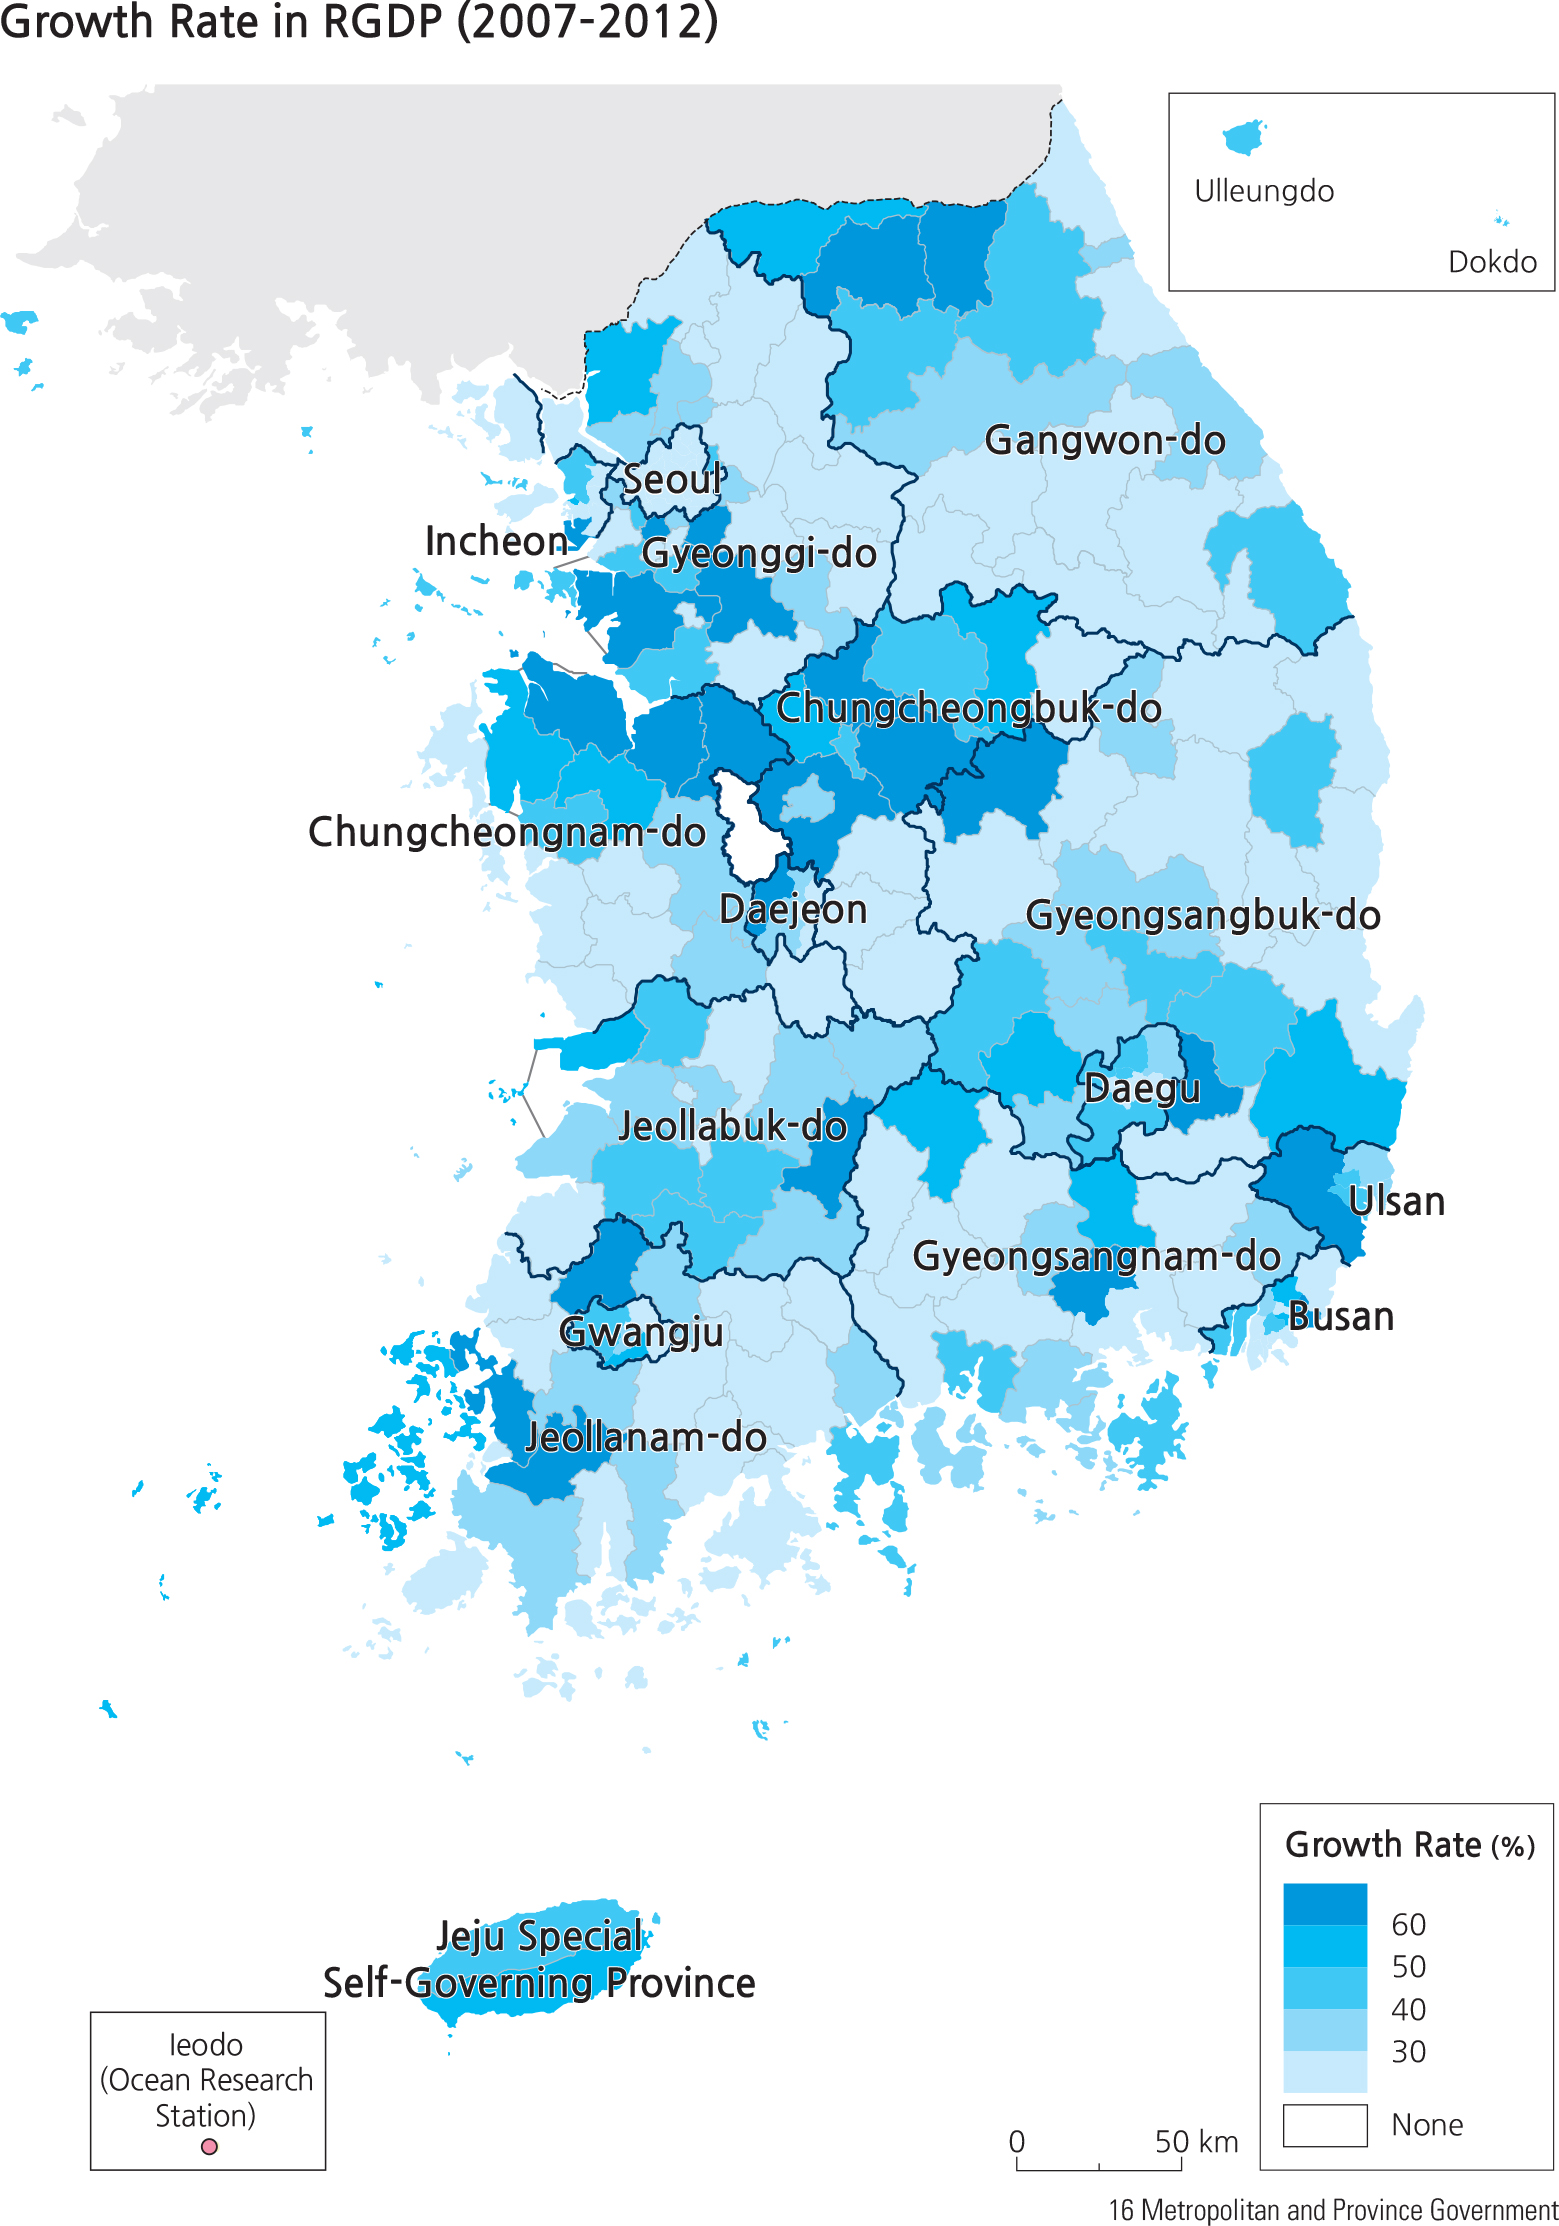
The map titled “Growth Rate in RGDP (2007–2012)” details the rate of growth. That pattern is basically extending the choropleth information on the other map backwards five years by sub district.
Compare the growth rate of Daegu, Busan and Ulsan over the five year period shown on the 2012 map. Might that pattern have a bearing on per capita RGDP differences on the 2012 map? Could you propose which could cause the differences?
Employment
National economic activities can be reviewed through the characteristics of employment. Labor force participation rate is the share of the economically active population (both employed and unemployed) as a percentage of the population group older than 15 years of age. It is the most typical indicator to evaluate the active economic activity of a nation. The employment rate is the number of employed persons as a percentage of the entire population group older than 15 years of age. The unemployment rate indicates the number of unemployed persons as a percentage of this economically active population.
The employment rate is lower in metropolitan areas even though there are a lot of jobs, but this is due to the high urban population that skews the statistic. On the other hand, the unemployment rate is high in urban areas due to the high number of job seekers compared to the size of the urban population. In non-urban areas, even though the share of the non-economically active population is high, unemployed adults are either not interested in working or are not active job seekers; thus, they are not counted in the statistics.
As of 2013, the total employable population in Korea over 15 years old was about 42.1 million. Of that, the economically inactive population, who are not actively searching for jobs (for reasons such as child rearing, homemaking, in school, in national defense, and for any other social reason) was 16.2 million. Therefore, the economically active population, those who are currently employed or actively searching for jobs, was 25.9 million. In 2013, the employed population was 25.1 million (96.9 percent), while the unemployed was 0.8 million (3.1 percent).
Brief Interpretation of the Maps and Graphs
The Share of Value Added by Industry graph is an important element to the understanding of the changes in South Korea since the end of the Korean War. It shows a trend that has been intentionally planned and controlled by the government. After a few major economic spikes and drops in the 1960s, the agriculture, forestry and fisheries have steadily declined, while mining and manufacturing have steadily increased accompanied by a steady increase in the service, energy and construction sectors. The service sector such as banking, communications, transport and other such elements that support the heavier mining and manufacturing industry has increased concomitantly with mining and manufacturing.
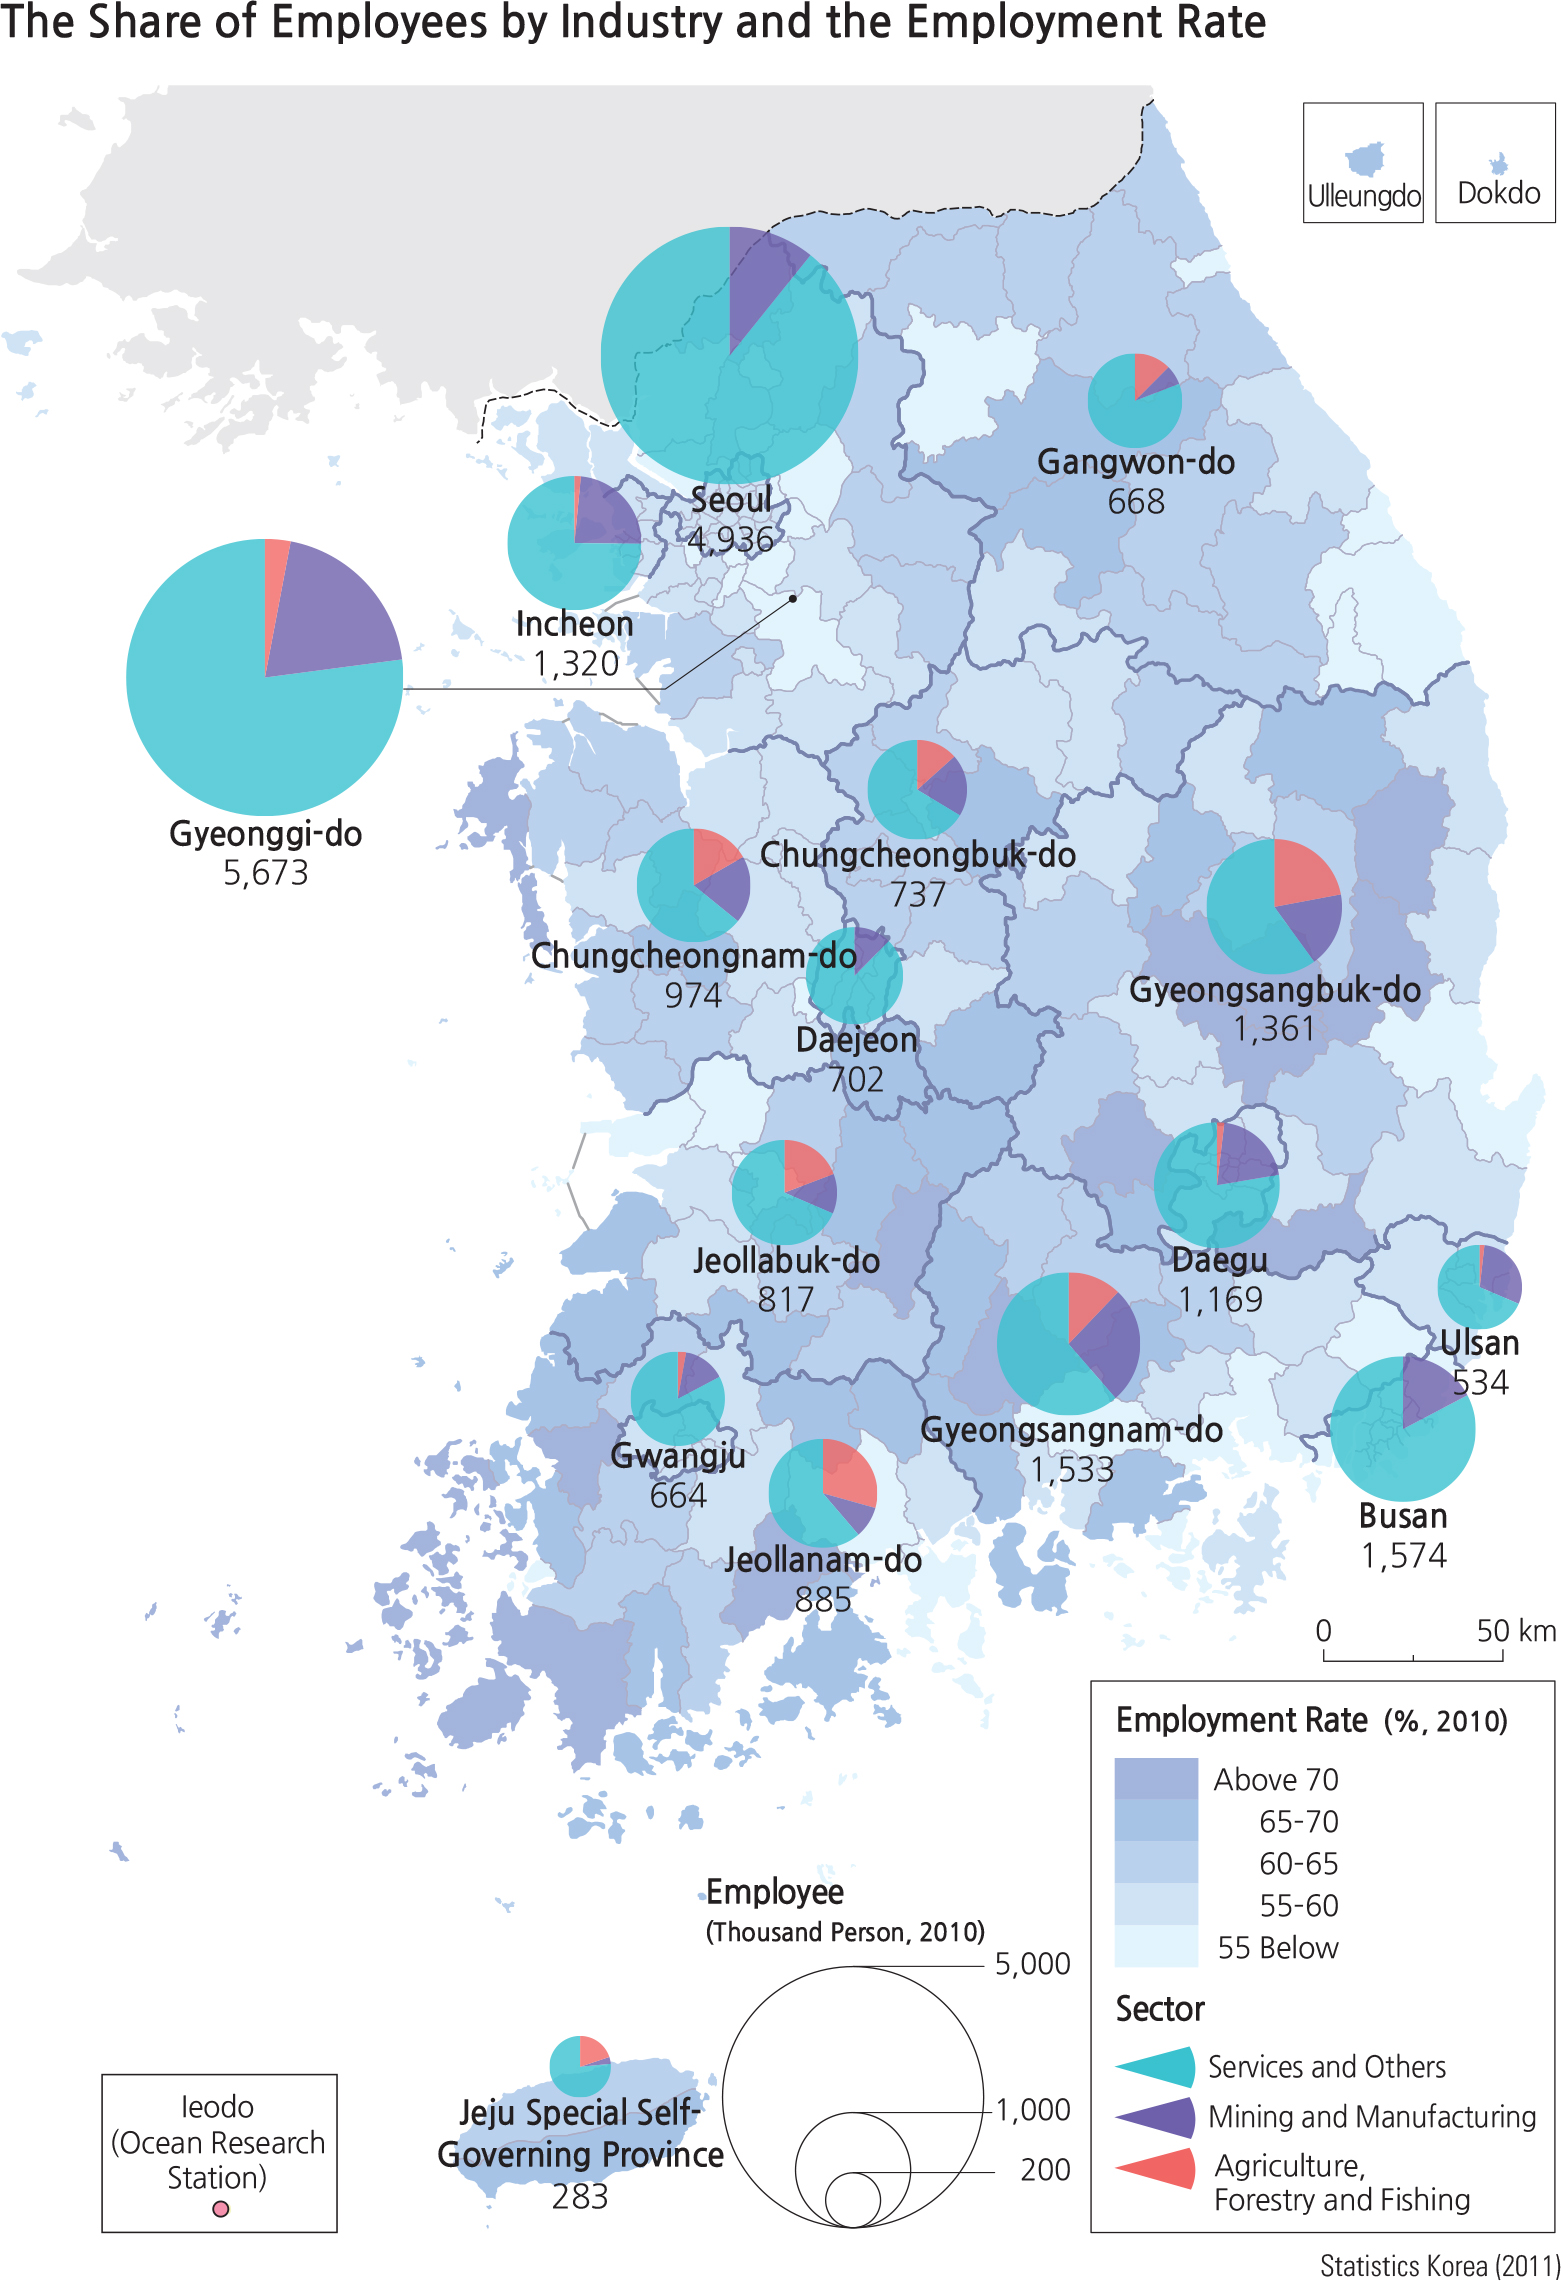
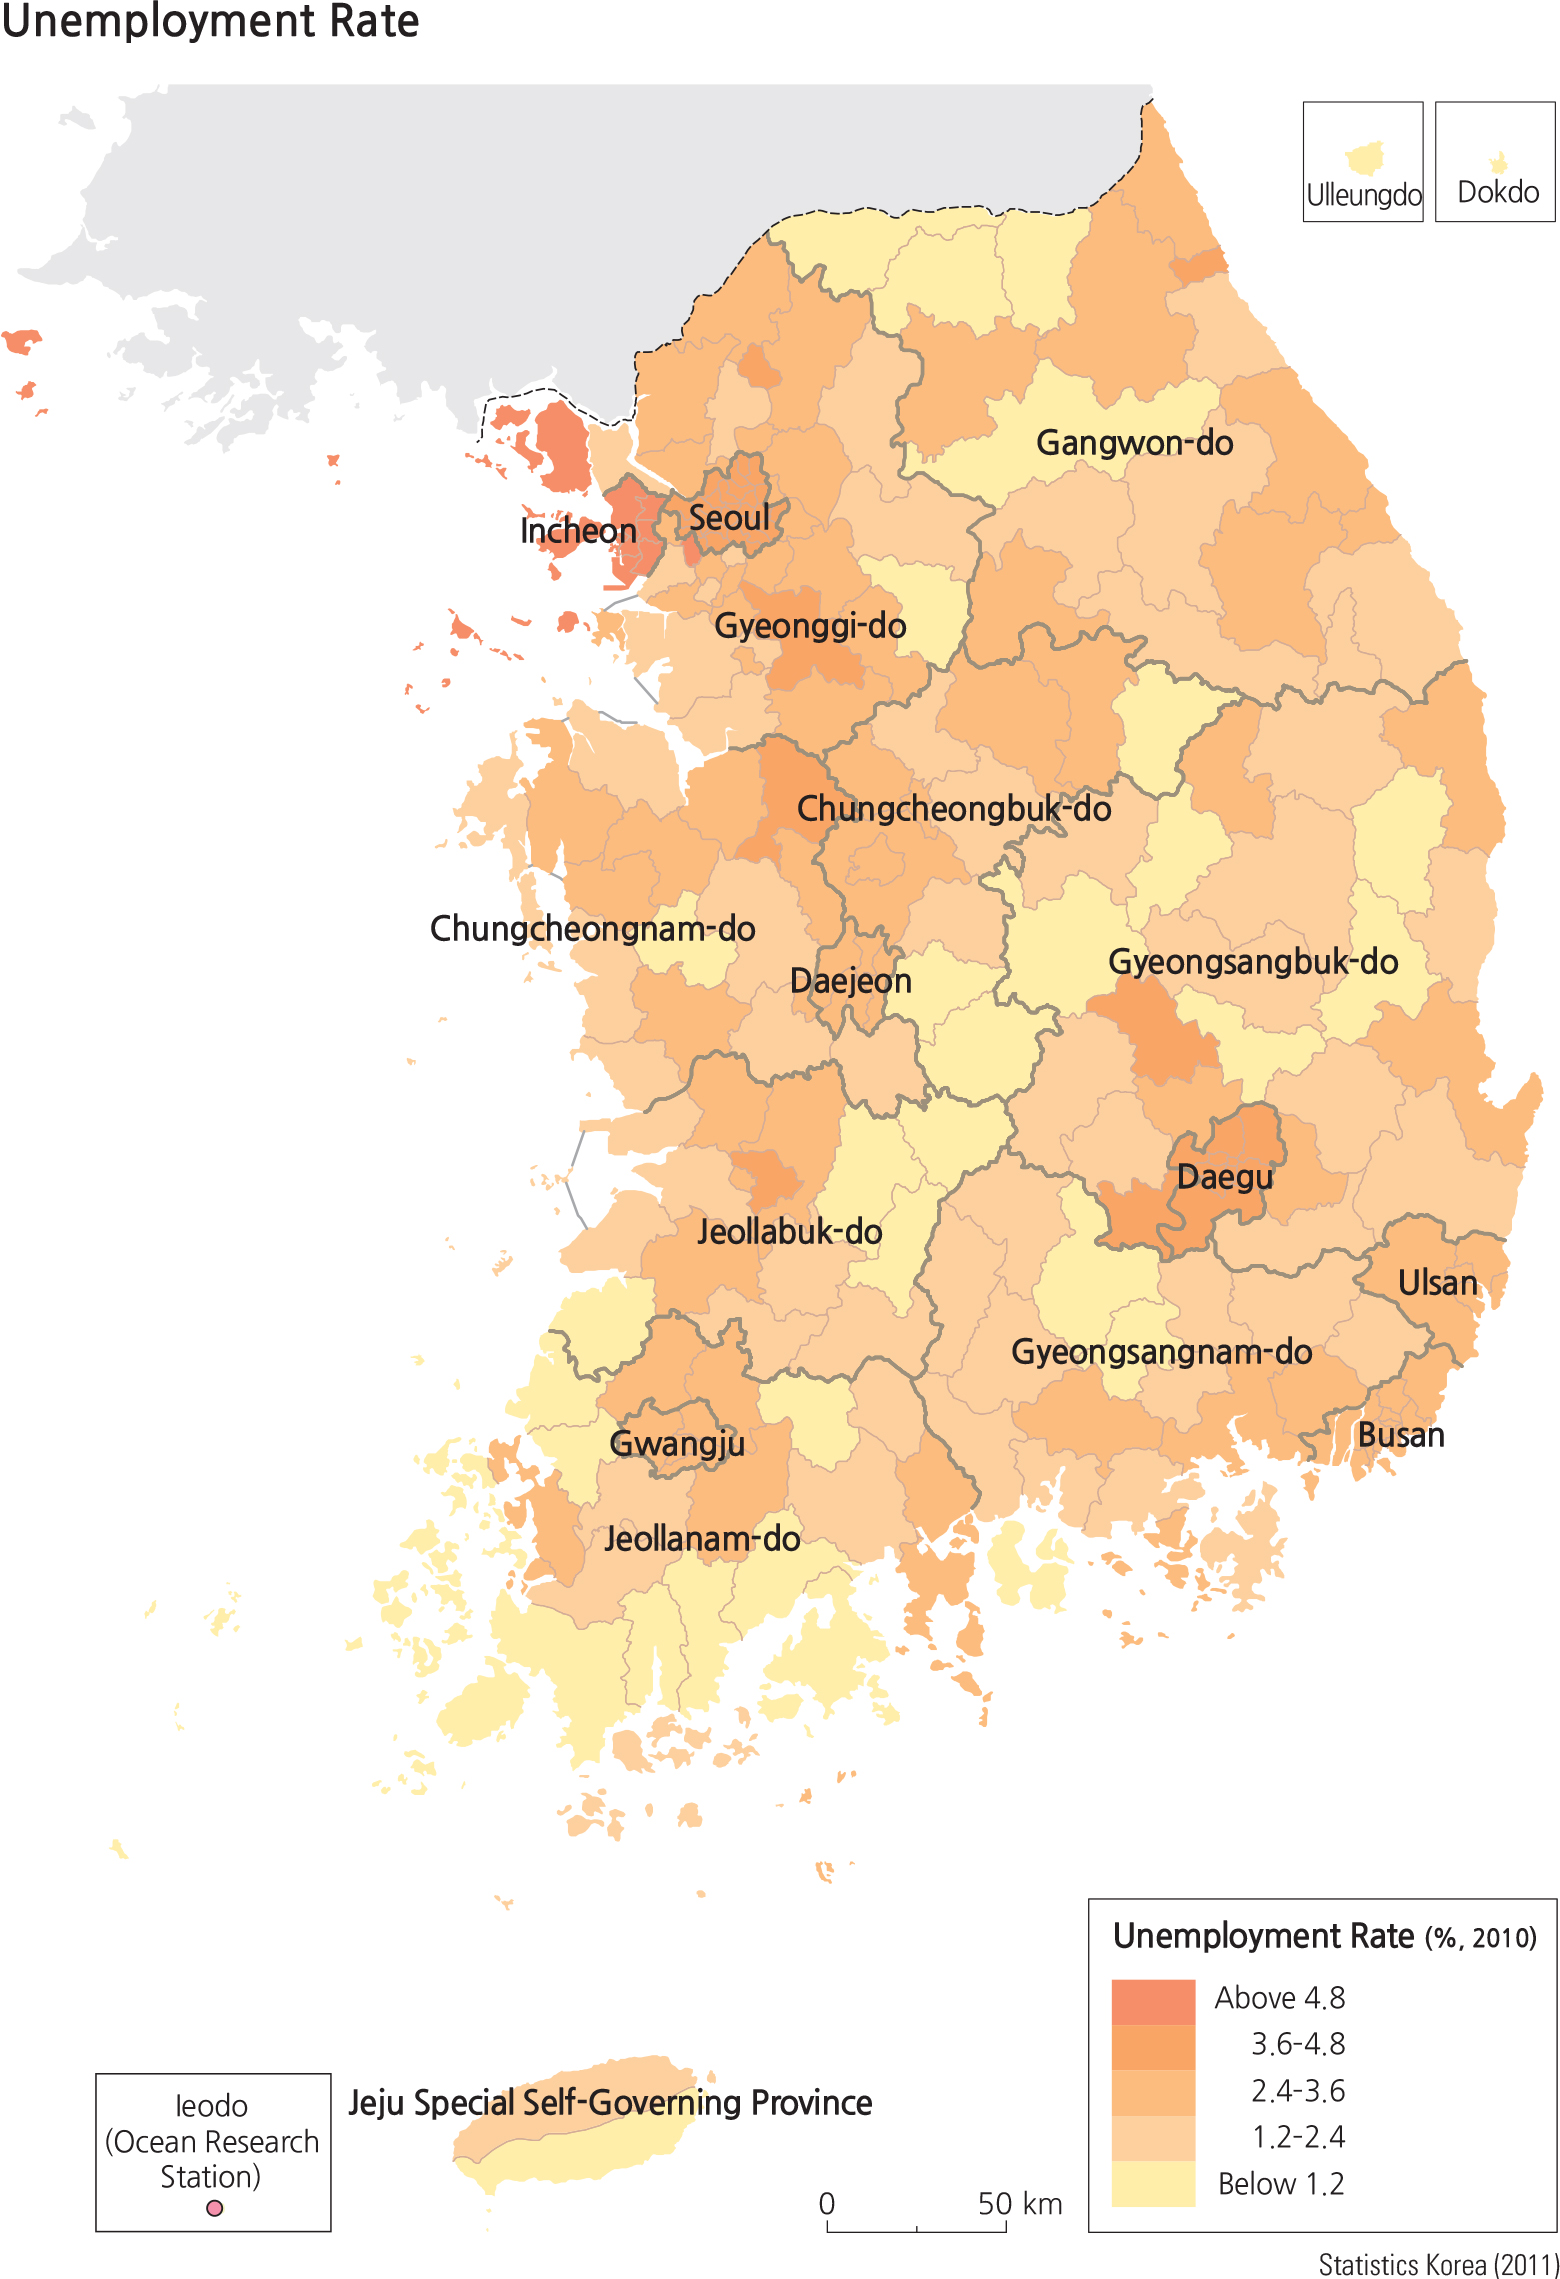
While the percentage composition of the service industry has increased, actual employee numbers have increased more. In the metropolitan and provincial levels, the service industry throughout the country comprises a minimum of 60% of the workforce and in Seoul, over 80%. The percentage of people employed in all sectors in the sub-districts is quite variable. The unemployment rate depicts some interesting patterns with a band of higher unemployment around some the metropolitan areas.
Incheon and Daegu illustrate a concentrated zone of high unemployed (low by standards of some other nations but high by South Korean standards). What could cause this increased unemployment on the fringes of these and some other cities? Many of the island sub-districts along the south coast of South Korea show a relatively high rate of unemployment. Are there obvious reasons for this pattern? Are there other island clusters in South Korea with a similar pattern? Would they have similar reasons?