Comprehensive Edition
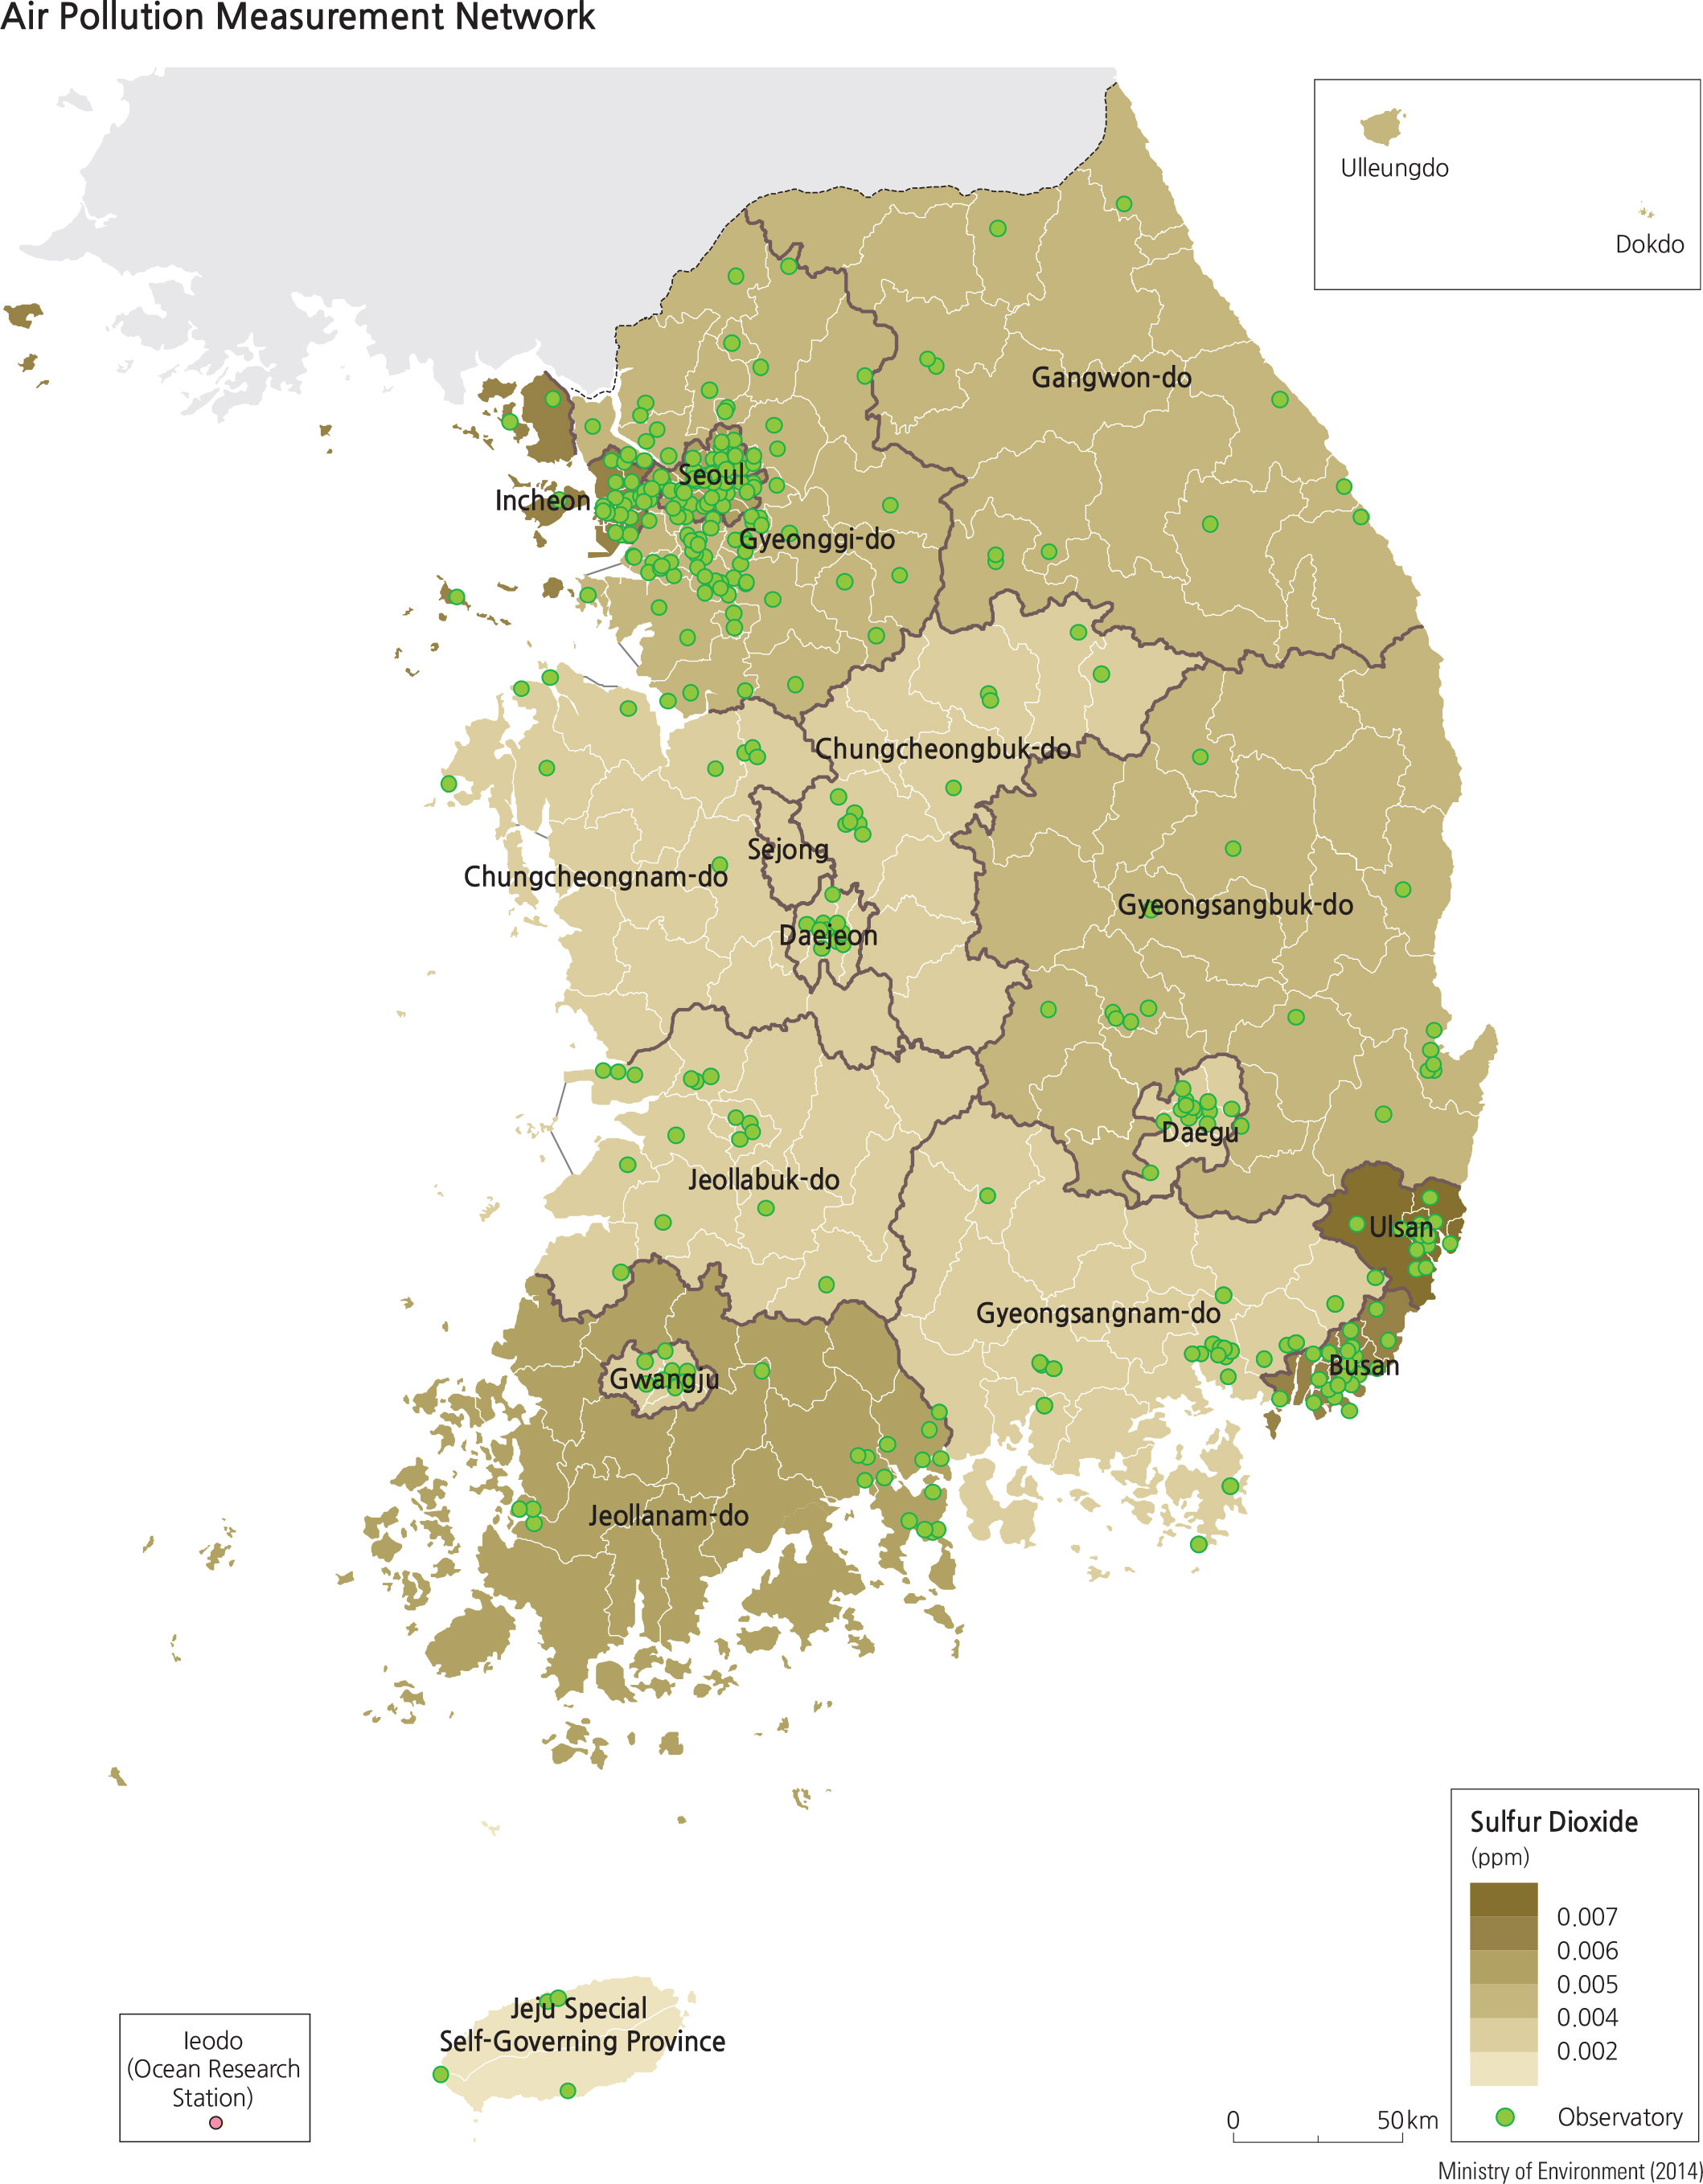
At the end of May 2015, an effort to coordinate and merge various air quality monitoring networks resulted in the National Air Pollution Monitoring Network. This new network with 514 stations was implemented throughout the country to investigate the status and trends of ambient air pollution and to determine whether air quality standards are being achieved. It is composed of an urban air monitoring network (259 stations), a roadside air monitoring network (38 stations), a national background monitoring network (3stations), a suburban air monitoring network (19 stations), an acid deposition monitoring network (40 stations), an atmospheric heavy metal monitoring network (54 stations), a hazardous air pollutants monitoring network (32 stations), a photochemical air pollutant monitoring network (27 stations), a global atmosphere monitoring network (1 station), a fine particulate matter of 2.5 micrometers (PM2.5) monitoring network (35 stations), and an intensive monitoring network (6 stations). Data collected by the National Air Pollution Monitoring Network are stored in the National Ambient Air Monitoring System (NAMIS). Data on air pollution are disseminated in real time through “ir Korea”(www.airkorea.or.kr), an informational webpage first launched in December 2005 before the 2015 merger. As part of the merger and in response to increased public concern regarding urban air pollution, the Ministry of Environment (MOE) installed a monitoring network to measure air pollutants such as fine dust and ozone. Approximately 300 monitoring networks —ncluding urban air, roadside air, national background, and suburban air monitoring networks—measure a coarse particulate matter of 10 micrometers (PM10) and publicly provide realtime data on air quality. In addition, there are 6 intensive monitoring stations that prevent damage caused by air pollution by providing a more in-depth analysis on air quality. To reduce air pollutants that are toxic or hazardous to humans, the MOE launched a PM10 forecasting program for metropolitan areas in August, 2013 and expanded it throughout the country. In 2014, forecasts were extended to include PM2.5 and ozone. The forecast level is classified into 5 stages to indicate the level of the ambient air quality associated with health risks of air pollution. To fulfill the PM2.5 environmental standards newly implemented in 2015, the MOE expanded the PM2.5 monitoring network and established guidelines for its management of automatic data measurements. Currently, there are 164 automatic monitoring stations that measure PM2.5 concentrations (36 operated by the national government, 128 operated by local governments) and 36 standard monitoring networks. The Korean government has also implemented an air pollution warning system for ozone levels. Used for directly announcing ambient levels of air pollutants under high concentrations of ozone and particulate matter, the system prevents and reduces damage by providing specific instructions for each alert level. It effectively notifies respiratory disease patients, the elderly, and children that are prone to harmful levels of ozone concentration, and also strives to encourage the voluntary cooperation of citizens. While the system was first initiated in 1995 in Seoul, all local governments of Korea now utilize it to verify ozone concentrations and issue warnings accordingly. Brief Interpretation of the Map The Air Pollution Measurement Network map shows the locations of air pollution monitoring stations. As can be expected, there is a heavy concentration of these stations in major metropolitan area where traffic congestion and vehicle exhaust, among other air pollutants, would be highest. Outside metropolitan areas, the density of these stations is sparser. The map also classifies concentrations of sulfur dioxide by province and metropolitan boundaries in units of parts per million (ppm). Interpretation of the pattern of sulfur dioxide from this map can be tricky because of the variable densities of data-collection stations between urban and rural settings. The higher number of stations in urban areas suggests that data is relatively more accurate than for rural areas. The sparsity of stations in rural areas that collect data for composing this map suggests that data are collected in just a few stations but are purported to represent the entire stretch of the province. This creates a disparity between the number of data points, comparing rural and urban areas. In turn, there may also be a significant difference in the reliability of rural and urban results. For example, the map shows high concentrations of sulfur dioxide in urban areas such Seoul, Incheon, Busan, and Ulsan but not in other urban areas such as Daegu, Daejeon, and Gwangju. What is spatially interesting is that there is a high concentration of sulfur dioxide in Jeollanamdo Province where the rural distribution of stations is uneven and clustered; three stations are clustered on the west coast of the province and over a dozen are clustered at its eastern tip, with no measuring station in between. Yet, the entire province is mapped as having a uniform color that represents 0.006-0.007 ppm. Analyzing this uniformity of data against the much clustered data collection stations strongly suggests that there must be a vast and variable spatial pattern of sulfur dioxide distribution within the province. In other words, these two clustered locations should not be taken as truly representative of sulfur dioxide concentration for the entire province.
|