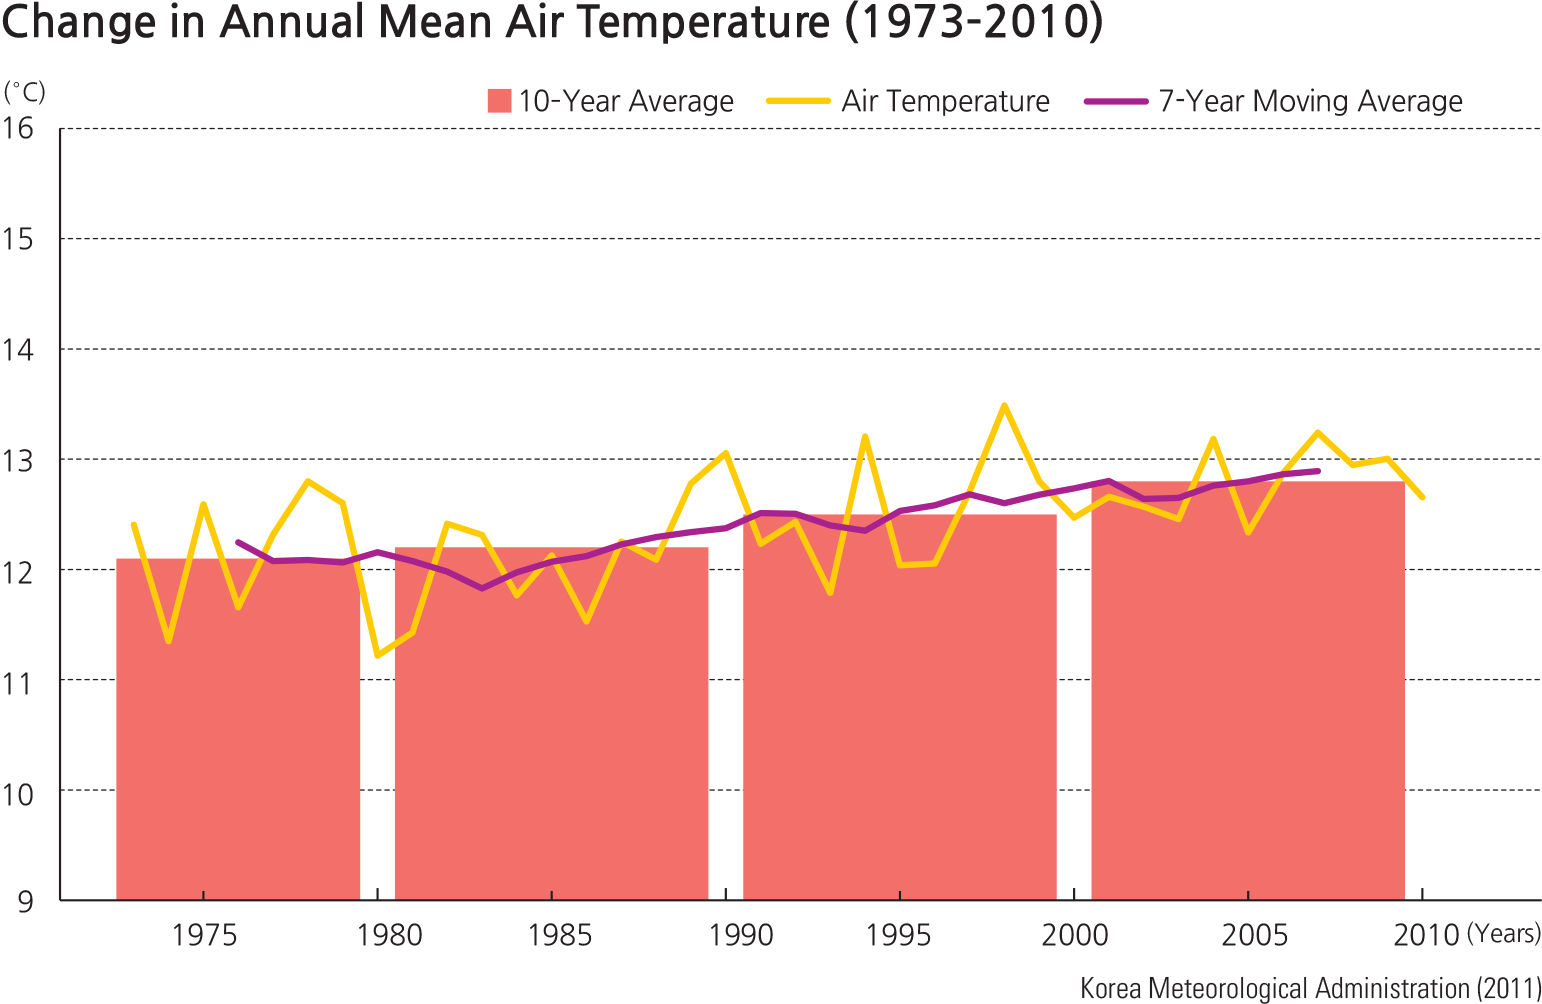
Increasing temperatures
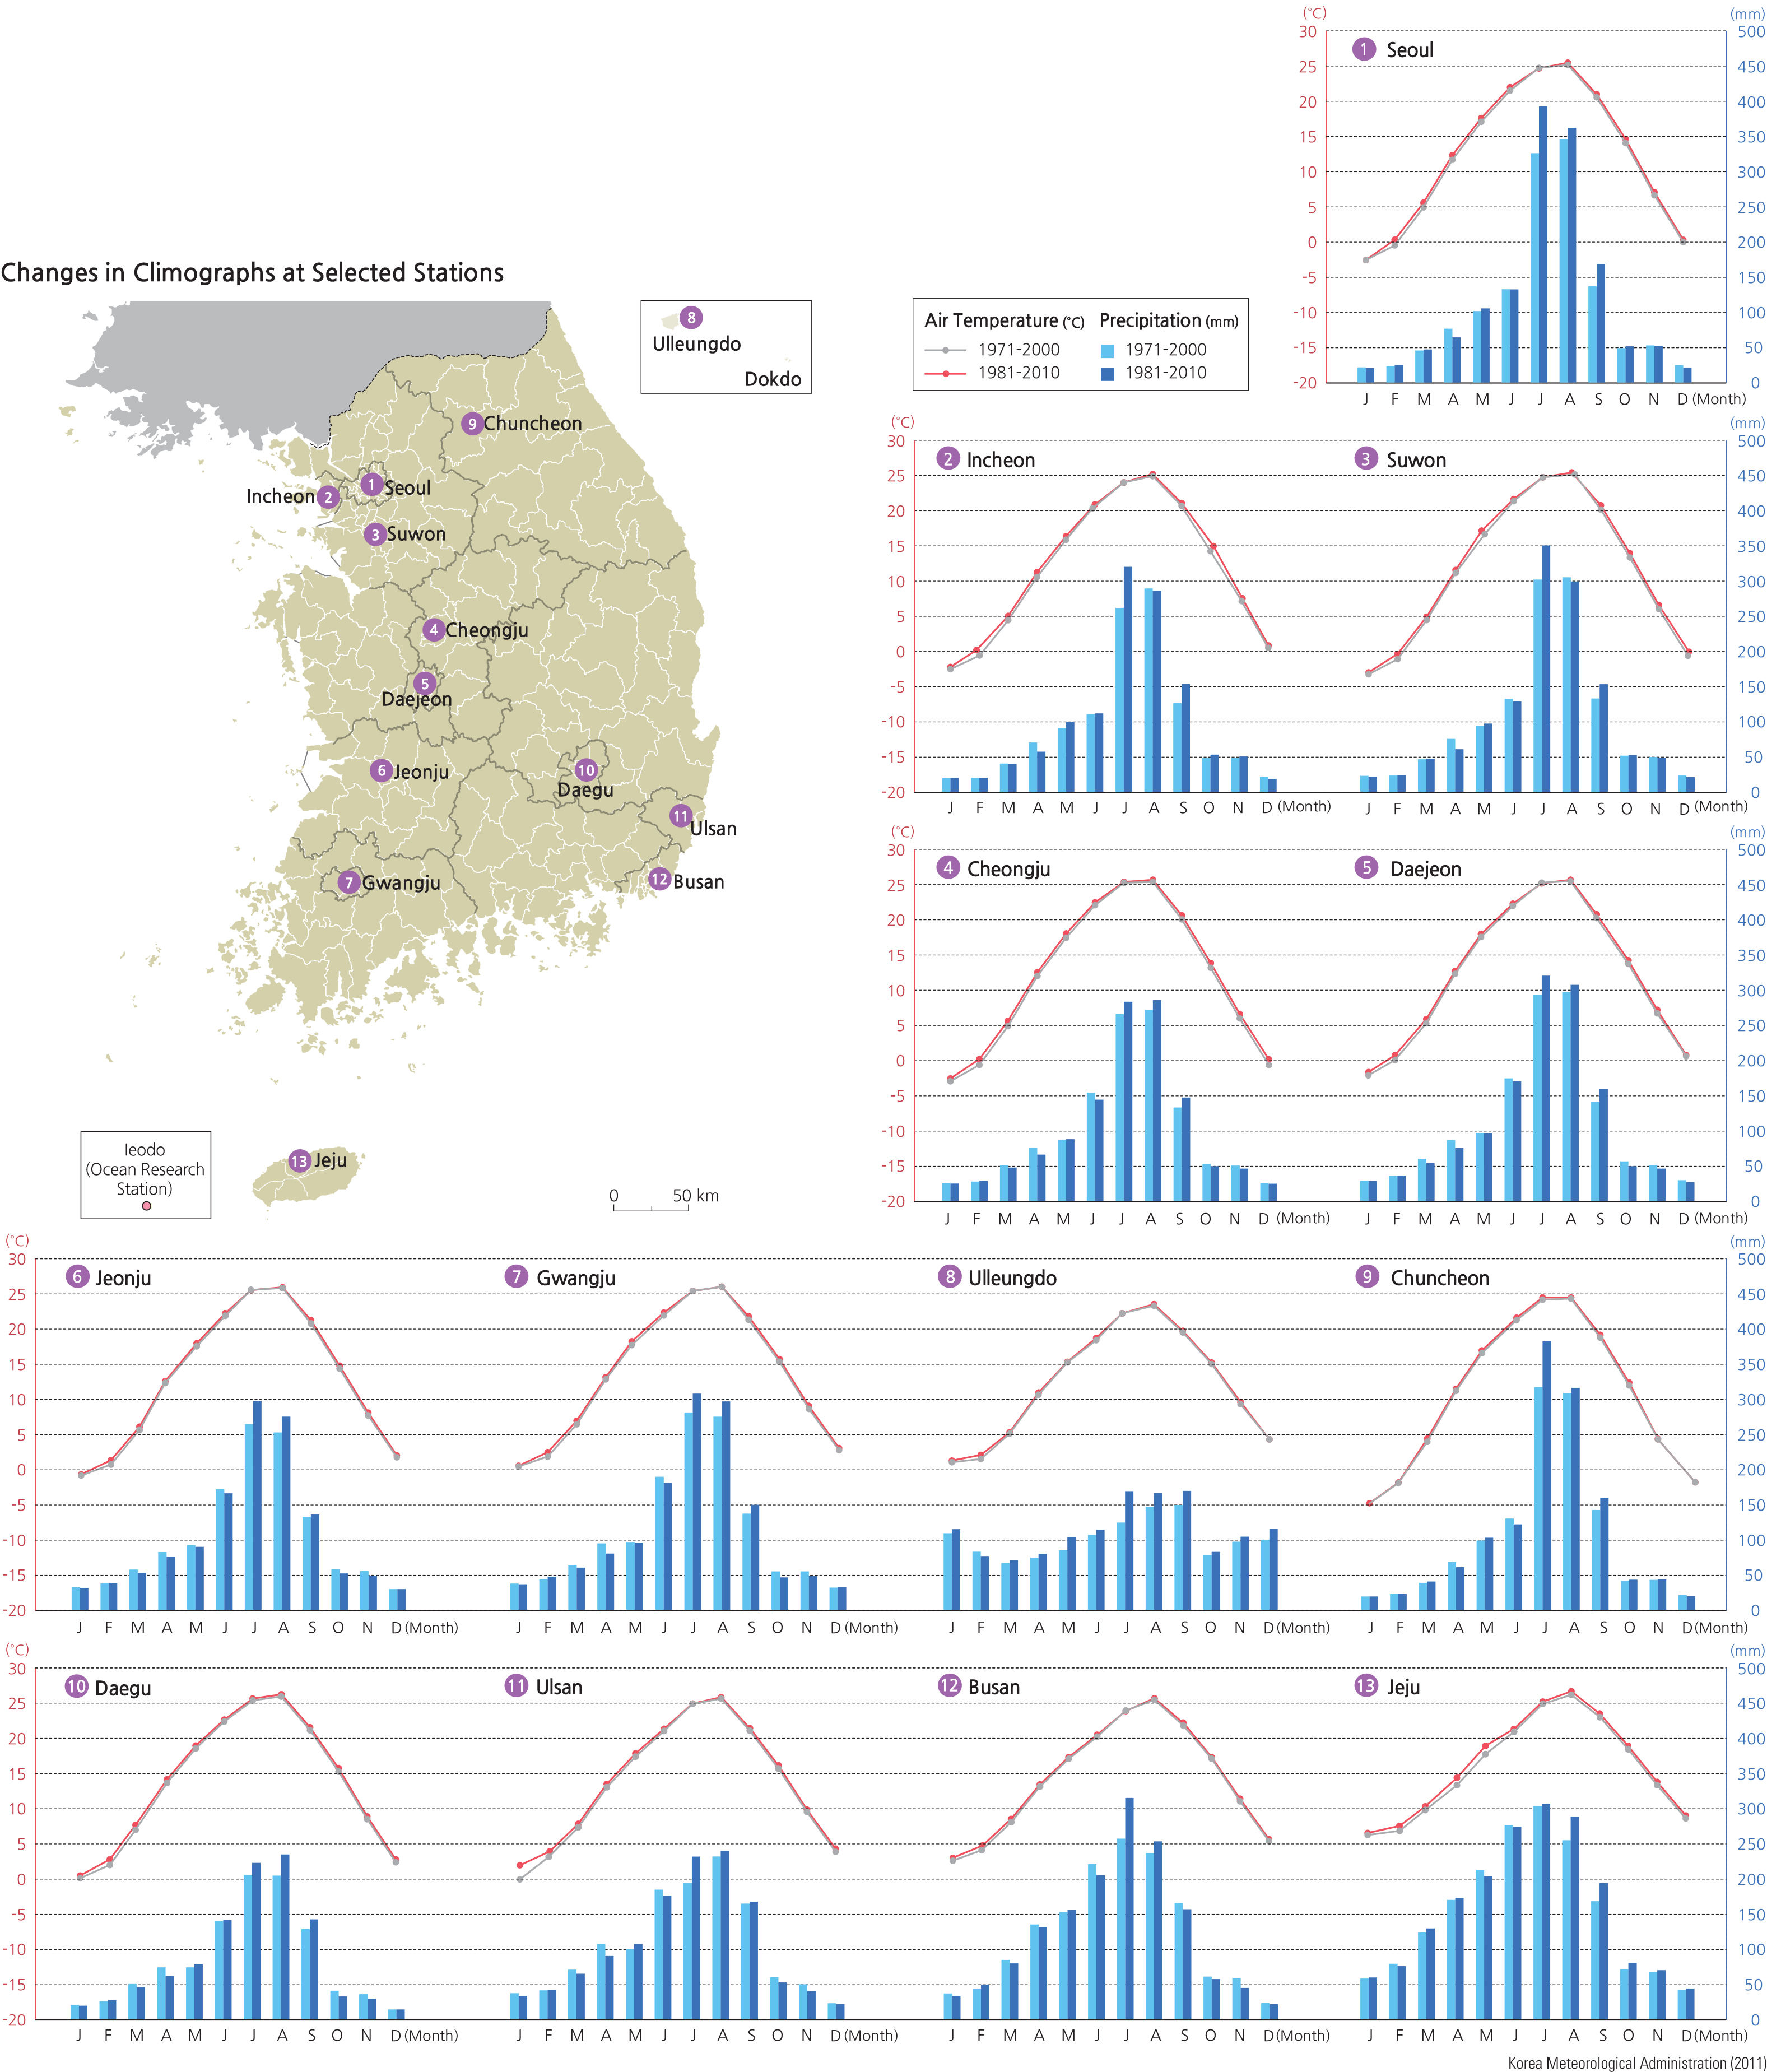
There has been an increasing trend in temperature over the past 30 years. According to the climographs, average monthly temperatures of the recent 30-year period between 1981 and 2010 are greater than the 30 year period between 1971 and 2000. With the exception of the month of July, most other months of the year recorded higher average temperatures.
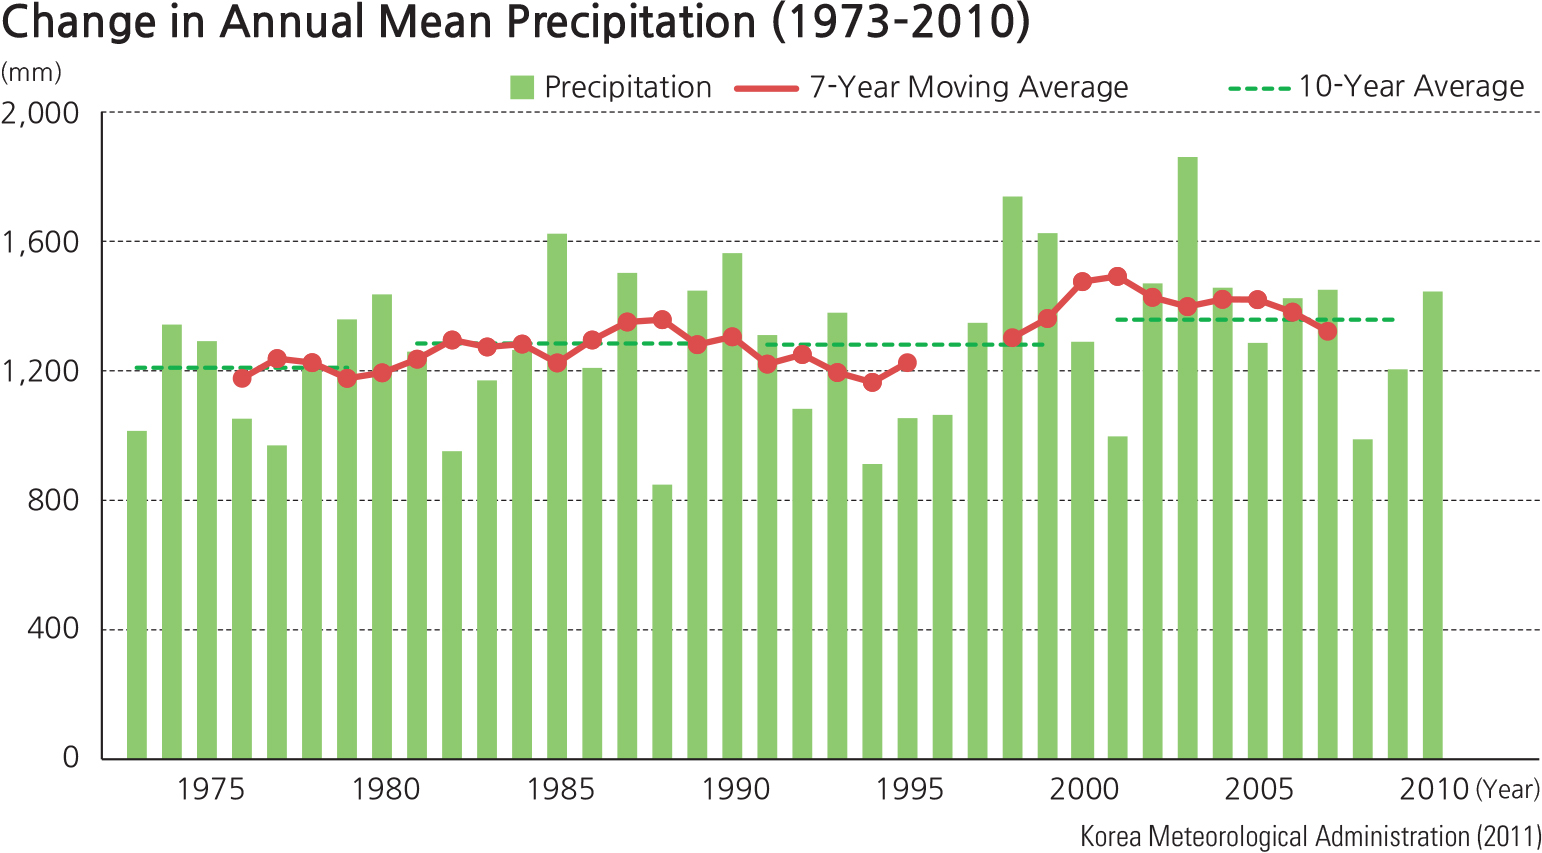
The annual precipitation of South Korea experienced a slight increase of 50 mm on average in the 30-year period of 1981–010. The annual precipitation recorded at 13 observation stations increased by about 3.9% on average compared to the past, while Ulleungdo experienced an 11% increase in precipitation. In most areas, summer precipitation has increased, while spring and autumn precipitation have decreased.
Brief Interpretation of the Map and Charts
The map shows the location of the weather stations. One may use it to associate location with characteristics of the climographs. Between 1971 and 2000, stations with both July and August precipitation over 300 mm are Seoul, Suwon, and Chuncheon, all of which are inland cities. Seoul has by far the highest July and August precipitation. For the period between 1981 and 2010, stations with both July
and August precipitation over 300 mm are Seoul, Suwon, Daejeon, and Chuncheon; once again all are located inland. Stations with only July precipitation over 300 mm are Incheon, Gwangju, Busan, Jeju, and Gwangju; of these four cities, only Gwangju is an inland city.
Comparing the light blue bars (1971–000) with the dark blue bars (1981–010) in the climographs reveals that precipitation has increased in all summer months in all thirteen stations, while winter months remain relatively equal during the 1981–010 period.
Can you suggest a reason why inland cities have a higher precipitation in general? Size and elevation of an island influences its climate. Study the climographs for Jeju and Ulleungdo. They are both far offshore islands, but Ulleungdo has a much milder climate with less precipitation that is more even distributed monthly. Can you suggest a reason why?
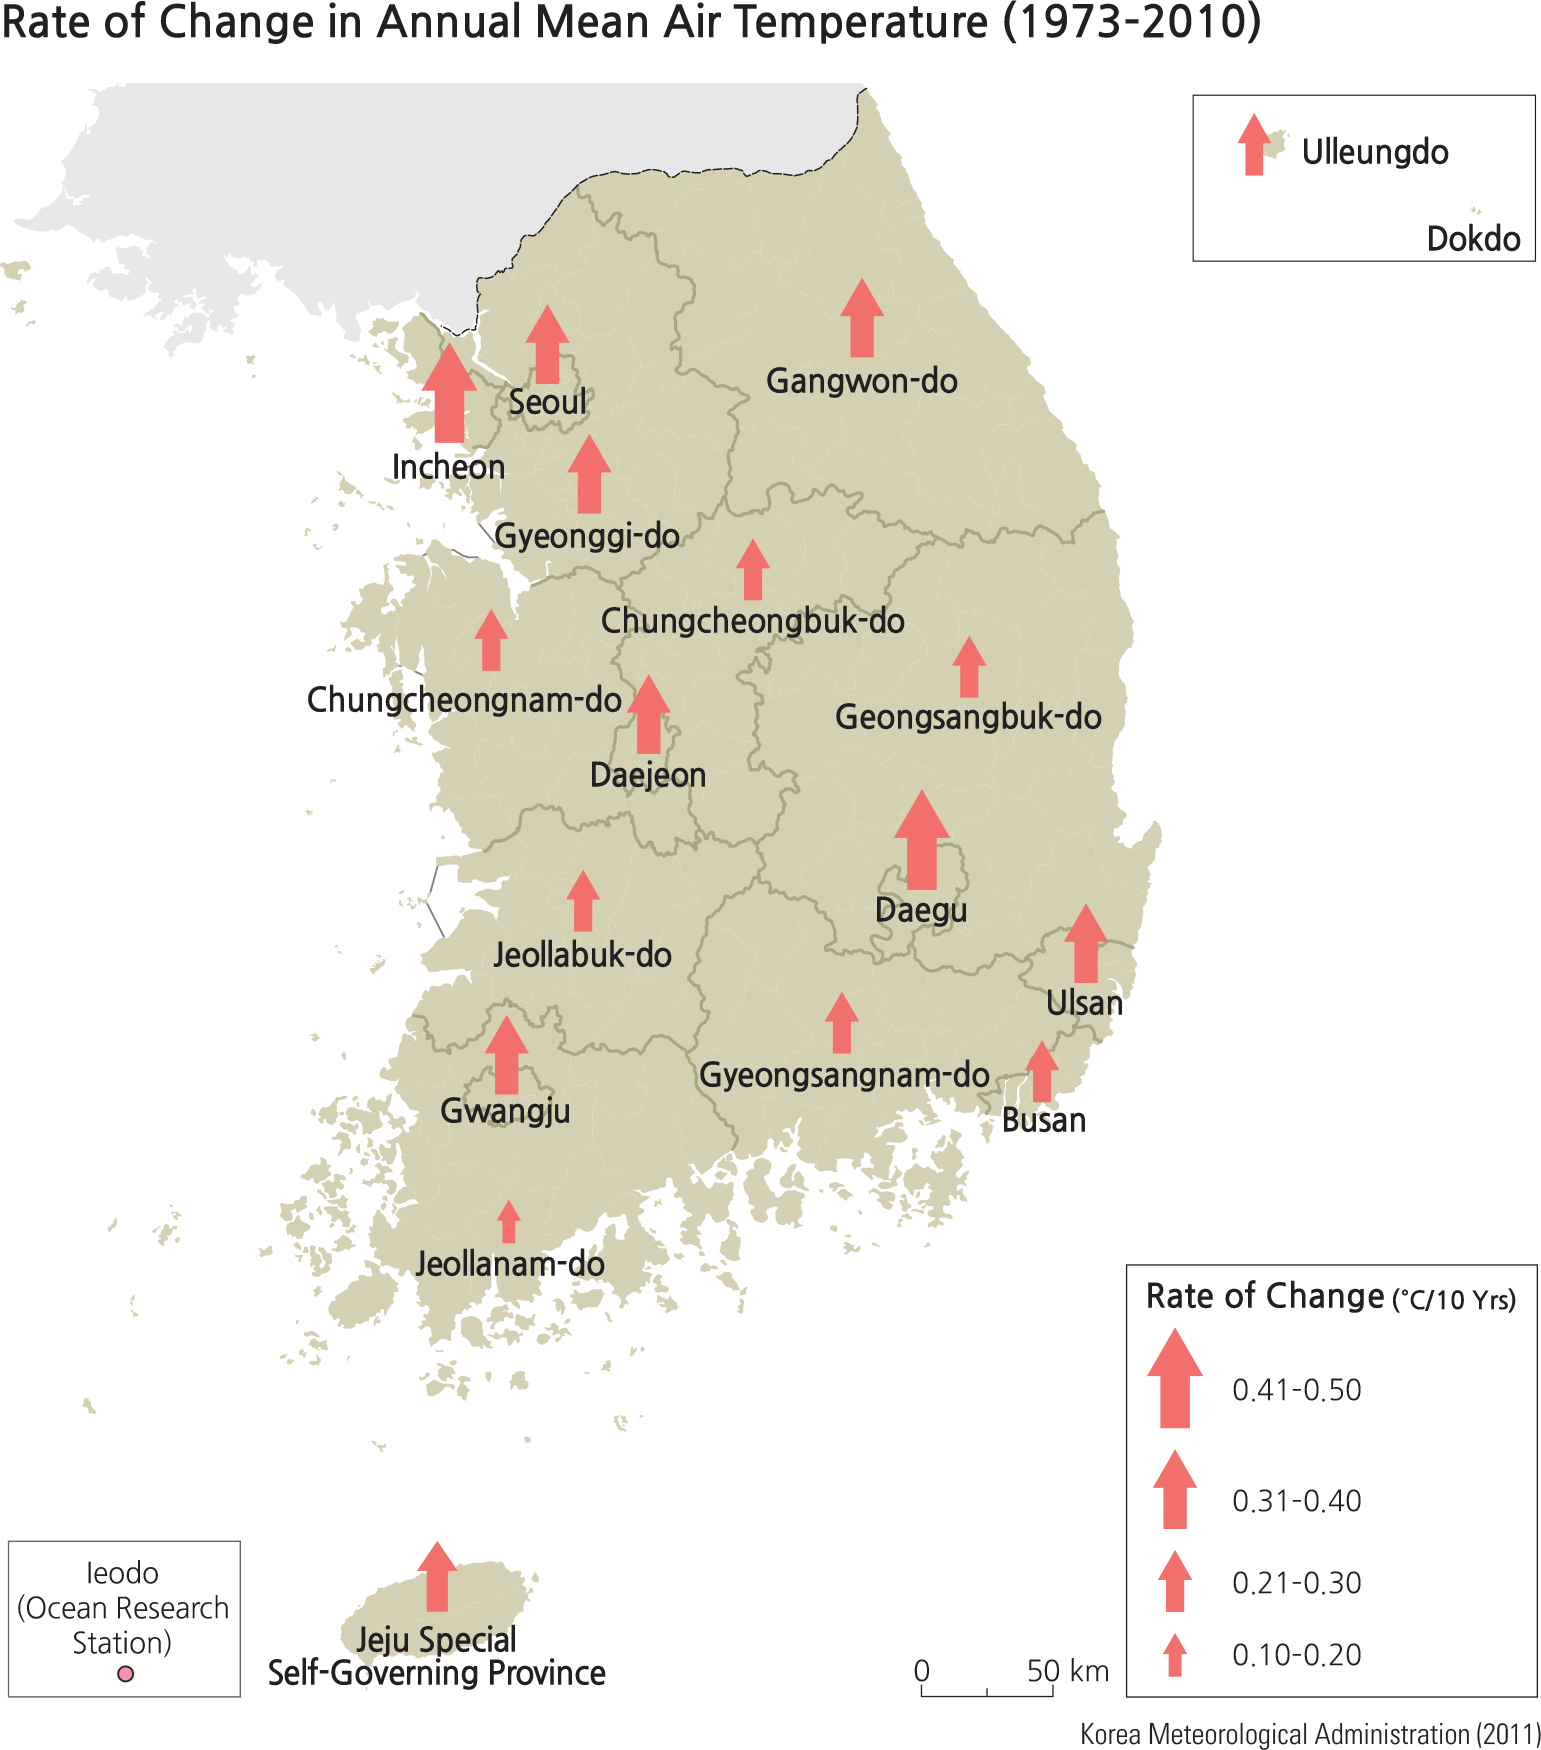
The rate of change in annual mean temperature at 0.27˚/10 years clearly shows a warming trend in Korea. On average, all the areas except Mungyeong have experienced a rise in annual mean temperature between 0.09˚ and 0.57˚ for every 10 years. Cheongju and Suwon have experienced the greatest increase in temperature for the most recent 10-year period. Also, the annual mean temperature increases at a greater rate in metropolitan areas than the national average rate of change. The highest rate of change in annual mean temperature occurs in Daegu and Incheon (0.46˚/10 years). Winters (0.53˚/10 years) have experienced the greatest increase in air temperature, while summers (0.1˚/10 yrs) have experienced the lowest temperature increase, but nonetheless significant increases.
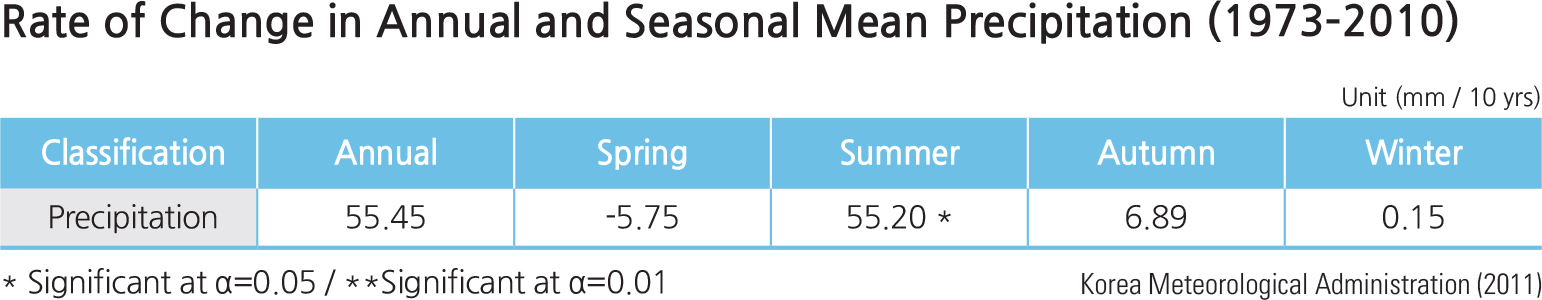
The rate of change in annual precipitation, 55.45 mm/10 years, represents an increasing trend in most areas. Seoul has seen the biggest increasing rate of precipitation at 147.16 mm/10 years while Goheung has experienced a changing rate at -18.95 mm/10 years. Throughout all seasons, the summer has the highest rate of change (55.2mm/10 years) and this trend is analogous to that of annual precipitation. However, the rate of change in annual precipitation is quite low throughout the year except the summer. Also, the concentration ratio of precipitation in the summer has increased as a response to reduced rainfall in other seasons across large parts of the Peninsula.
Brief Interpretation of the Maps
For both maps, each arrow symbol represents the cumulative mean data for that particular area. For instance, the arrow that represents Gangwon-do Province show the collective mean of data collected from 24 weather stations in mainland Gangwon-do Province plus 8 stations in Ulleungdo and Dokdo. Likewise for Seoul, Incheon, and Gyeonggi-do Province, or any other province, the arrows also represent cumulative means of several respective stations within their domains.
The map for the rate of change in annual mean air temperature (1973–010) indicates a strong confirmation of the rise in temperature within these 37 years. It is not a short-term weather increase but a definitive long-term warming trend. The size of the arrows gauges at levels of a range between 0.1 and 0.5 degree Centigrade per ten years. Although the numbers may appear small, the climatic effects on the biosphere can be tremendous. Cumulative through decades, the effects can become devastating. They can change the distribution of vegetation, alter seasonal rainfall patterns and intensity, and affect our daily lives.
The map on the rate of change in annual mean precipitation (1973-2010) shows both significant (solid arrows) and insignificant (open arrows) changes in precipitation. The pattern here is very clear: in the northern third of South Korea, precipitation increase is significant, while in the southern two-thirds of the nation, it is not. The reasons for this interesting and definitive pattern should be open to investigation as to why such a pattern occurs.
The smallest annual mean air temperature increase as symbolized by the smallest red arrow is found in Jeollanam-do. On a map from page 124 of The National Atlas of Korea Volume 2 that shows the distribution of weather stations, it is obvious that most of the stations in this southwestern province are located along the coast; only one or two are located inland. How does the distribution of weather stations affect the data they collect? Are the majority of coastal stations truly representative of Jeollanam-do Province? If there were more inland stations, would they change the annual mean temperature data?
Projection of the 21st Century Air Temperature and Precipitation over the Korean Peninsula under RCP Scenarios
The information portrayed on the maps and graphs associated with this section are an attempt to glimpse into the future. These views are based upon different scientists’ interpretation of hundreds of data sets developed worldwide for many years. Their models are not definitive predictions but ideas on what may happen to the climatic environment if different elements of the physical, social, and political world come together over the next 80 years. The projections are based on scenarios produced by an international group of specialists who have developed four different models. These scenarios are termed Representative Concentration Pathways (RCPs). Briefly these RCPs are probable trajectories of changes of the world environment. These changes may happen if different conditions of atmospheric warming at the upper boundary of the troposphere are fulfilled. The models are of climatic conditions and are tied to alternate patterns of radiative forcing (atmospheric warming) resulting from the emission of greenhouse gases.
The baseline value or starting point for the atmosphere warming used in RCPs is the radiative forcing assumed at the top of the troposphere. Each of the RCPs is based on a different pattern of the radiative forcing that considers socioeconomic conditions, measured atmosphere conditions, and the projected control of gaseous emissions. The number associated with each RCP is the projected watts/square meter in 2100.
RCP 2.6 assumes that the forcing level will rise to 3.1 in mid-century and decline until 2100.
RCP 4.5 assumes that the forcing level will be stabilized at 4.6 by 2100 and remain stationary after that.
RCP 6.0 assumes that the forcing level will be stabilized shortly after 2100 and be maintained at that level.
RCP 8.5 assumes that the forcing level will continue to increase with increasing gaseous emission levels.
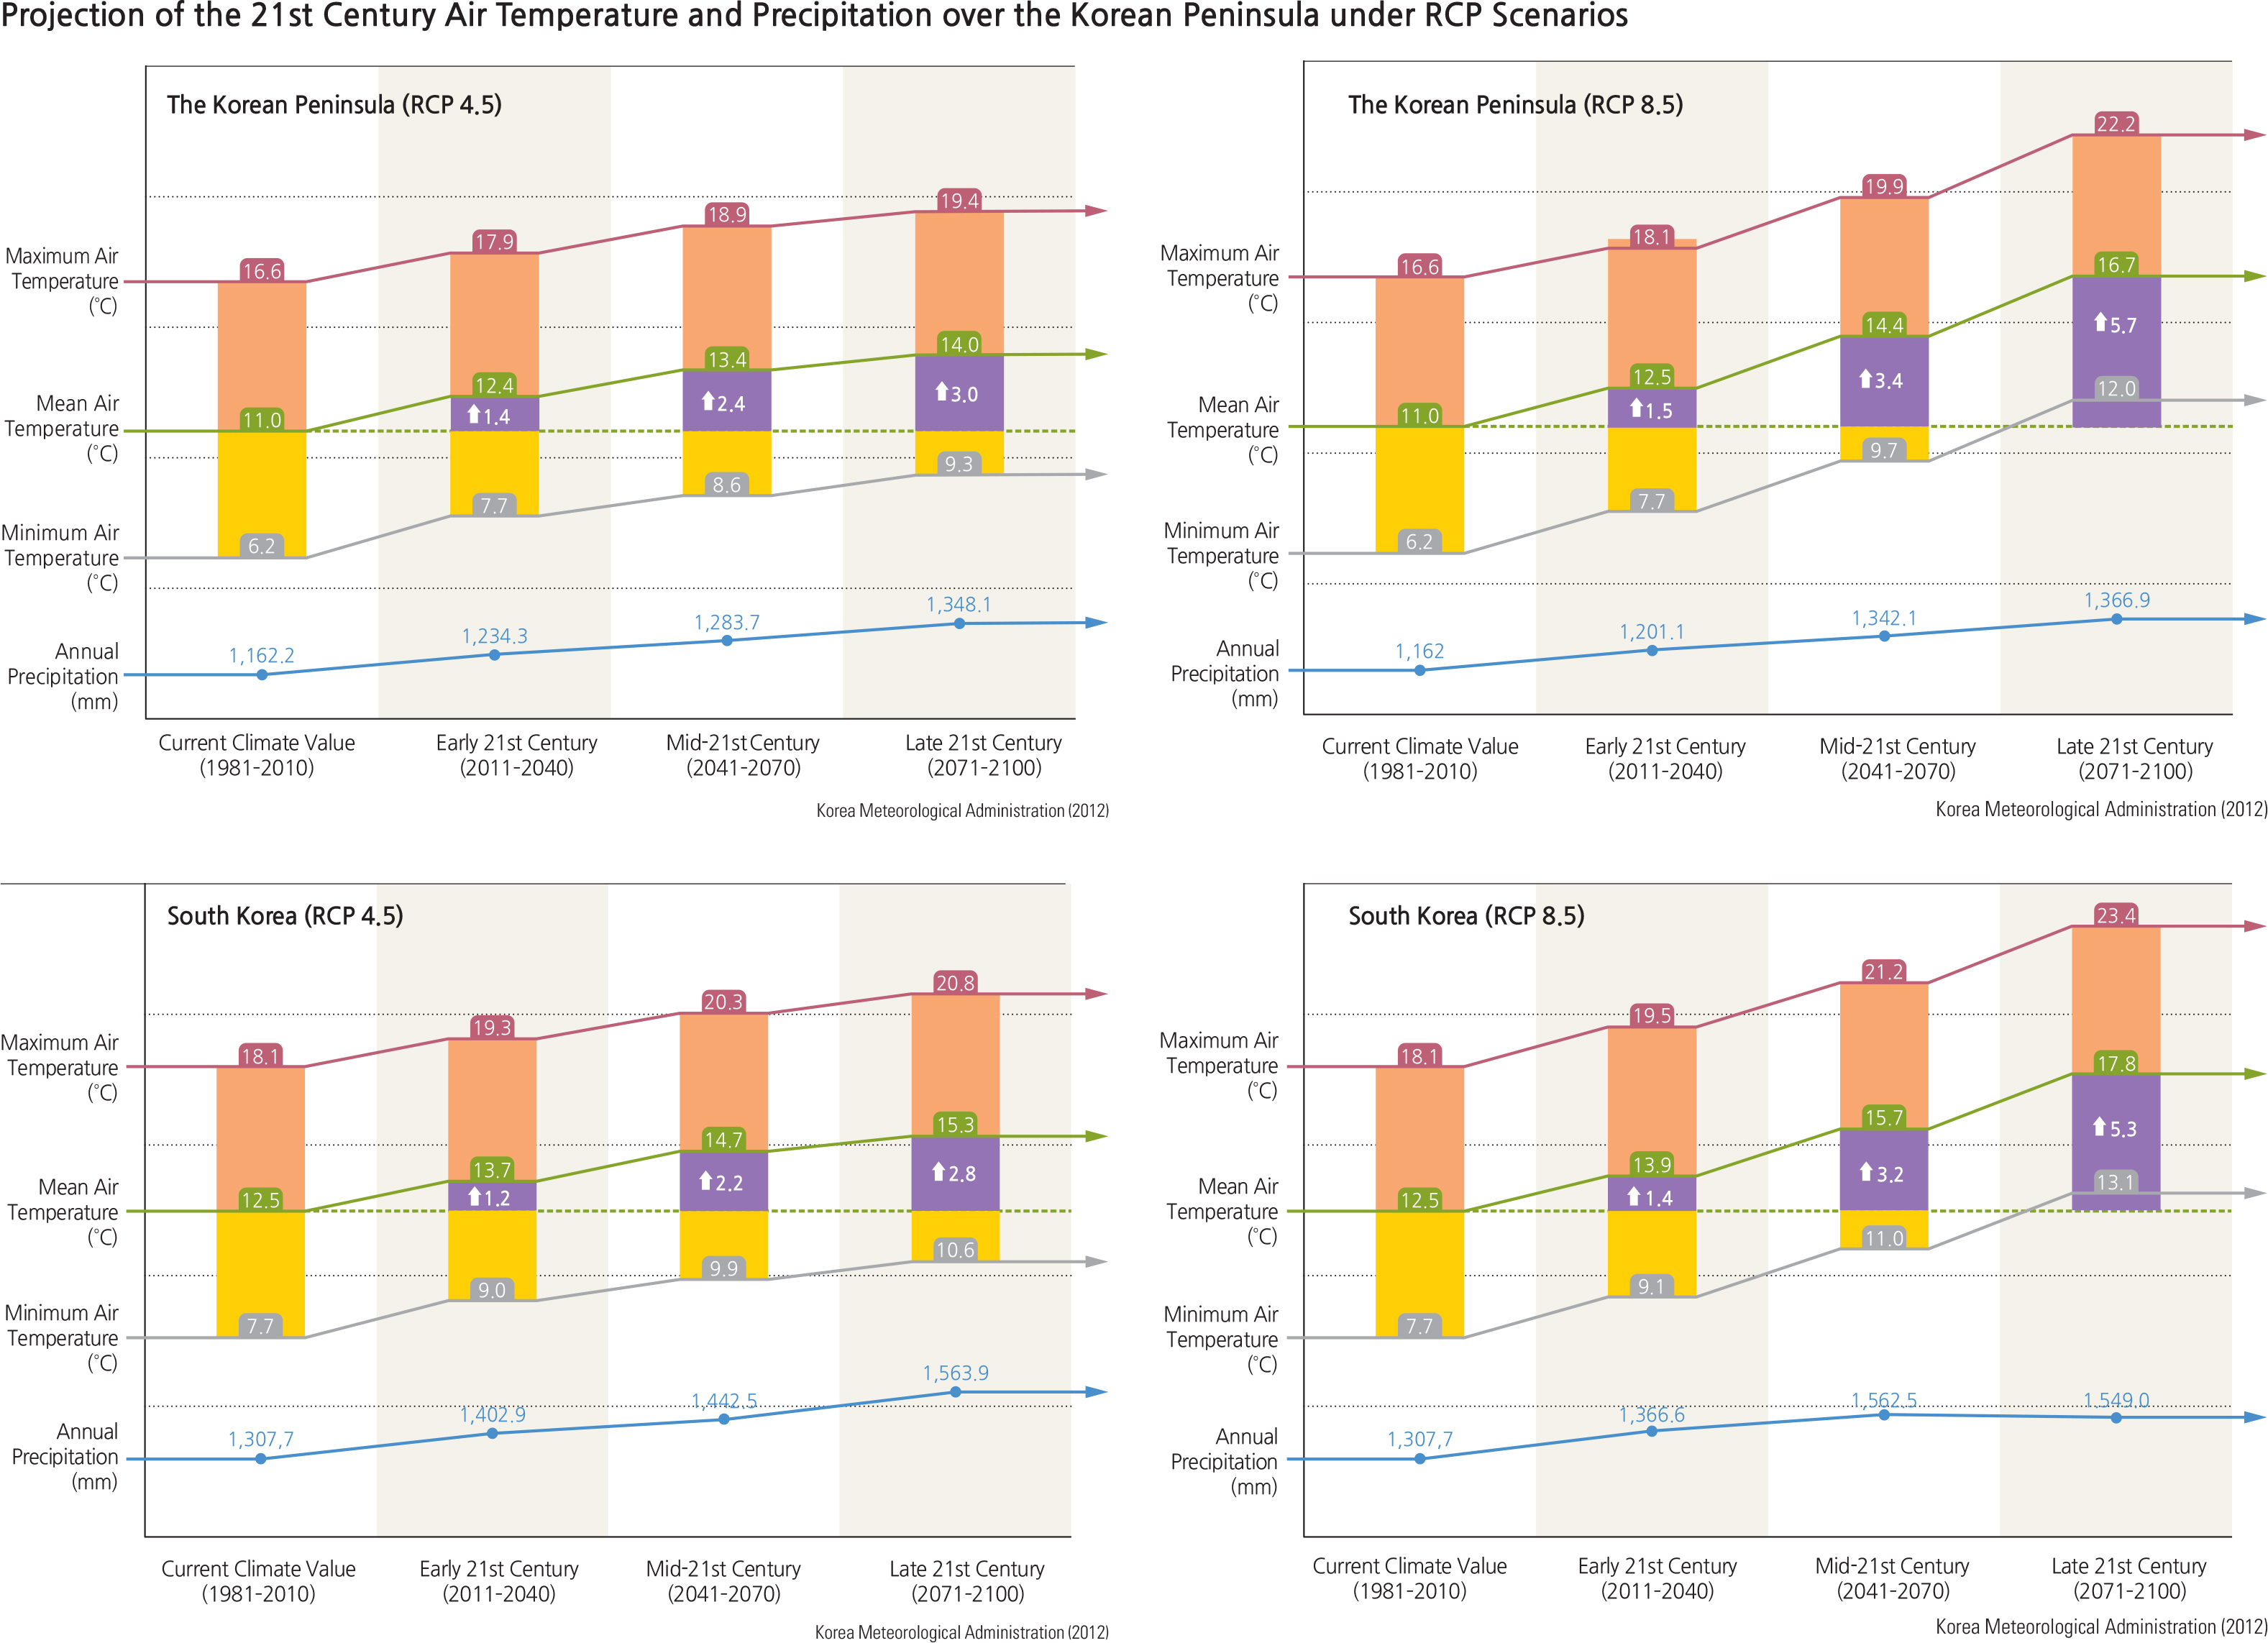
The annual mean temperature of the Korean Peninsula is expected to rise steadily throughout the 21st century. In the Representative Concentration Pathways (RCP) 4.5 scenario, the increasing trend projected from the 1981-2010 mean temperature of 11˚C to the early 21st century (2011-2040) is similar to that in the RCP 8.5 scenario. However, the increasing rate is expected to slow down during the mid-21st century (2041–2070). The annual mean temperature in the late 21st century is projected to be 14.0˚C in the RCP 4.5 scenario, corresponding to the 1981-2010 average temperature in the southeastern coastal region. According to the RCP 8.5 scenario, the magnitude of the increase in annual mean temperature becomes greater after the early 21st century. The annual mean temperature in the
late 21st century is projected to be 16.7˚C, corresponding to the 1981-2010 average temperature in the southernmost tip of Jejudo.
The annual mean maximum and minimum temperatures are expected to increase constantly. Based on the RCP 4.5 scenario, the increasing rates of the maximum and minimum temperatures are projected to decrease during the mid-21st century and beyond. Since the magnitude of the increase in the daily maximum temperature is smaller than that in the daily minimum temperature, the daily temperature range is projected to decrease gradually. The RCP 8.5 scenario indicates that the increasing trends for the maximum and minimum temperatures accelerate toward the late 21st century.
The annual precipitation is projected to rise until the late 21st century. The RCP 4.5 scenario expects the annual precipitation in the late 21st century to be 1,348.1 mm, while the RCP 8.5 scenario predicts it to be 1,366.9 mm. The annual mean temperature in South Korea is projected to continue to increase along with the increasing trend for annual mean temperature of the entire Peninsula. The RCP 4.5 scenario predicts the increasing trend in the early 21st century will have a rate similar to that of the RCP 8.5 scenario, but it will slow down over time. The annual mean temperature in the late 21st century is predicted to be 15.3˚C, corresponding to the 1981-2010 value of Jejudo. According to the RCP 8.5 scenario, the increasing trend for temperature accelerates from the mid-21st century to the late 21st century. In the scenario, the annual mean temperature in the late 21st century is projected to be 17.8˚C, which exceeds the 1981-2010 annual mean temperature of Seogwipo (16.6˚C). The annual mean maximum and minimum temperatures are also expected to increase steadily until the late 21st century. In the late 21st century, the increasing trend for the minimum temperature is slightly greater than that for the maximum temperature for the same period based on the RCP 4.5 and RCP 8.5 scenarios.
Annual mean precipitations in the late 21st century projected in the RCP 4.5 and RCP 8.5 scenarios are 1,563.9 mm and 1,549.0 mm, respectively, which correspond to the 1981-2020 mean amount for the southern coastal region of the Peninsula. Although the RCP 4.5 scenario shows a greater increasing rate in the annual mean precipitation during the early 21st century than the RCP 8.5 scenario, the increasing trend for precipitation appears to be low for the beginning of the mid-21st century. However, during the mid-21st century, the magnitude of the increase in annual mean precipitation becomes greater once again, resulting in the average amount predicted in the RCP 4.5 model to exceed that predicted in the RCP 8.5 scenario.
Based on the RCP 8.5 scenario, the early 21st century begins with a small increase in annual mean precipitation. Then, the annual mean precipitation appears to increase largely right after the early 21st century. However, the increasing trend for precipitation slightly decreases during the mid-21st century.
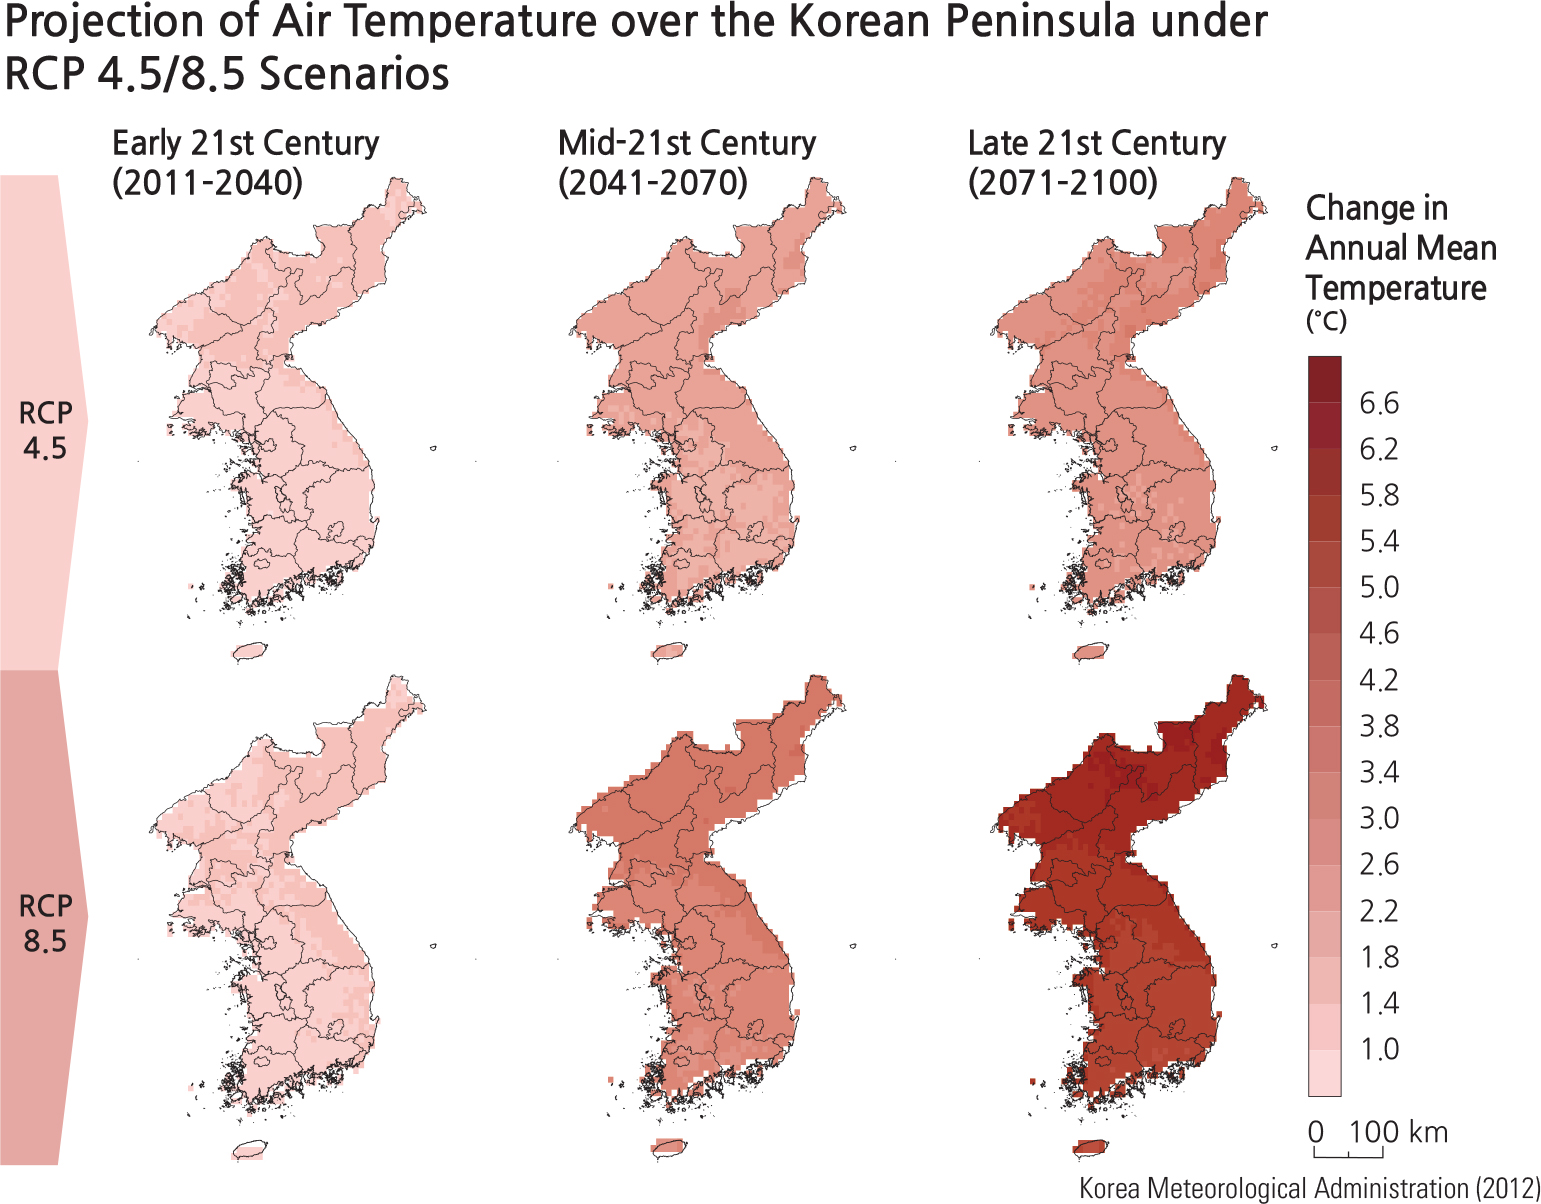
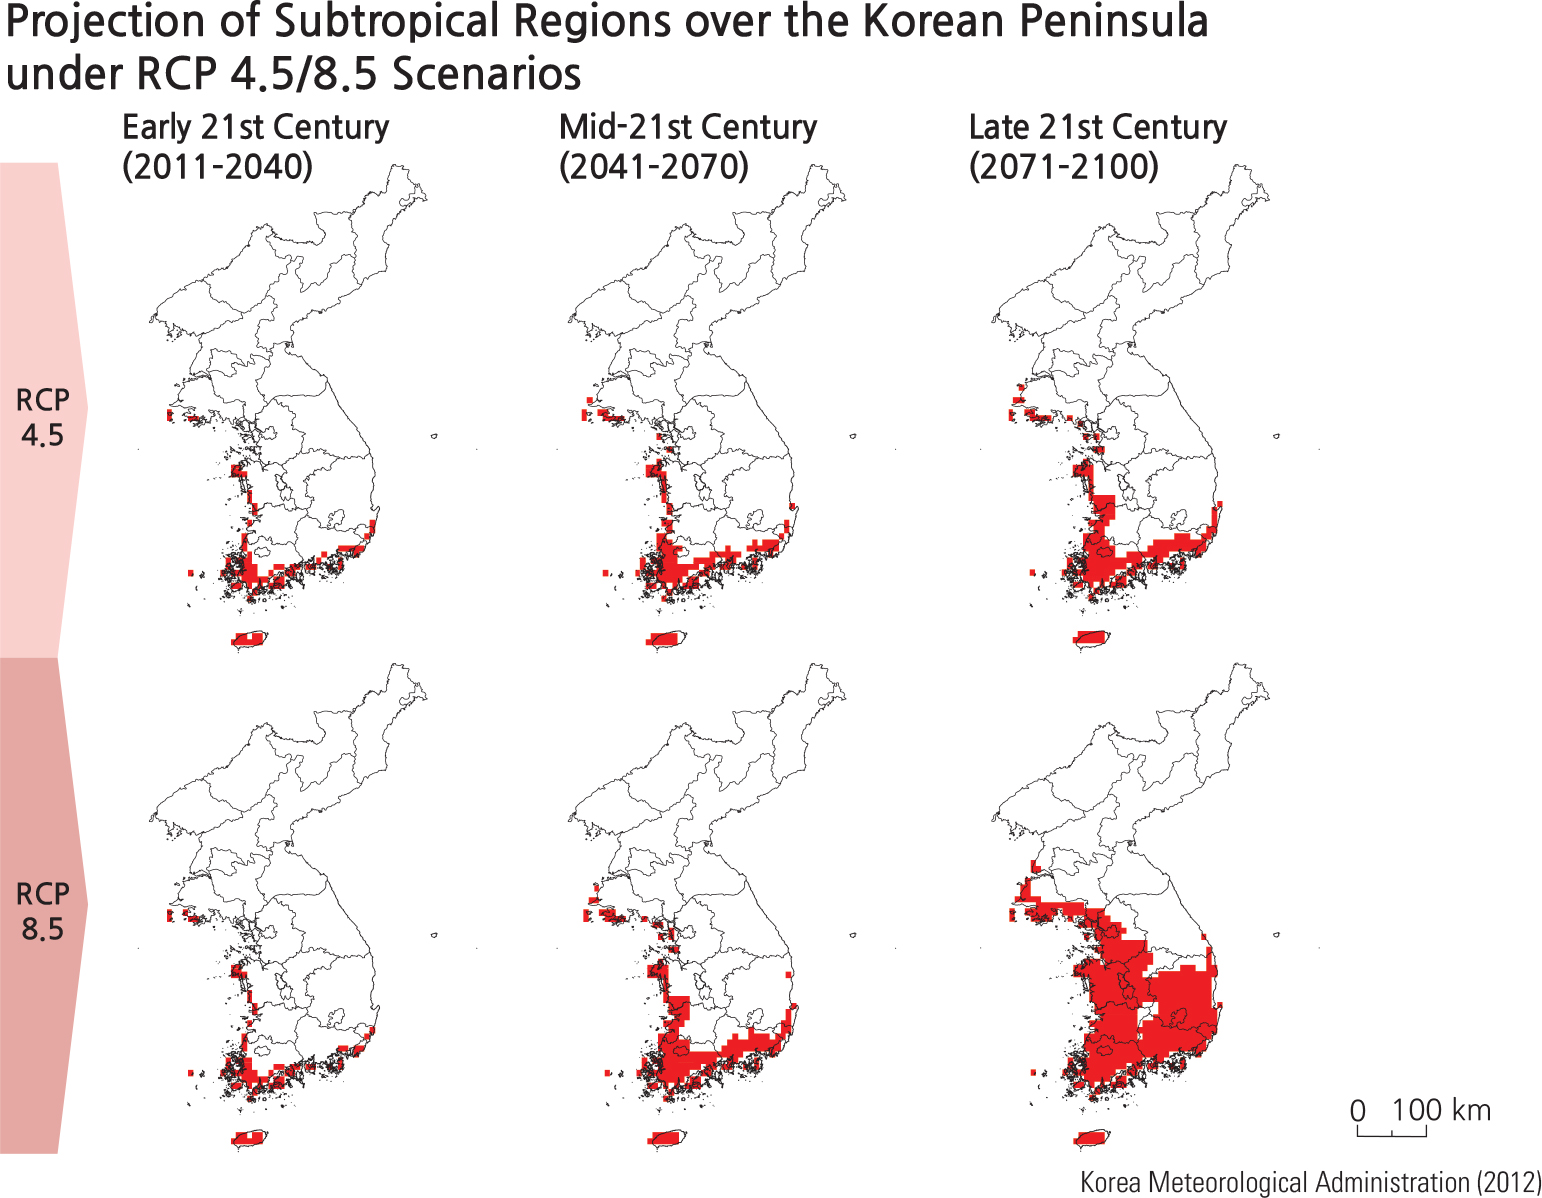
Using the Trewartha climate classification, the southern coast of the Korean Peninsula, including Jejudo, is classified as a humid subtropical climate region. As global warming accelerates, the boundary of the subtropical climate region is projected to move gradually to the north. With the RCP 4.5 scenario for the late 21st century, Jeollanam-do, Jeollabuk-do, the west coast of Chungcheongnam-do, the west coast of Gyeonggi-do, and Gyeongsangnam-do are expected to become subtropical climate regions, while the RCP 8.5 scenario predicts most of South Korea, except the mountainous region, to be classified as subtropical climate regions in the late 21st century.
With global warming, the annual mean number of tropical nights is expected to increase, which can be attributed to the trend of increasing air temperature over the Korean Peninsula. According to the RCP 4.5 and 8.5 scenarios, the annual mean number of tropical nights in the late 21st century is expected to increase substantially. In the RCP 4.5 scenario, the annual mean number of tropical nights increases far more in South Korea than in North Korea from the mid-21st century to the late 21st century. However, from the RCP 8.5 scenario for the late 21st century, most areas of the Peninsula, except some major mountainous regions with
high elevation, will have a much greater annual number of tropical nights than during the 1981–010 period. After the late 21st century, as climate change becomes more intensified, it is anticipated that areas with tropical nights shall also expand to the high mountainous regions.
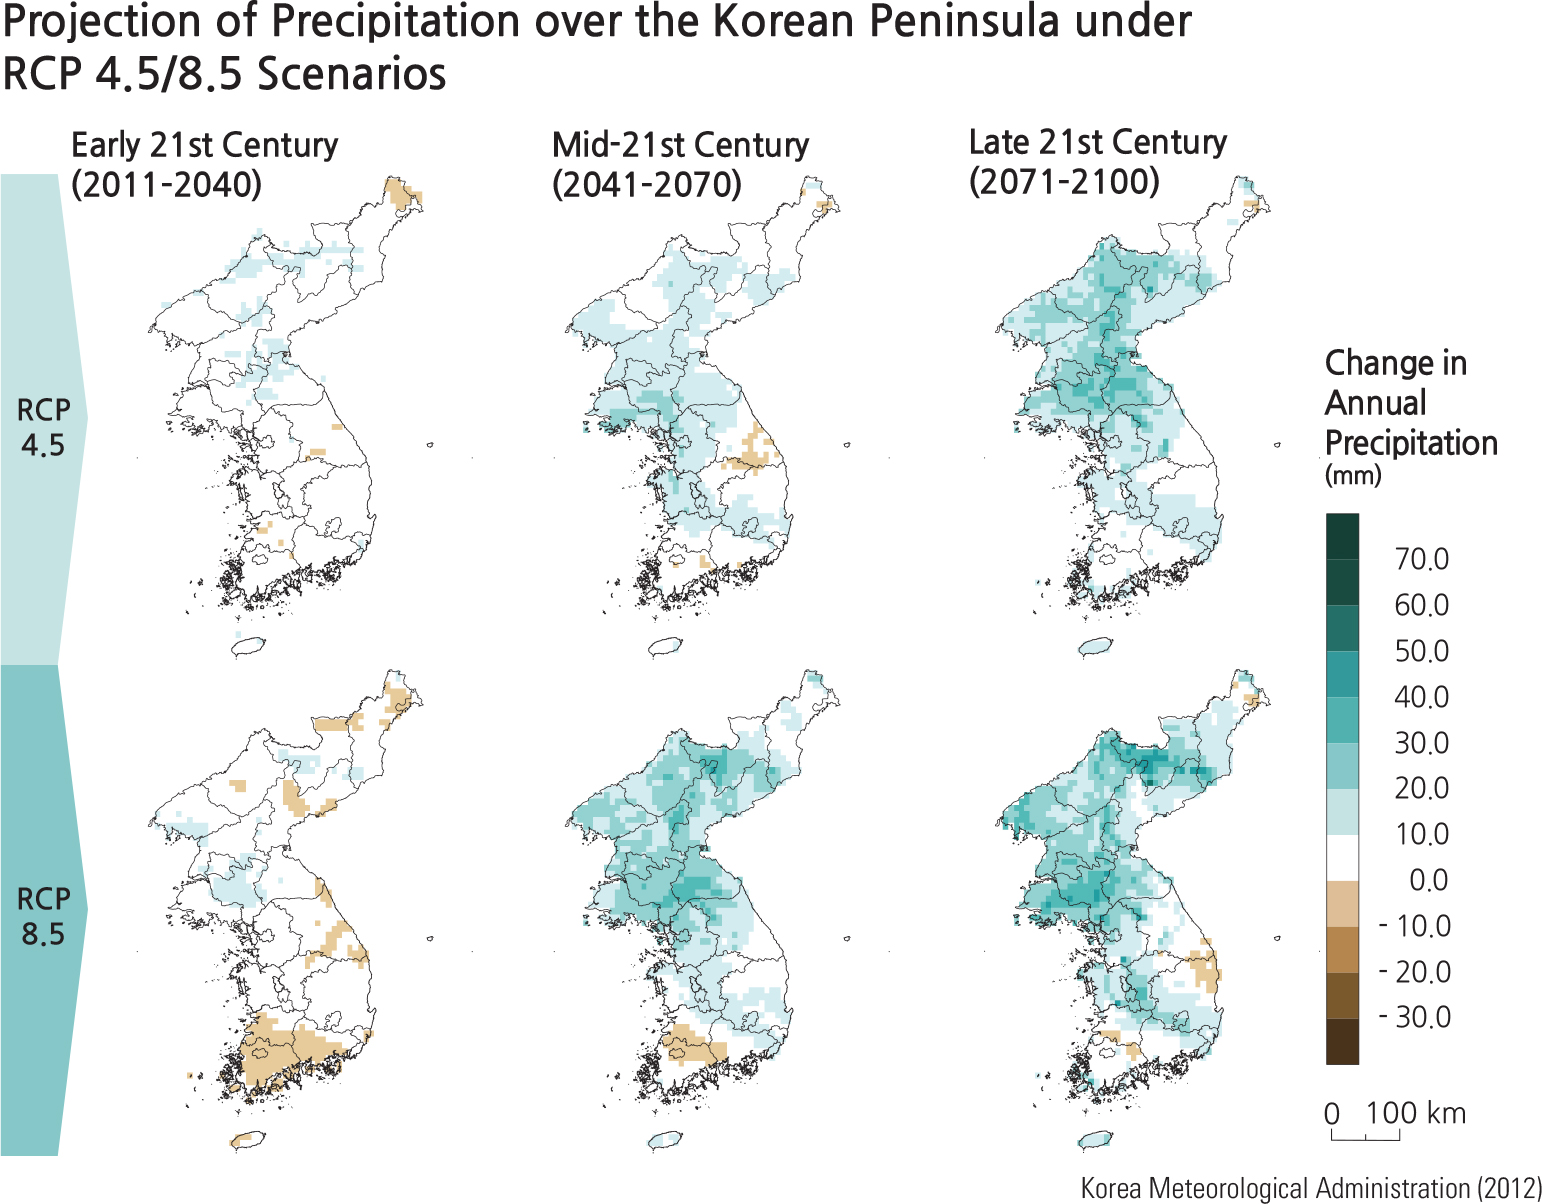
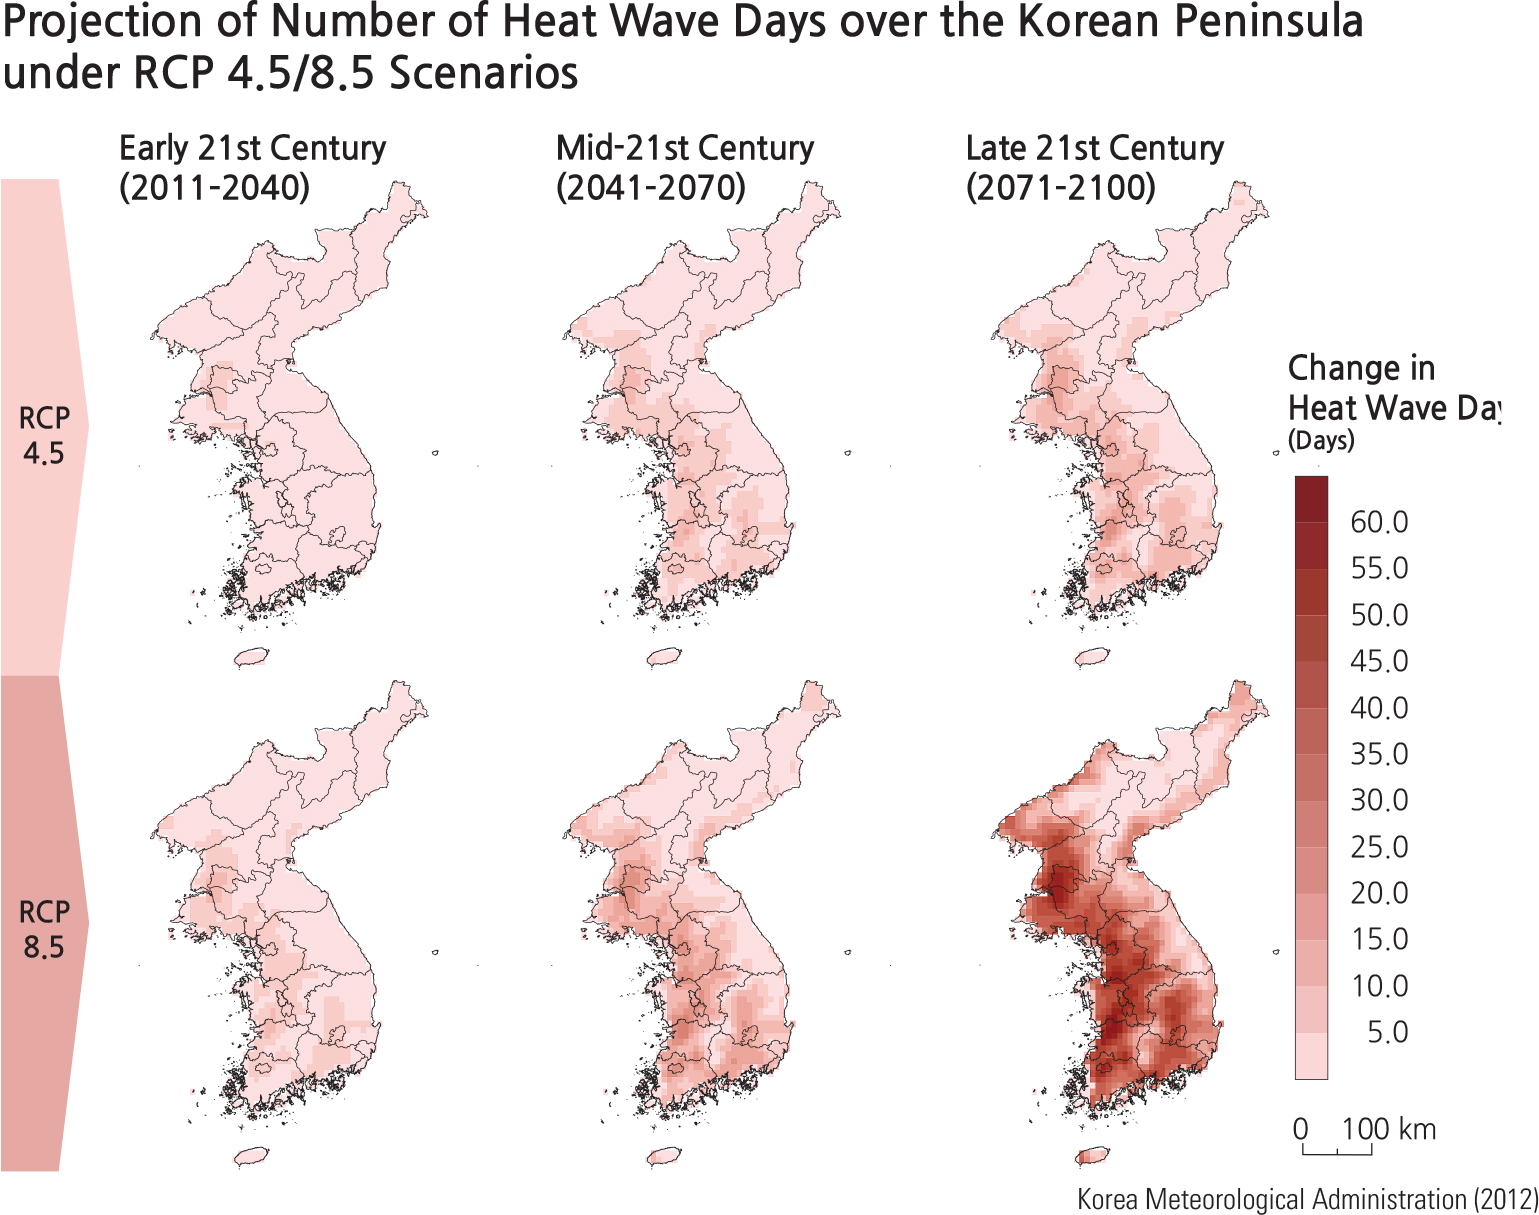
The RCP 4.5 and 8.5 scenarios predict that the annual mean number of heat wave days starts to increase in the lowlands. In the RCP 4.5 scenario, the Korean Peninsula is unlikely to see a large increase in the annual mean number of heat wave days; but in the RCP 8.5 scenario, the increasing trend for heat wave days is likely to accelerate. The number of heavy precipitation days is projected to increase in most parts of the Korean Peninsula with wide variations, depending on time, region, and scenario used.
Brief Interpretation of the Maps
The RPC 4.5 and 8.6 graphs of precipitation and temperature show a rise into the late 21st century; however, the precipitation increases at a slower rate. As would be expected the RCP 8.6, rate of temperature increase throughout the century shows a more rapid rise in temperature than the more conservative RCP 4.5. The geographic increases in temperature are evenly distributed while the increases for the sub-tropical region are concentrated in the south and west coast areas. The increase in heat wave days is concentrated in the lower west and central mountainous areas, extending (with minimum increases) to the east coast.
The increase in precipitation associated with the RCPs of 4.5 and 8.6 is located in the north central areas of the Peninsula. The projected increase in heavy precipitation is throughout Korea.
Given the coastal region expansion of sub-tropical regions, project the effect that these temperature changes would likely produce on agriculture crop composition and rates of agricultural production. The changing pattern of heavy precipitation events throughout the century shows a curious pattern later in the century—n general, the events are moving southward and toward the west coast. Can you think of how this change might affect the design of urban housing in the areas of heavier rain?
Marine Surveying
Marine surveying by domestic explorers began in the mid-1900s with the founding of the Department of Hydrography in the Operation Agency of Navy Headquarters (currently the Korea Hydrographic and Oceanographic Agency: KHOA). The Ocean Development Institute, affiliated with the Korea Institute of Science and Technology (currently the Korea Institute of Ocean Science and Technology: KIOST) was established in 1973 and introduced active ocean exploration and research. Today, extensive exploration and research continues to be carried out along the coastal region of the Korean Peninsula as well as in other regions such as the Arctic and Antarctic.
Marine surveying can be defined as the collection of oceanic data through various observation techniques to help develop an understanding of ocean characteristics and phenomena. It includes marine physical surveys, marine geological surveys, marine biological surveys, marine chemical surveys, and remote sensing data. Marine surveys are either carried out regularly or specifically for particular purposes.
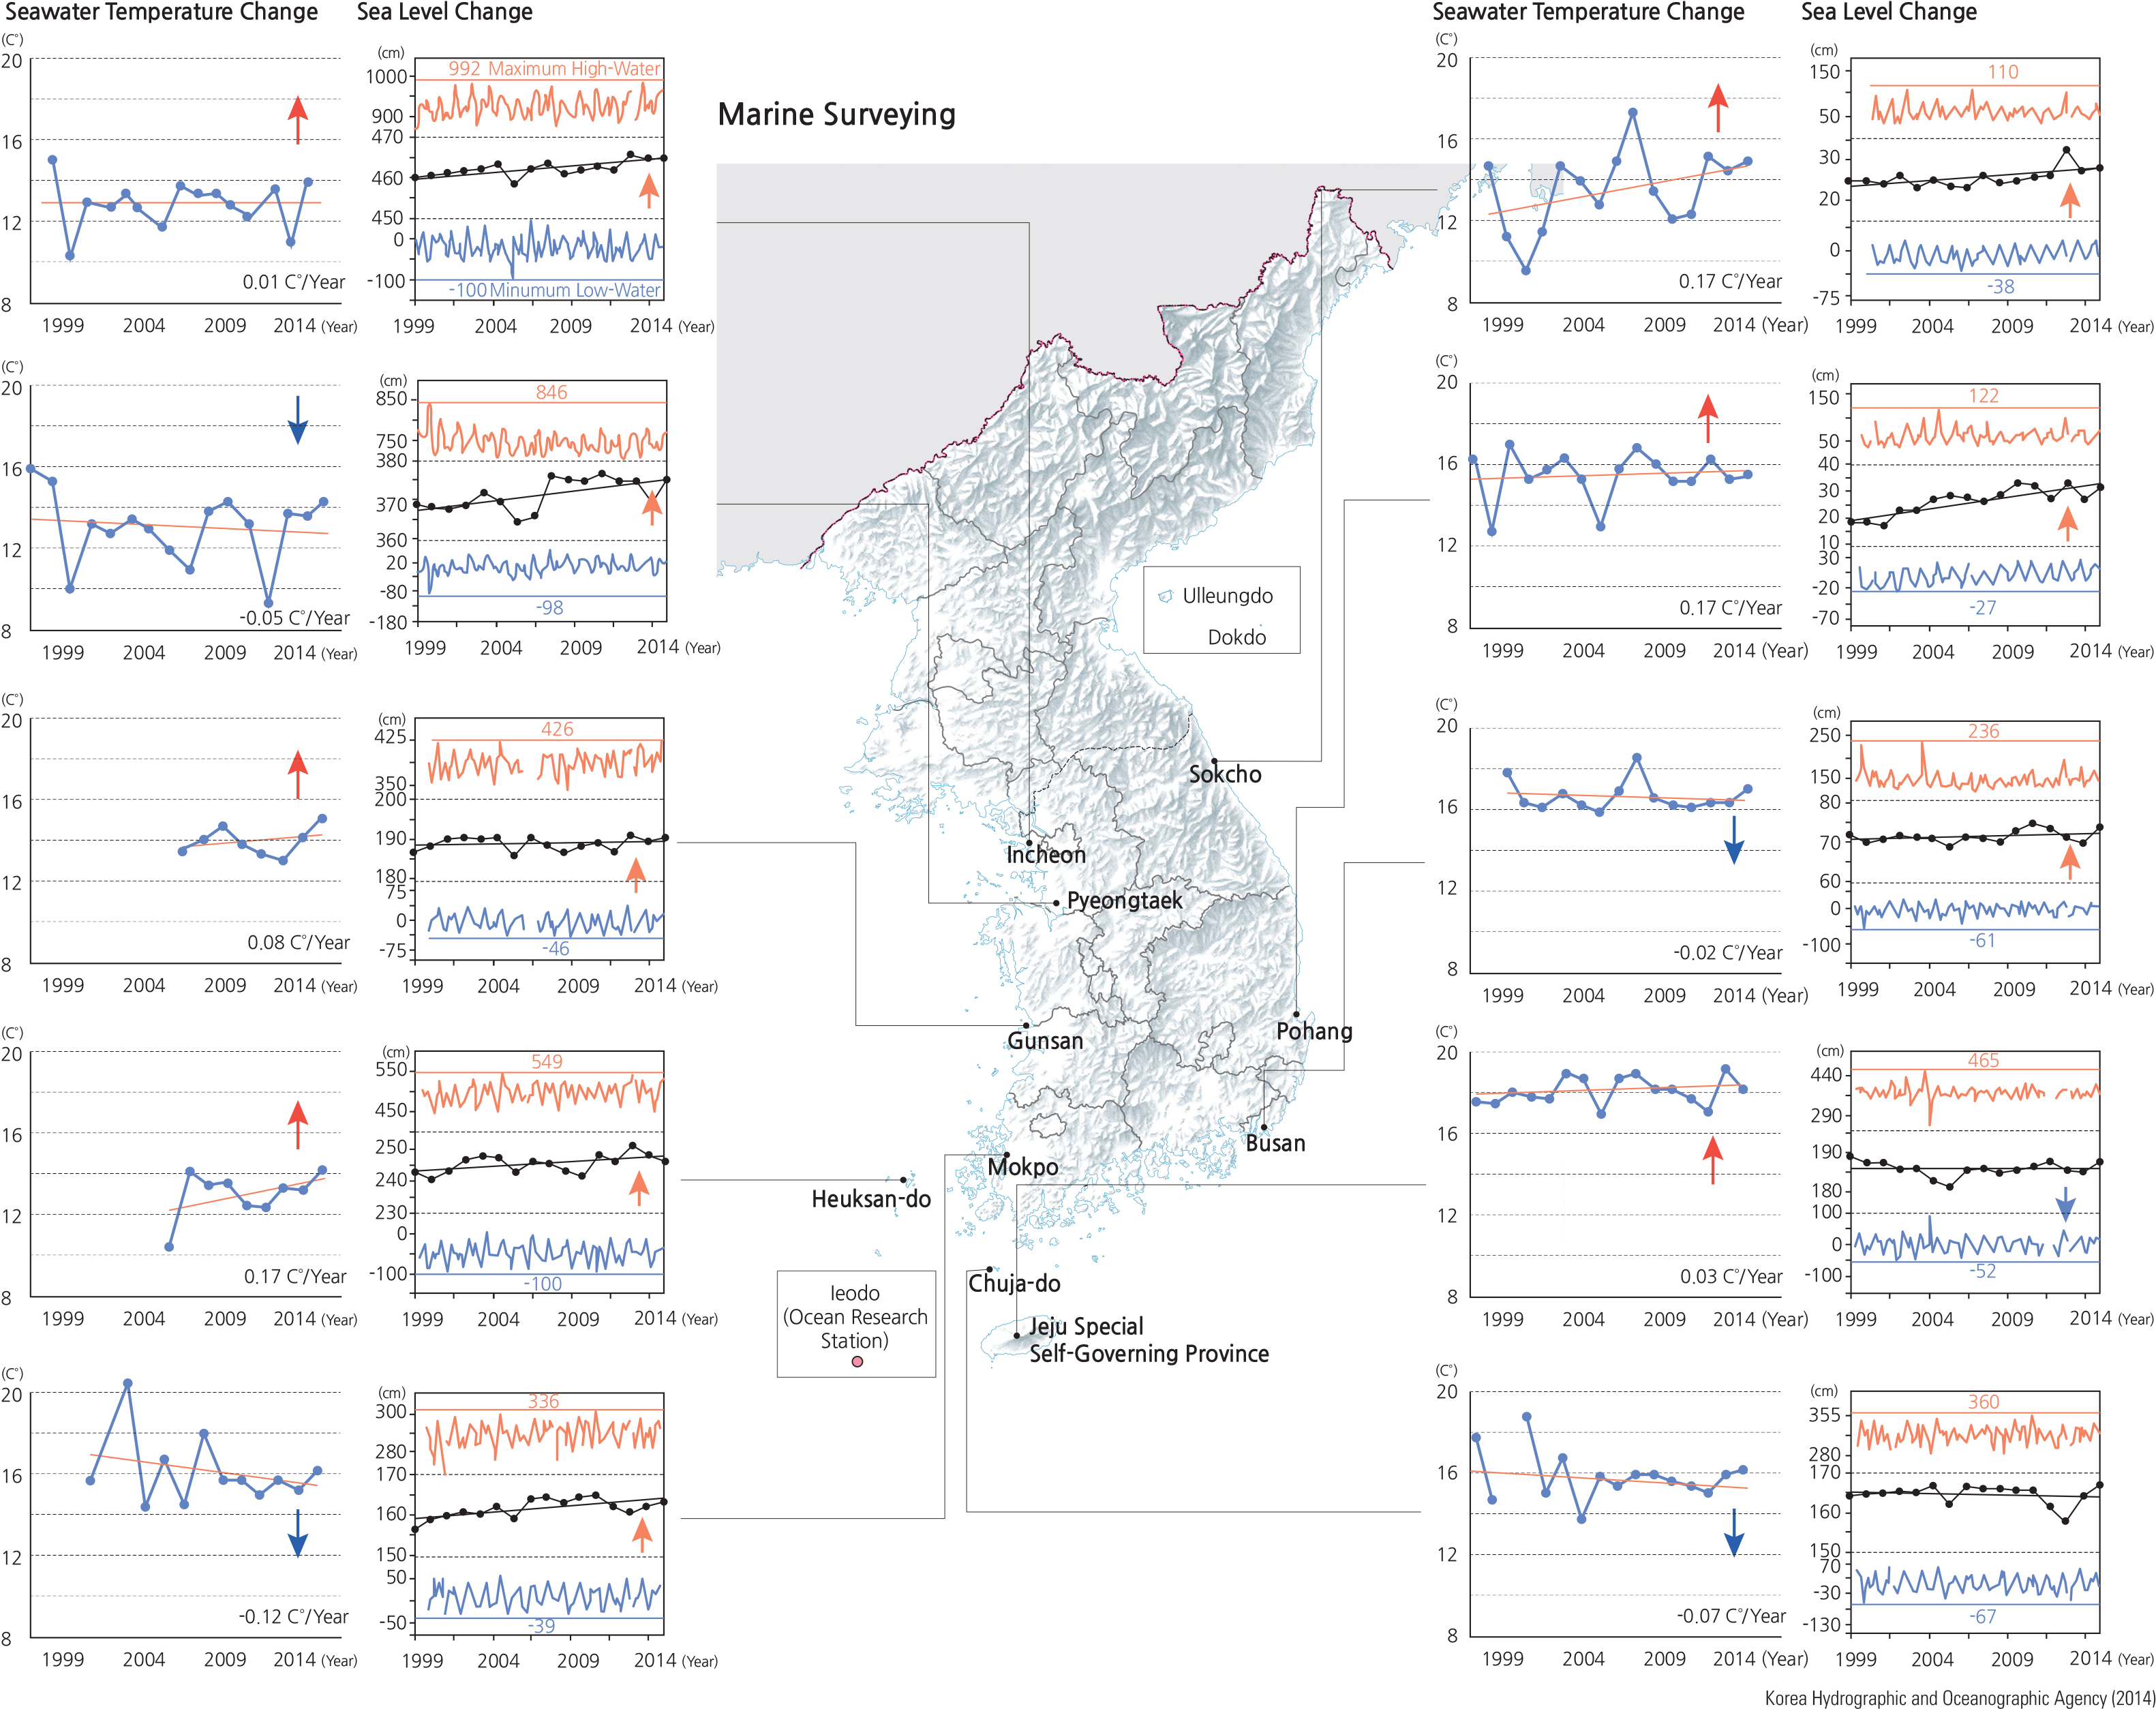
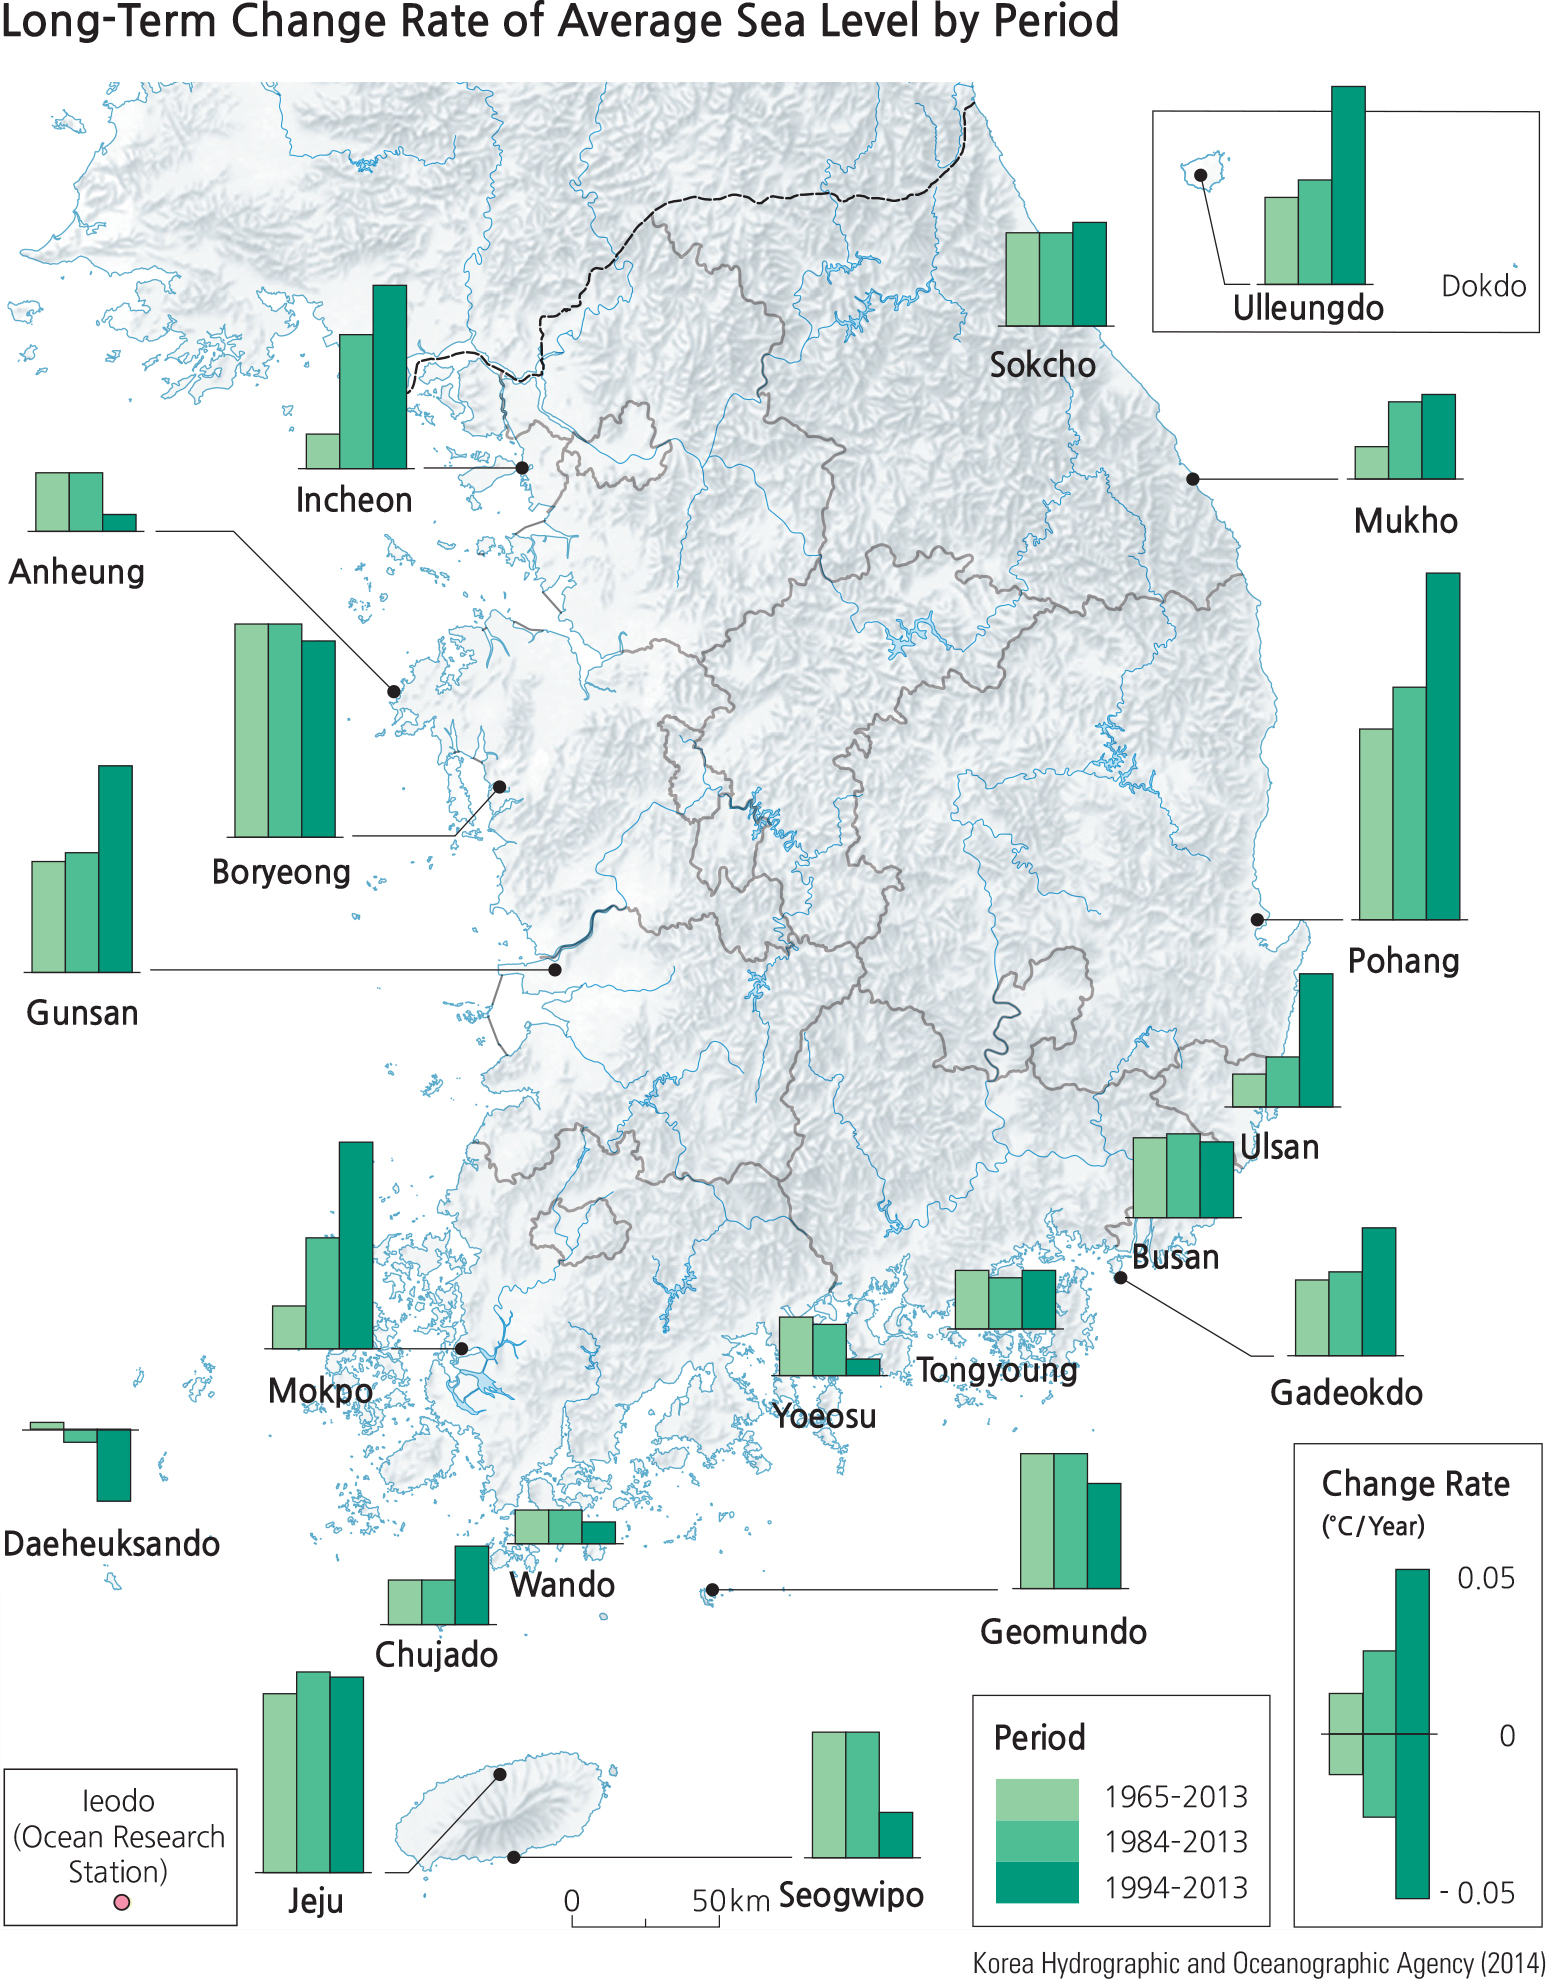
Data for sea level rise along Korean coasts are based on marine surveys. These surveys observe the physical properties of the ocean such as water temperature, salinity, waves, tides, inundation range, mean sea level fluctuations, and ocean currents.
Brief Interpretation of the Maps
Marine Survey data are detailed information determined over the 15 years from a variety of coastal sites in South Korea. Short-term stretches of data are always suspect in projecting long-term change. However, they are useful as starting points in environment analysis for baselines or monitoring special events. All the monitoring stations on the east and west coasts show a gradual increase in sea level rise in the range of 3 to 8 cm. These numbers are an average of the normal year-to-year fluctuations. The exceptions are the southerly island stations on Jeju and Chuja-do, which showed no or a small average decrease in sea level change. The measured temperature change of sea level was variable but exhibited a small average increase over the whole Peninsula.
When the length of the record is extended backward to the mid-1960s where data were available, the sea surface temperature showed a more variable pattern; also, the occurrence sea level rise was clearer, and the increase in sea level over the longer period showed the greatest increases in the last 15 years. Working from these years alone, how long would one project it to take for the average sea level rise to double at the ongoing rate? Can you think of any environmental process that might reverse this trend in rate of increase?
Sea Level Rise
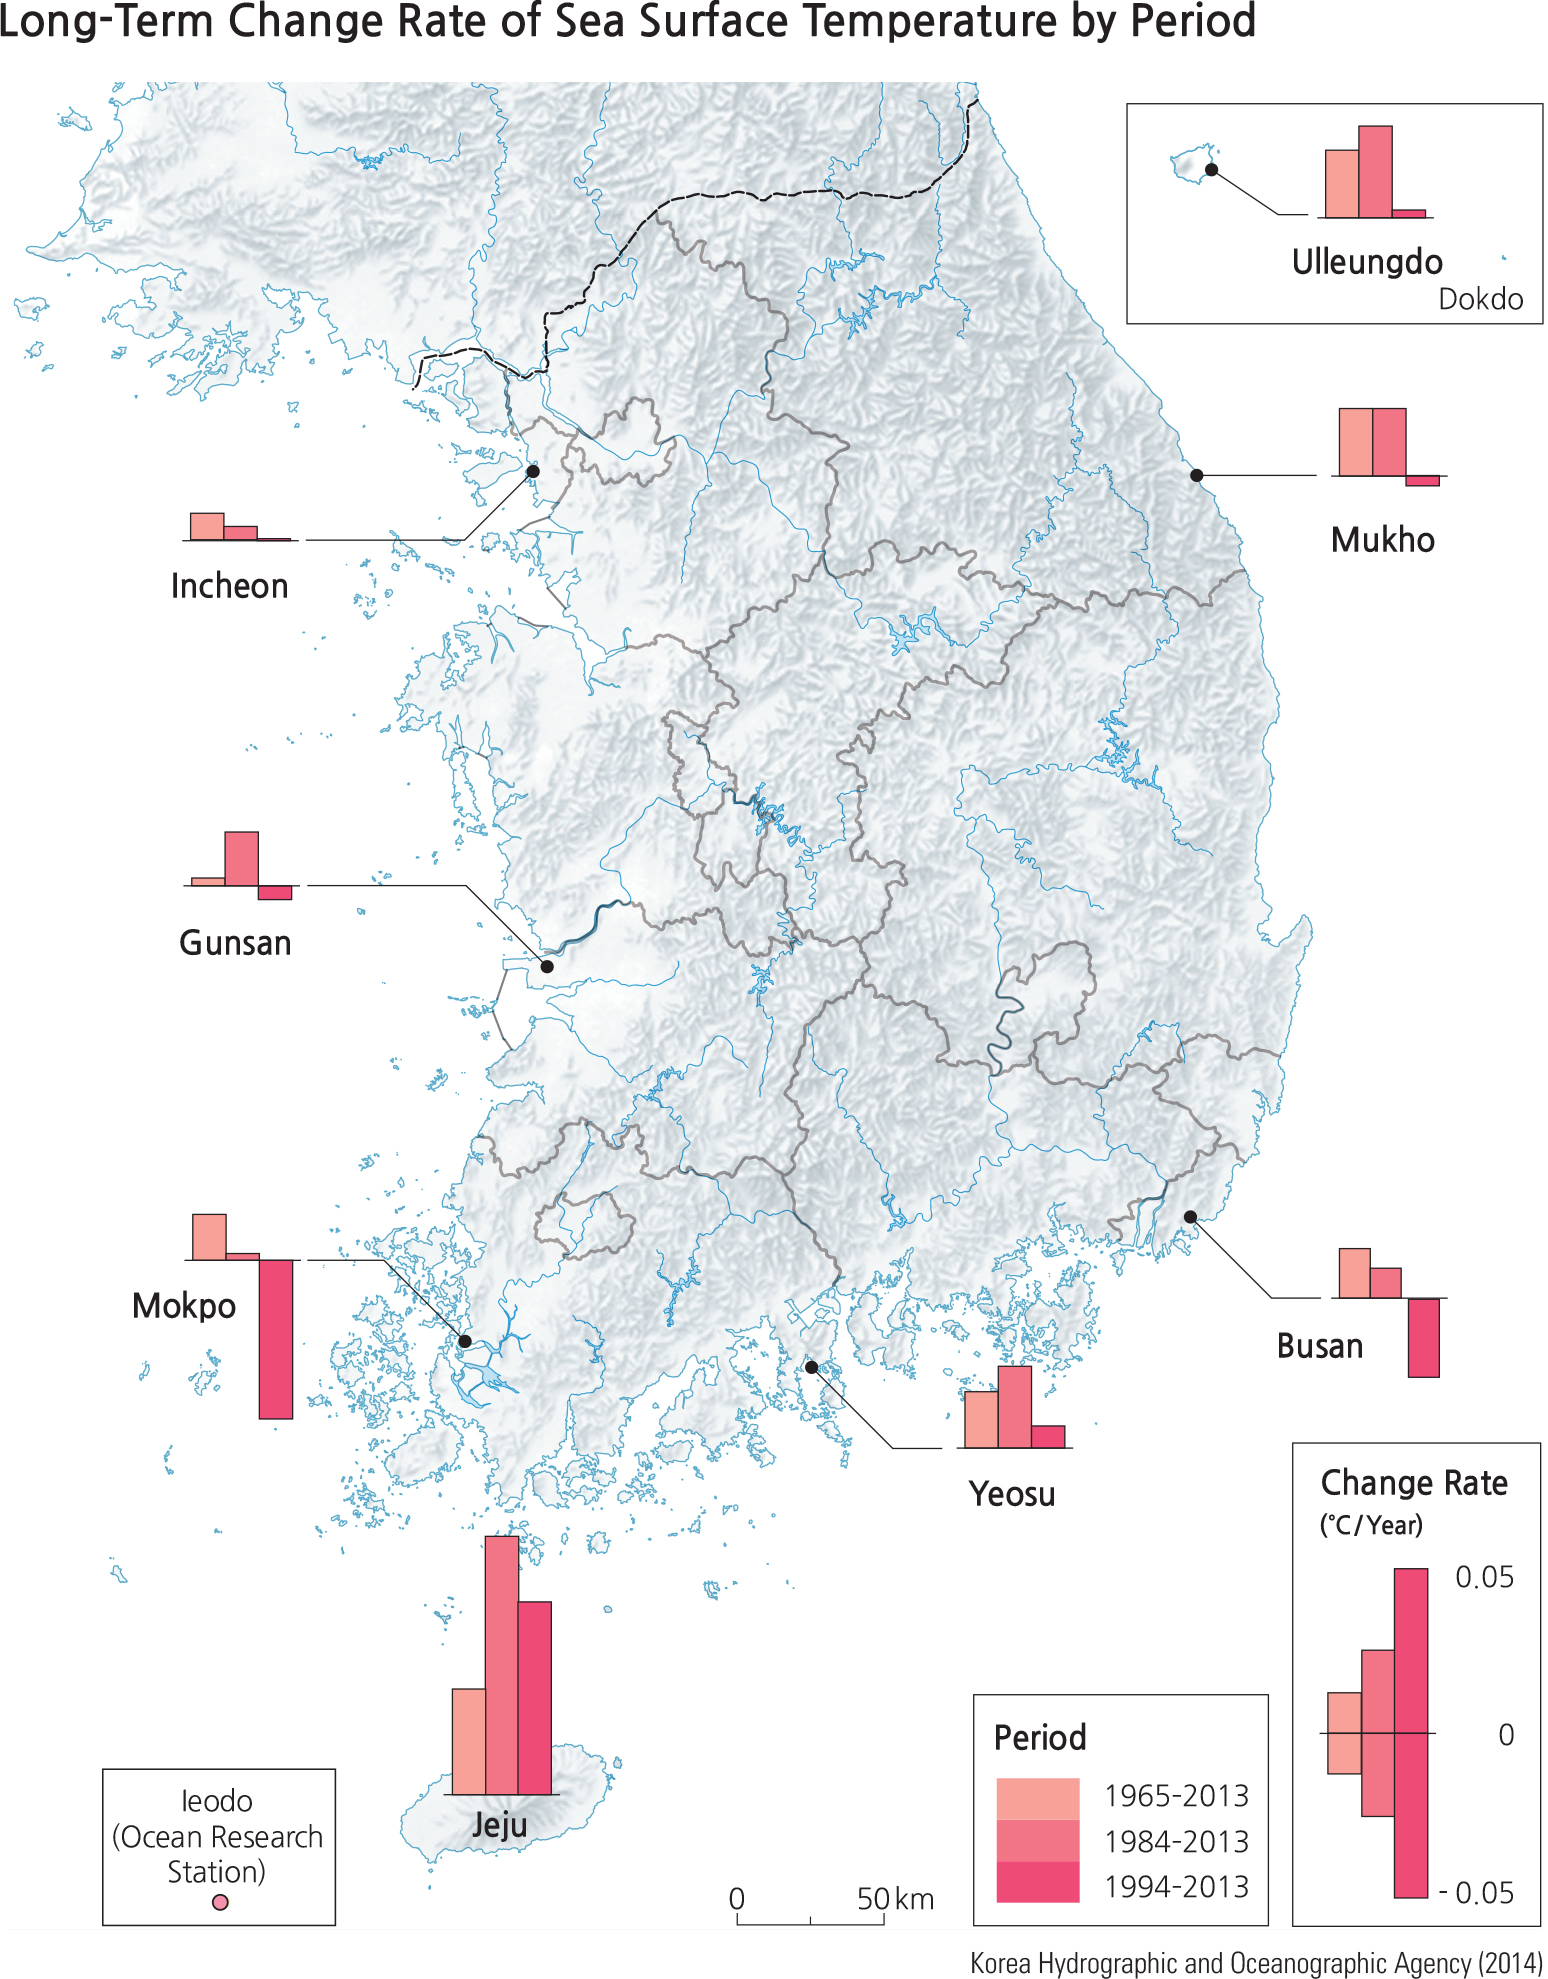
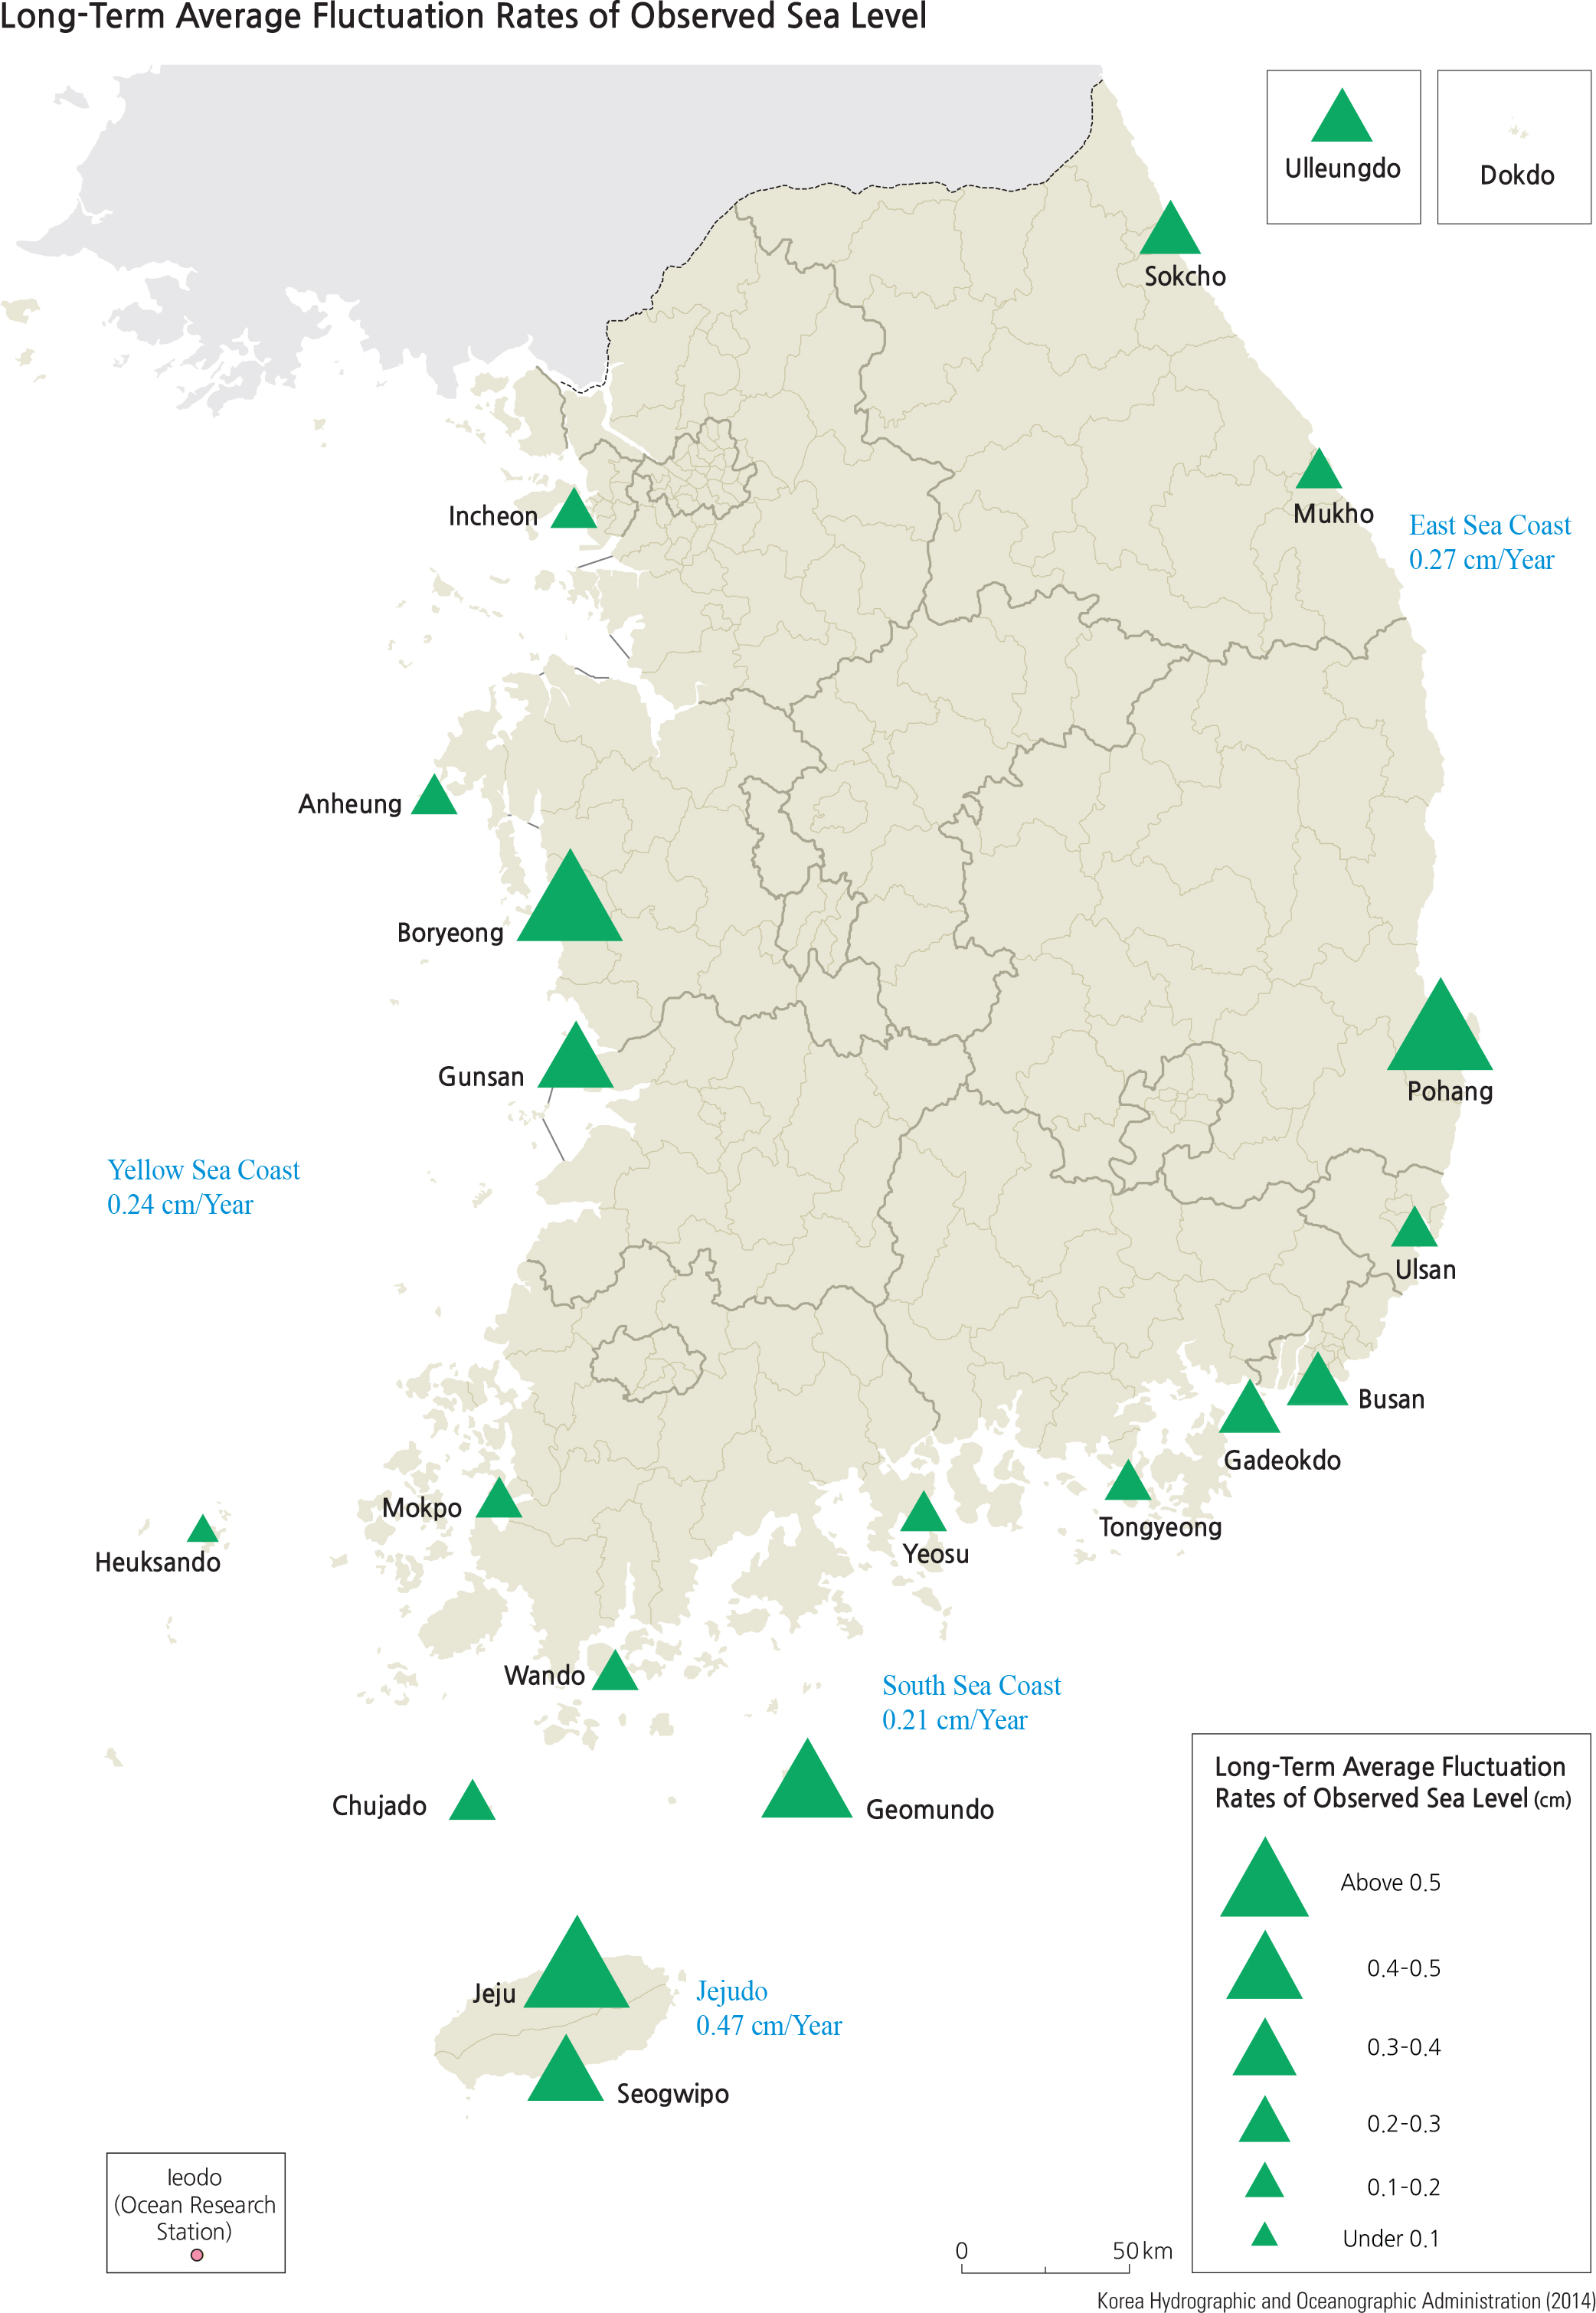
Sea level surrounding the Korean Peninsula has increased. The rate of sea level rise in the East Sea is relatively higher than that in the South and Yellow Seas; the rates of sea level rise for the South and Yellow Seas are similar. Observed mean sea level fluctuations around the Korean Peninsula are 0.24 cm/yr, 0.21 cm/yr, and 0.27 cm/yr in the Yellow, South, and East Seas, respectively. Mean sea level fluctuation in Jejudo is the highest at 0.47 cm/yr. Boryeong in the Yellow Sea recorded the highest sea level fluctuation among all the seas at 0.65 cm/yr. Areas with the highest sea level fluctuation recoded are Jejudo (0.55 cm/ yr in the Yellow Sea), Geomundo (0.41 cm/yr in the South Sea), and Pohang-si (0.58 cm/yr in the East Sea), respectively.
Compared to the other seas, the sea level rise in the East Sea is remarkable. It is due to an increase in the heat transport of the Kuroshio warm current and rise in the temperature of the warm current through the East Sea as a result of global warming. If global warming is accelerated, the coastal areas are expected to suffer great damage from coastal flooding due to sea level rise.
According to the RCP 4.5 and 8.5 scenarios, the sea level around Korea will rise by 53 cm and 65 cm respectively for both scenarios, for both the South Sea and Yellow Sea; and 74 cm and 99 cm respectively for the East Sea within the latter part of the twenty-first century (2071–100). Meanwhile, global average sea level is expected to rise by 70.6 cm and 88.5 cm respectively, for the same time period. Also based on the RCP 4.5 and 8.5 scenarios, the sea level will rapidly increase by 2100, and the sea level around the Korean Peninsula will continue to rise by more than 65 cm and 85 cm, respectively, in both the South Sea and Yellow Sea, and 90 cm and 130 cm, respectively, in the East Sea. The RCP 8.5 scenario predicts a high risk of flooding due to rising sea level in coastal lowlands. (Please refer to Page 60 for explanation of the RCP scenarios.)
Brief Interpretation of the Map
The map on this page is of the type termed a graduated symbol map. The map symbols used (in this case triangles) are often scaled to make small differences in data more visible to allow the user to discern small variations in patterns rather than looking at numbers. However, interpretation of these scaled symbols can be tricky and the scales associated with the symbols need to be inspected carefully. In many cases, cartographers use this type of symbol to make better use of limited map space by using non-linear scaling –in effect compressing larger values
and using different scales for smaller values to enhance visibility.
In this case the five categories of triangles use a preferred interval scale that is of equal size except for the two openended top and bottom values (above 0. 5 cm; 0.4–.5 cm; 0.3–.4 cm; 0.2–.3 cm and below 0.2 cm). This linear scale makes direct size interpretations possible. However, the total range of the fluctuation is just over half a centimeter, which is not a large rate of increase and which begs one to assume that the precision of the instrumentation will be critical in the measurement with a relatively large possible error even if the values are based on hundreds of measurements. Nevertheless, the averaged values are all positive or increasing.
The data shows relatively high rates at Jeju and Geomundo (island data stations in the South Sea), Pohang (a 10-km bay) on the East Sea Coast, and Boryeong (anisland/coastal environment) on the Yellow Sea west coast. If one accepts the RCP projections of sea level rise associated with the higher scenarios, these four locations and nearby locations might expect considerable coastal flooding by the end of the 21st century.
The coastal locations of all the data points suggest that considerable concern for planning for future sea level rise is wise under all the RCP scenarios in similar deep and shallow water environments. Locate an additional 10 locations that are at risk for urban flooding. What are their risk factors? What methods of mitigation might you suggest for the existing and projected urban risk areas?