The manufacturing industry of Korea has gone through tremendous continuous growth during the last fifty years. It first pursued a strategy of exporting products from light industries such as textiles, wigs, and shoes. Since the mid-1970s, government industry promotion has shifted to the heavy chemical industry. In the 1990s, there was a shift in investment emphasis to high-tech industries. Significant high-tech growth, including the development of semiconductors, computers, and information and communication technology, was accompanied by advanced technology training.
Analyzing trends by comparing the proportion of manufacturing growth in Korea to GDP (Gross Domestic Product) reveals that manufacturing accounted for only 10% of the GDP before 1960. During the decade from 1961 to 1970, manufacturing grew from 11.8% to 17.2%. In the 1970s, manufacturing accounted for over 20% of the total GDP. In the 1980s, the growth rate for the decade was 24.3% and manufacturing became the major driving force of economic growth in Korea.
Between the late 1980s and ear ly 1990s , the manufacturing share of the GDP declined slightly from 27.2% (1988) to 23.9% (1992), after which it gradually rose again, remaining at around 27–28% into the 2010s. Although the real growth rate of the manufacturing industry remained at relatively high levels (16.8% in the 1960s, 15.8% by the 1970s, and 12.2% by the 1980s), it later declined to 6.5% in the 1990s and to 4% by the 2000s. In particular, with the 1997 financial crisis resulting from internal and external factors and the global financial crisis of 2008, manufacturing fell significantly, recording a negative rate of growth.
During the early industrialization stage in the 1960s, Seoul was the most important manufacturing center in the country. Since the 1980s, however, manufacturing has become suburbanized and decentralized outside of the Greater Seoul Metropolitan Area. At the same time, foreign direct investments in China and Southeast Asia have accelerated as the wage increases have surpassed productivities and weakened cost-competitiveness.
Brief Interpretation of the Map
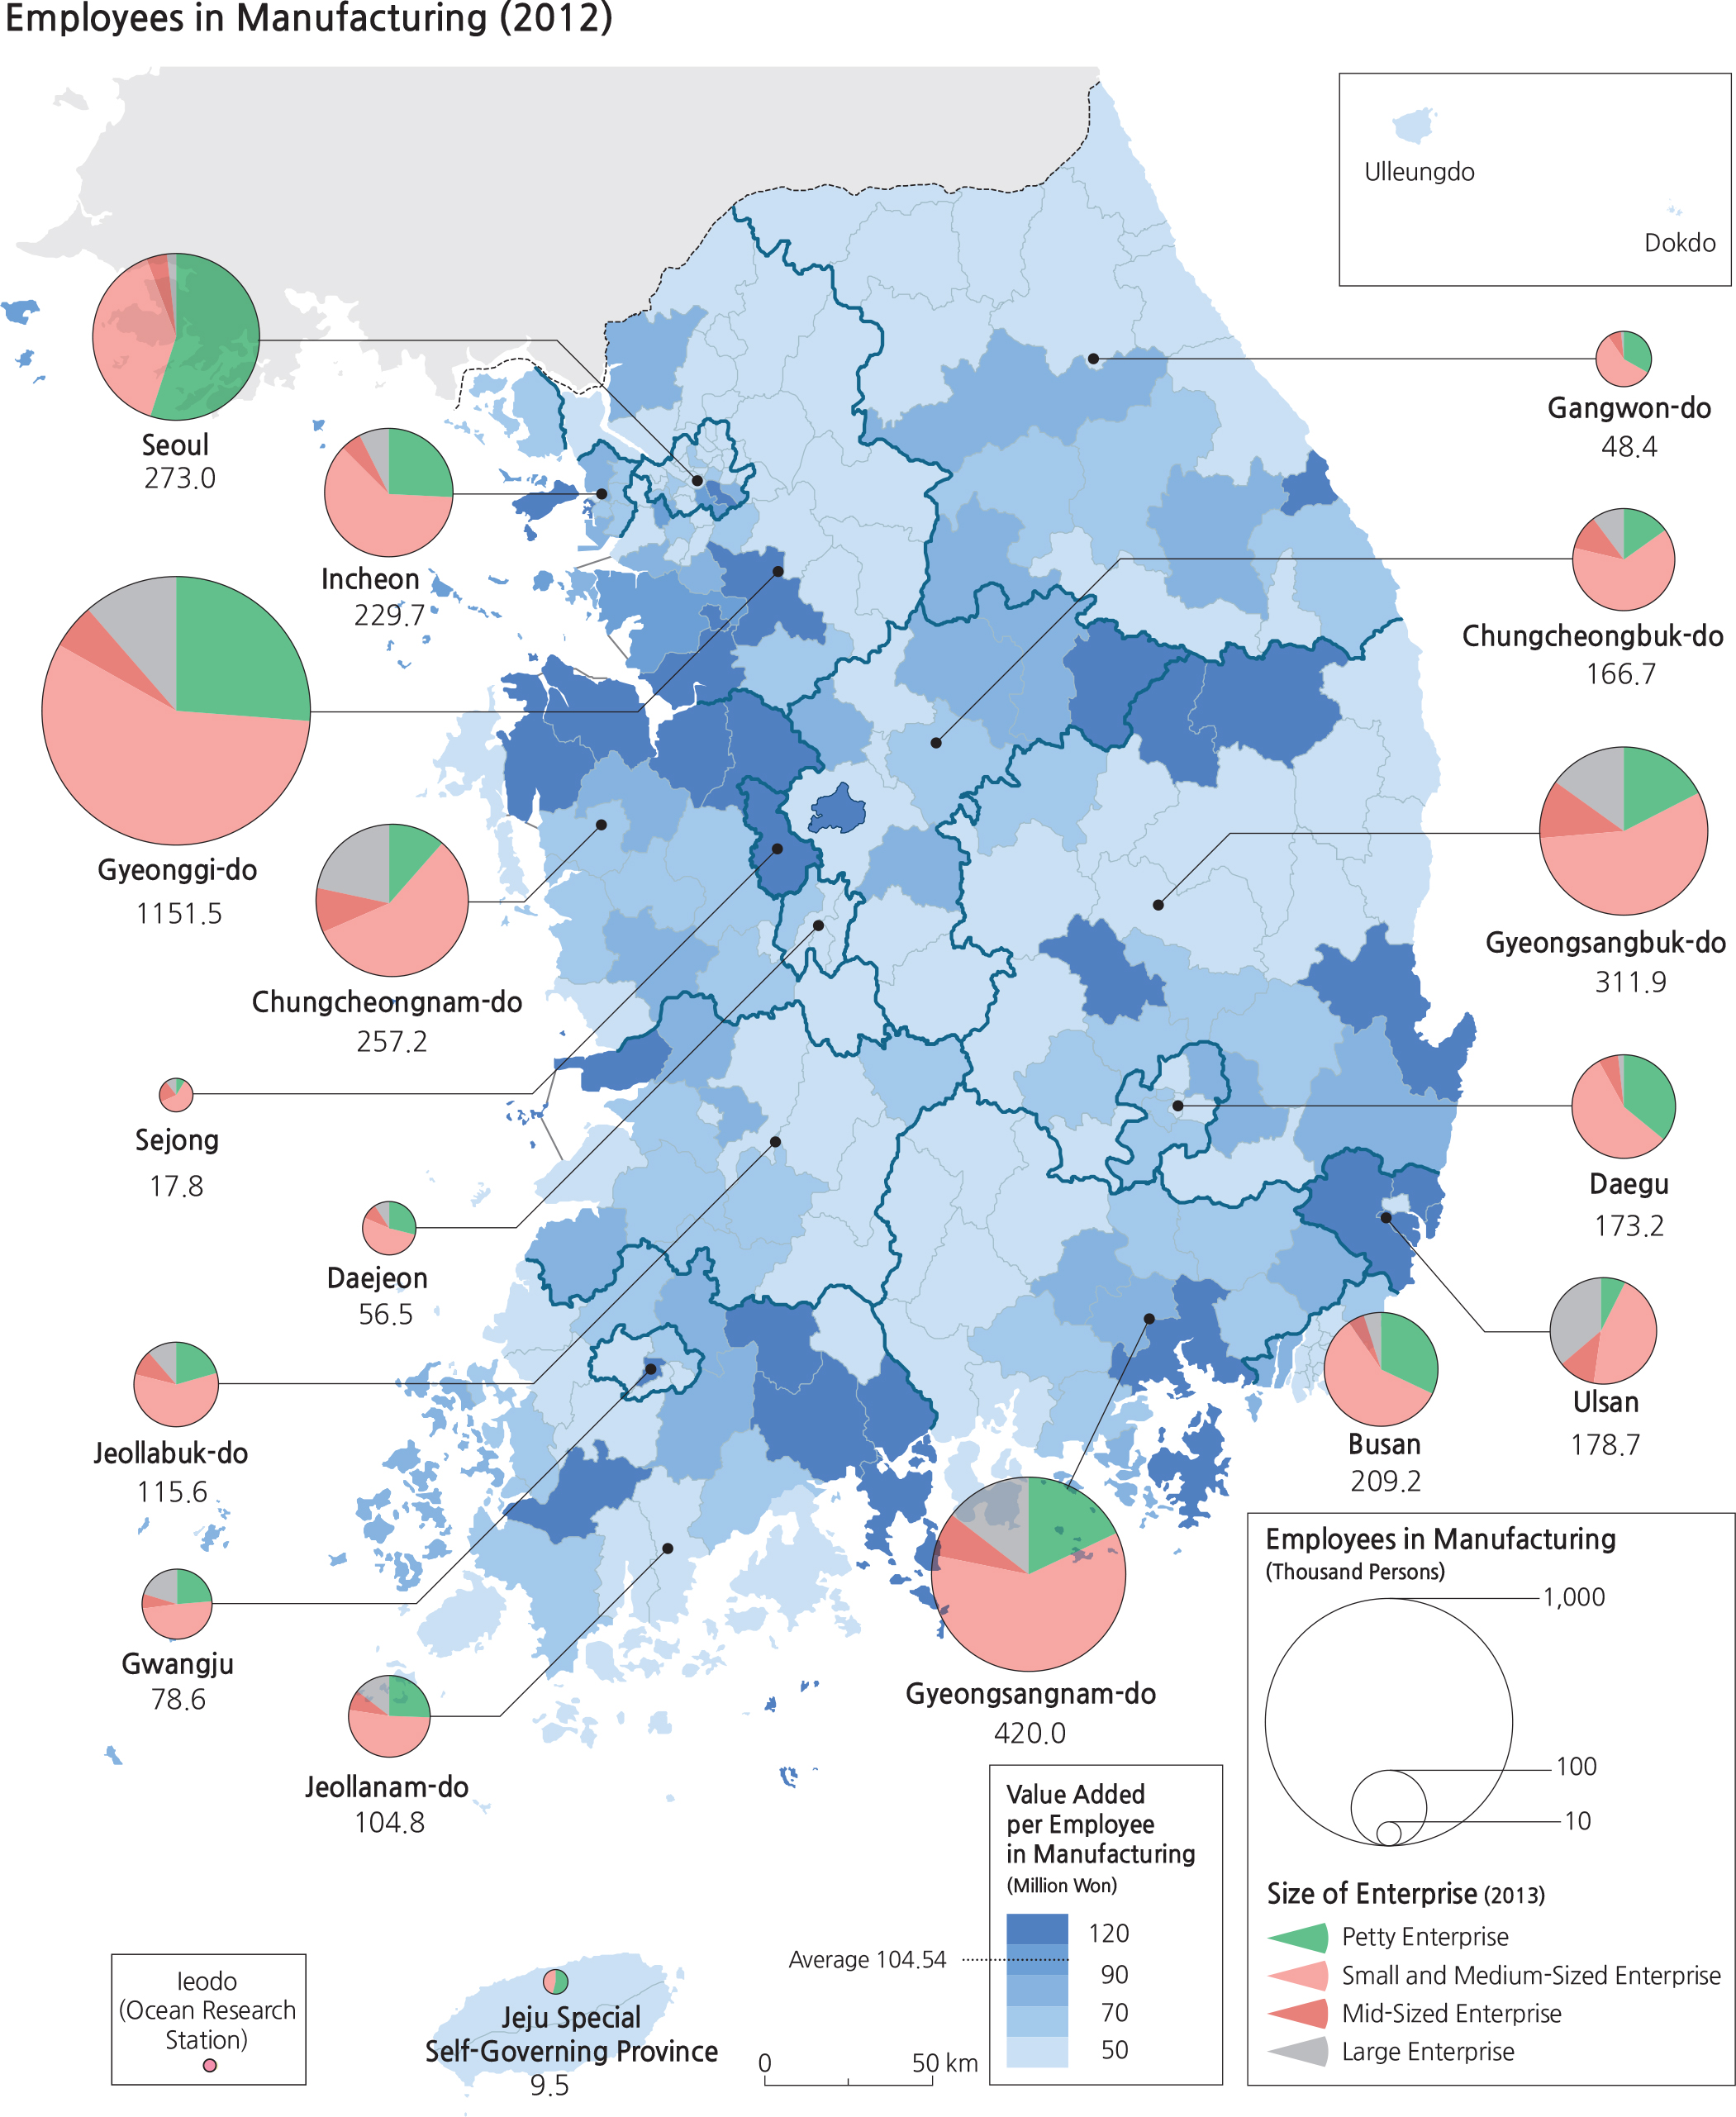
The map on this page explores how different sectors (very small to large) of the manufacturing industry contribute to the Korean economy. Using the uncommon statistic of Value-Added by Employee Index, the sizes of the industries in the different provinces and metropolitan areas are compared. Throughout the country, small to medium sized manufacturing industry dominates, ranging from 45% up 65% of the total everywhere. The largest employers are located in the newer locations, while the traditional 1960s growth centers employ fewer people. It is interesting that the highest Value-Added sub districts are not associated with the larger metropolitan areas but with locations designated by the government for special development attention.
The growth rate of manufacturing compared to proportional contribution to the GDP shows a steady inverse relationship since 1953. The growth rate has steadily decreased to the present while the proportion of contribution to the GDP has steadily increased, bringing attention to the growth of economic contribution of manufacturing of all sizes.
Manufacturing does not have the same working conditions and worker training requirements compared to other types of industry. If you were exploring sites for a new fish processing and canning plant, would the Value-Added industry cost and requirements of the average sub-district worker narrow your site options? Would other locational and working condition factors weigh more heavily in your choice, rather than the Value-Added Employee Index of a sub-district?