Population migration can be characterized according to duration of stay, location, distance, and motivation. Domestic migration is a move within a national border while international migration crosses an international border. Domestic migration can also be an in-migration or an out-migration between regions, provinces, or cities. Net migration is the difference between in-migration and outmigration of the same place in the same period of time. If the number of in-migrants is larger than the number of out-migrants, there will be an in-migration surplus. In the opposite case, there will be an out-migration surplus. The number of total migrants is the sum of in-migrants and outmigrants. The migration rate is the total number of migrants in an administrative area as the percentage of the number of residents registered in that administrative area on July 1 of the year.
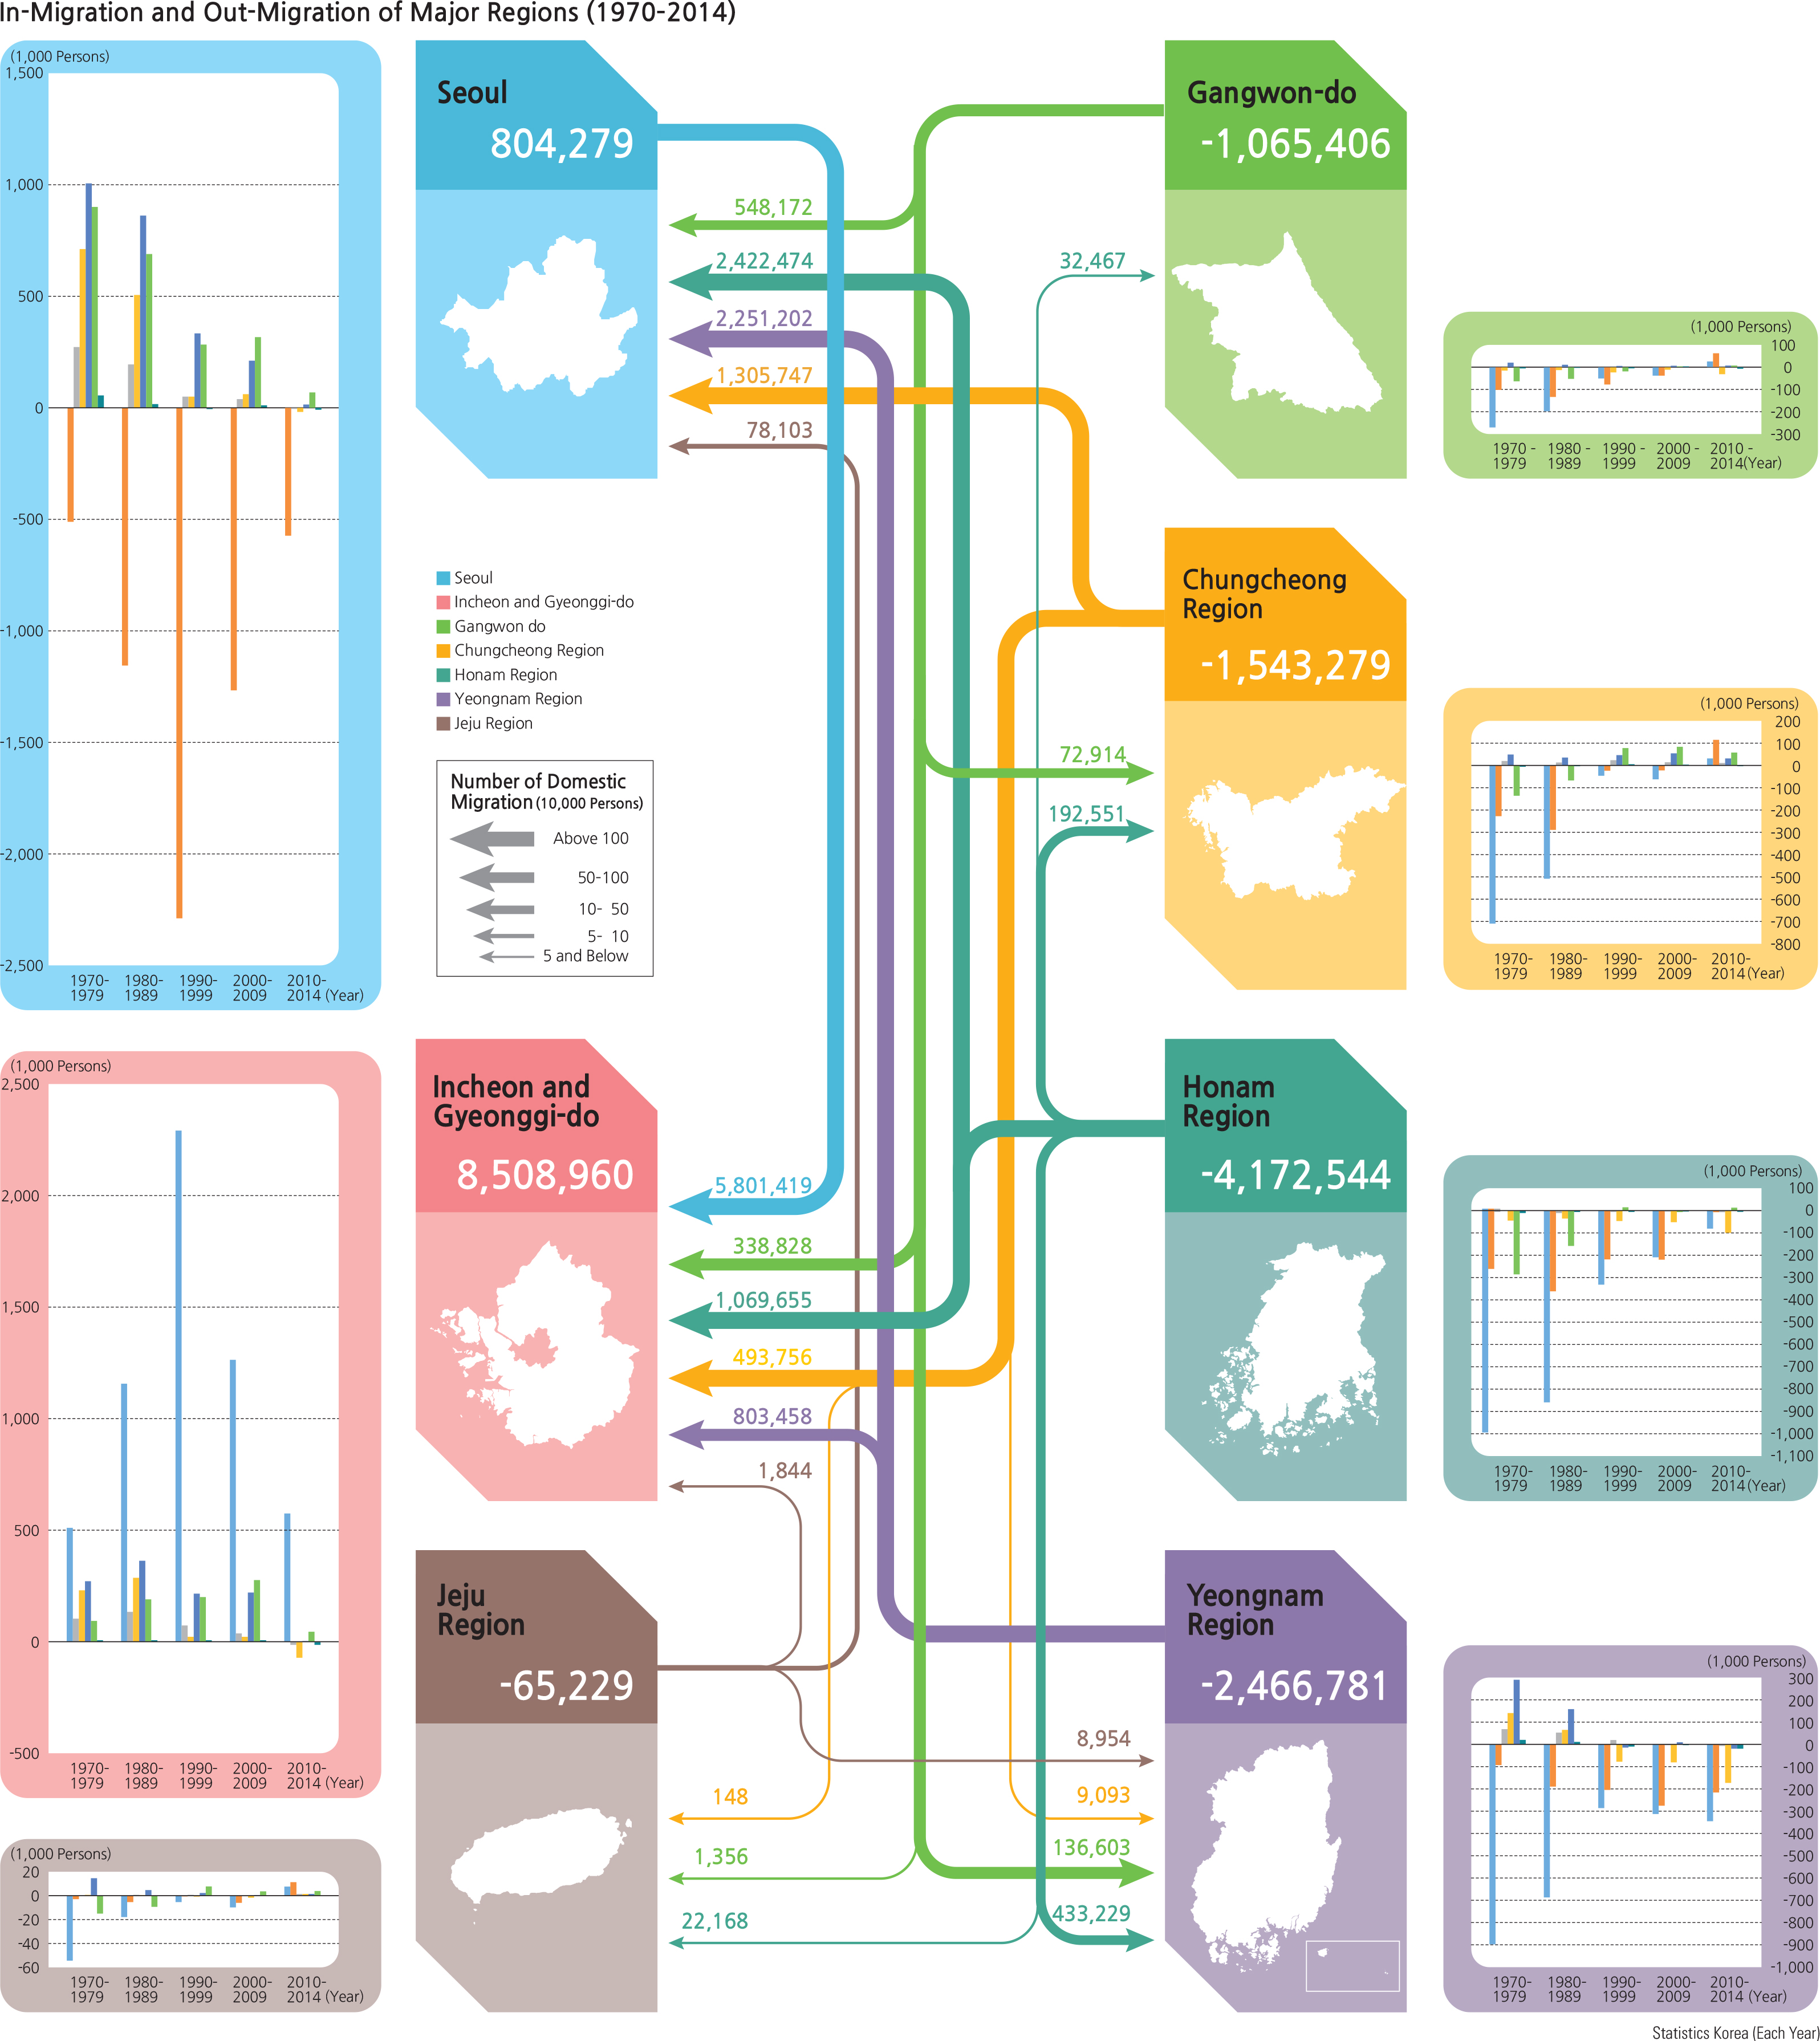
The Korean domestic migration had increased over many years during the industrialization and urbanization periods. Since the early 2010s, it is gradually decreasing because of better transportation and an aging population. Migration to the Greater Seoul Metropolitan Area intensified during the 1970s and 1980s as people moved there for jobs and schools. After the 1990s, regionally balancing development policies were implemented to relieve congestion. Many public institutions and private corporations were relocated to outside the Greater Seoul Metropolitan Area. The population of Seoul peaked in 1990 at10.6 million. Since then, the population has been gradually decreasing, and most out-migrants have settled in Incheon or Gyeonggi-do Province.
International migration refers to moving to and from another country. Net international migration is the difference between the number of immigrants (entries) and the number of emigrants (departures). A net immigration means more
immigrants than emigrants. On the contrary, net emigration means more emigrants than immigrants. Total international migration is the sum of immigrants and emigrants. Korea has been experiencing net immigration since 2006, as the number of immigrants overtook the number of emigrants. Overall, the net immigration of foreigners has been rising due to increases in international marriages and opportunities for work or study in Korea.
In 2014, vital statistics for the Sejong Special Self-Governing City, a planned city that houses many government ministries, displayed the highest migration rate at 57%. Geochang in Gyeongsangnam-do Province had the lowest at 15%. In the case of net migration rates, statistics for Yeongdo-gu in Busan showed the largest negative rate at -25%, while the Sejong Special Self-Governing City had the largest positive rate at 24%.
The 20-40 age group tallied the highest in-migration as well as out-migration rates. The Sejong Special Self-Governing City had the highest interregional migration rate of 82% (at the administrative -si/-do level). Jeollabukdo showed the lowest rate at 26%. Gyeonggi-do tallied the highest intra-regional migration rate at 41% (at the administrative -si/-gun/-gu level), while the Sejong Special Self-Governing City had the lowest rate at 18%.
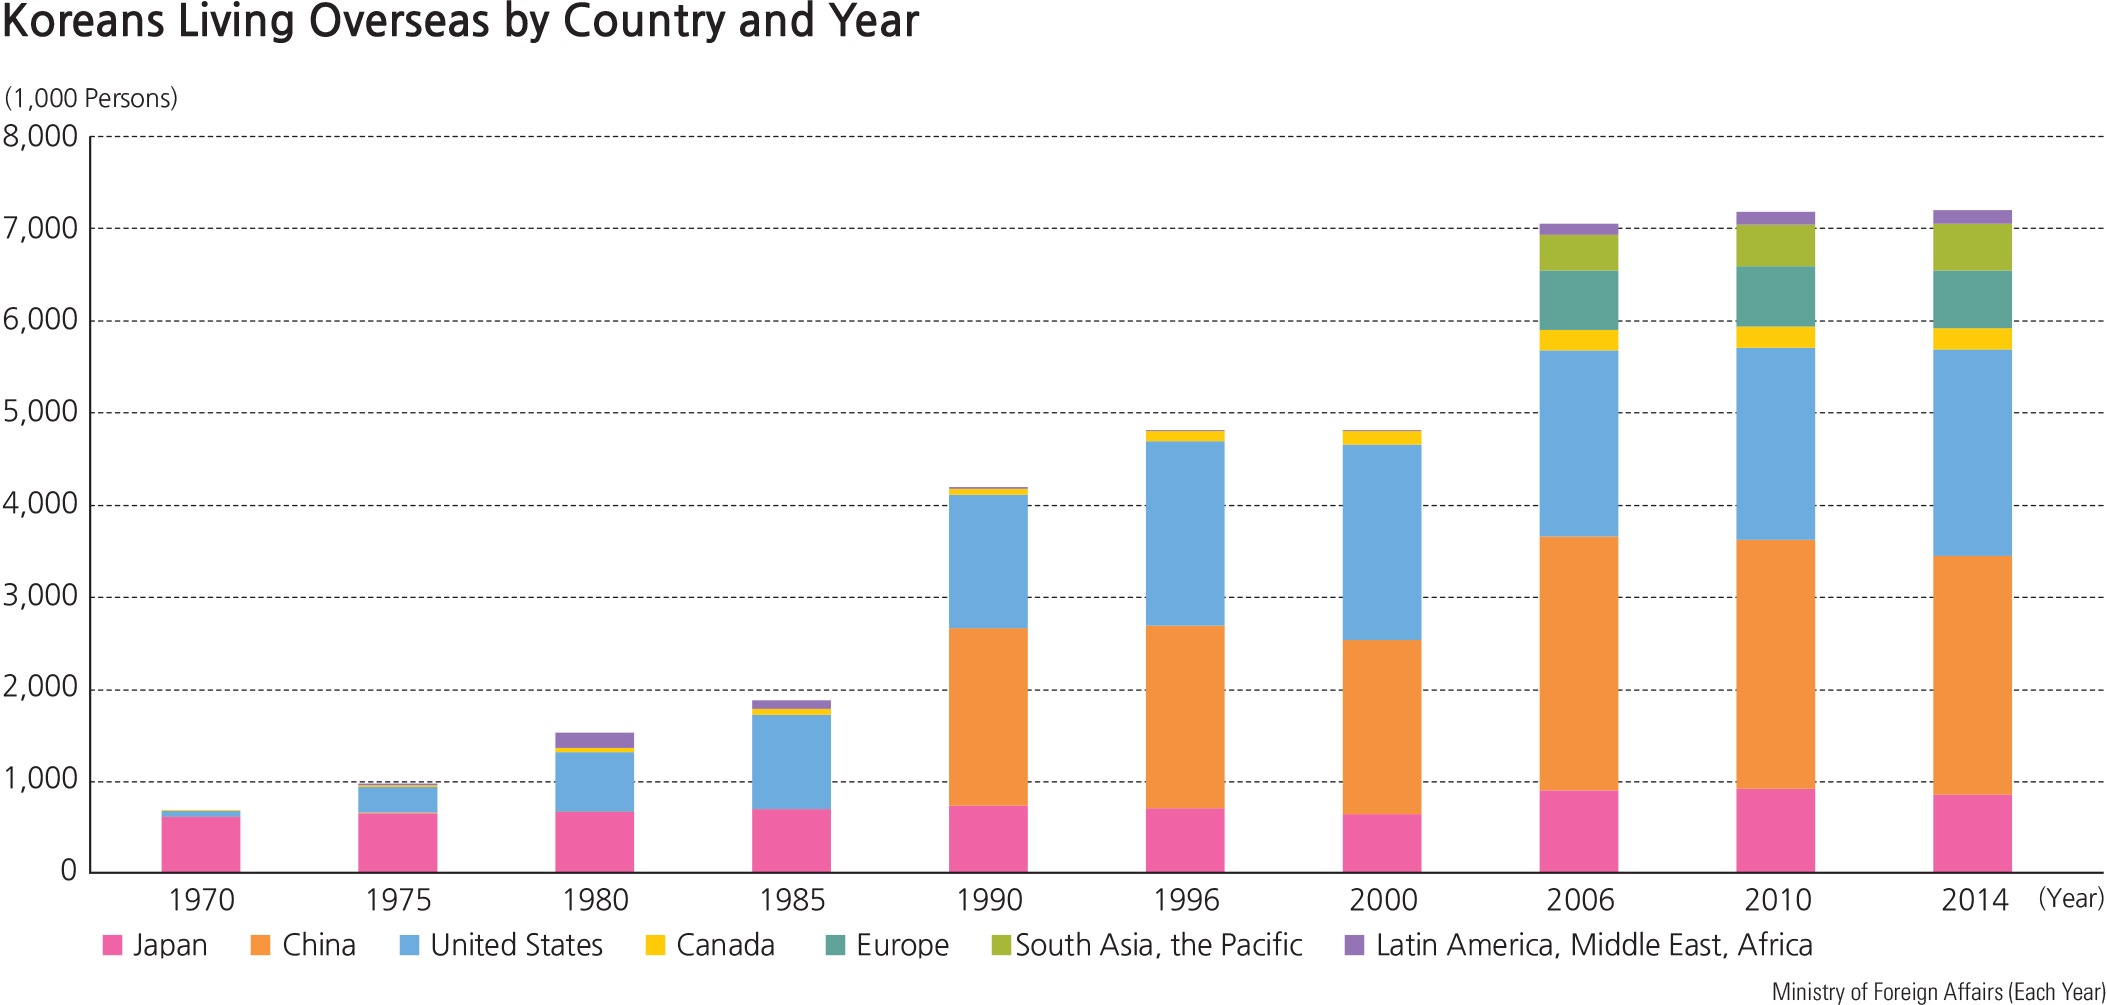
The international migration of Koreans can be divided into the out-migrant Koreans who stay or live abroad and the in-migrant Koreans who are living in Korea. Overseas Koreans are categorized into Korean nationality or foreign nationality. As of 2014, there were approximately 7.18 million overseas Koreans, primarily in China, the United States, Japan, and the former Soviet Union countries. Initially, Korean immigrants overwhelmingly chose to live in the United States, but more recently they are also choosing many other countries, including Canada, Australia, and New Zealand. The number of foreign nationality Koreans who live in Korea increased from approximately 270,000 in 2006 to 700,000 in 2014. As of 2014, there were approximately 290,000 (42% of the total) overseas Koreans with F-4 (Overseas Korean) visas, followed by 280,000 (40%) with H-2 (working visitors) visas, another 75,000 (11%) with F-5 (permanent resident) visas, and about 20,000 (3%) with F-6 (marriage to Korean citizen) visas. As of 2014, more than 290,000 foreign nationals of Korean descent have reported their domestic residences. The number of Koreans who live in Korea with permanent residency in another country increased from approximately 40,000 in 2005 to 80,000 in 2014. Since the 2000s, the number of people who have escaped from North Korea has increased significantly, and, among these refugees, there have been more women than men.
Brief Interpretation of the Maps
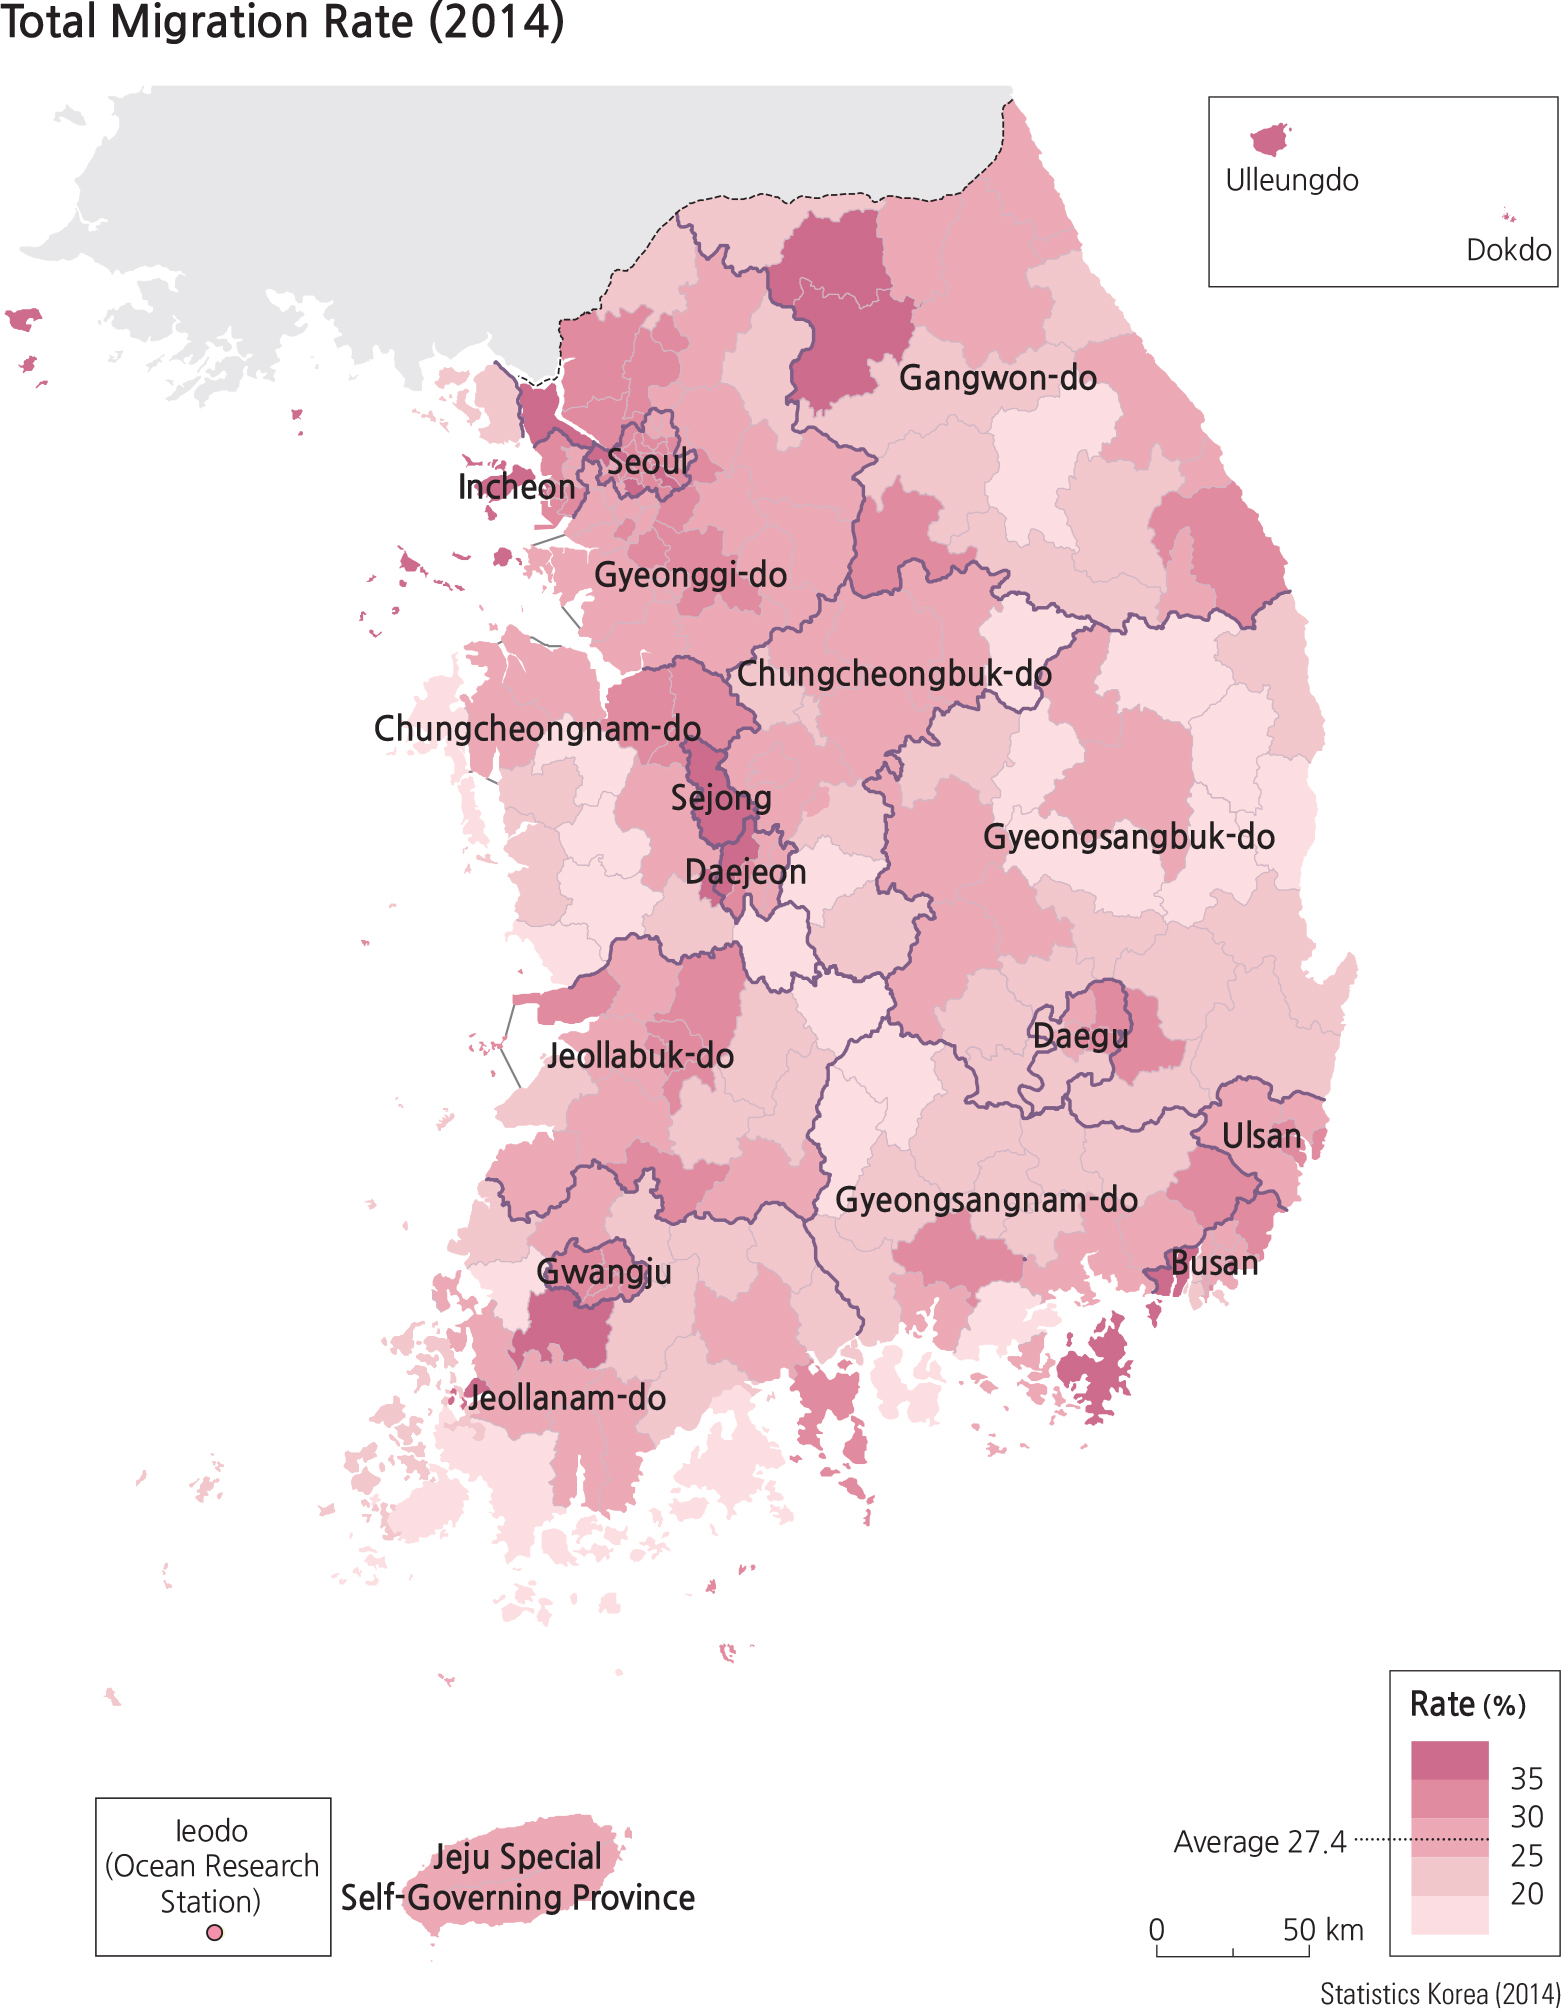
The 2014 Total Migration Rate Map illustrates total migration rate of all in- and out-migrants at the -si/-gun/gu administrative level. The data indicates a range of less than 20% to higher than 35% with a national average of 27.4%. The spatial pattern of total migration rate is highest in two of the administrative units in the north central area near the DMZ, in the Ulsan-Busan industrial region, and along the western part of Korea that coincides with one of the high traffic transportation corridors.
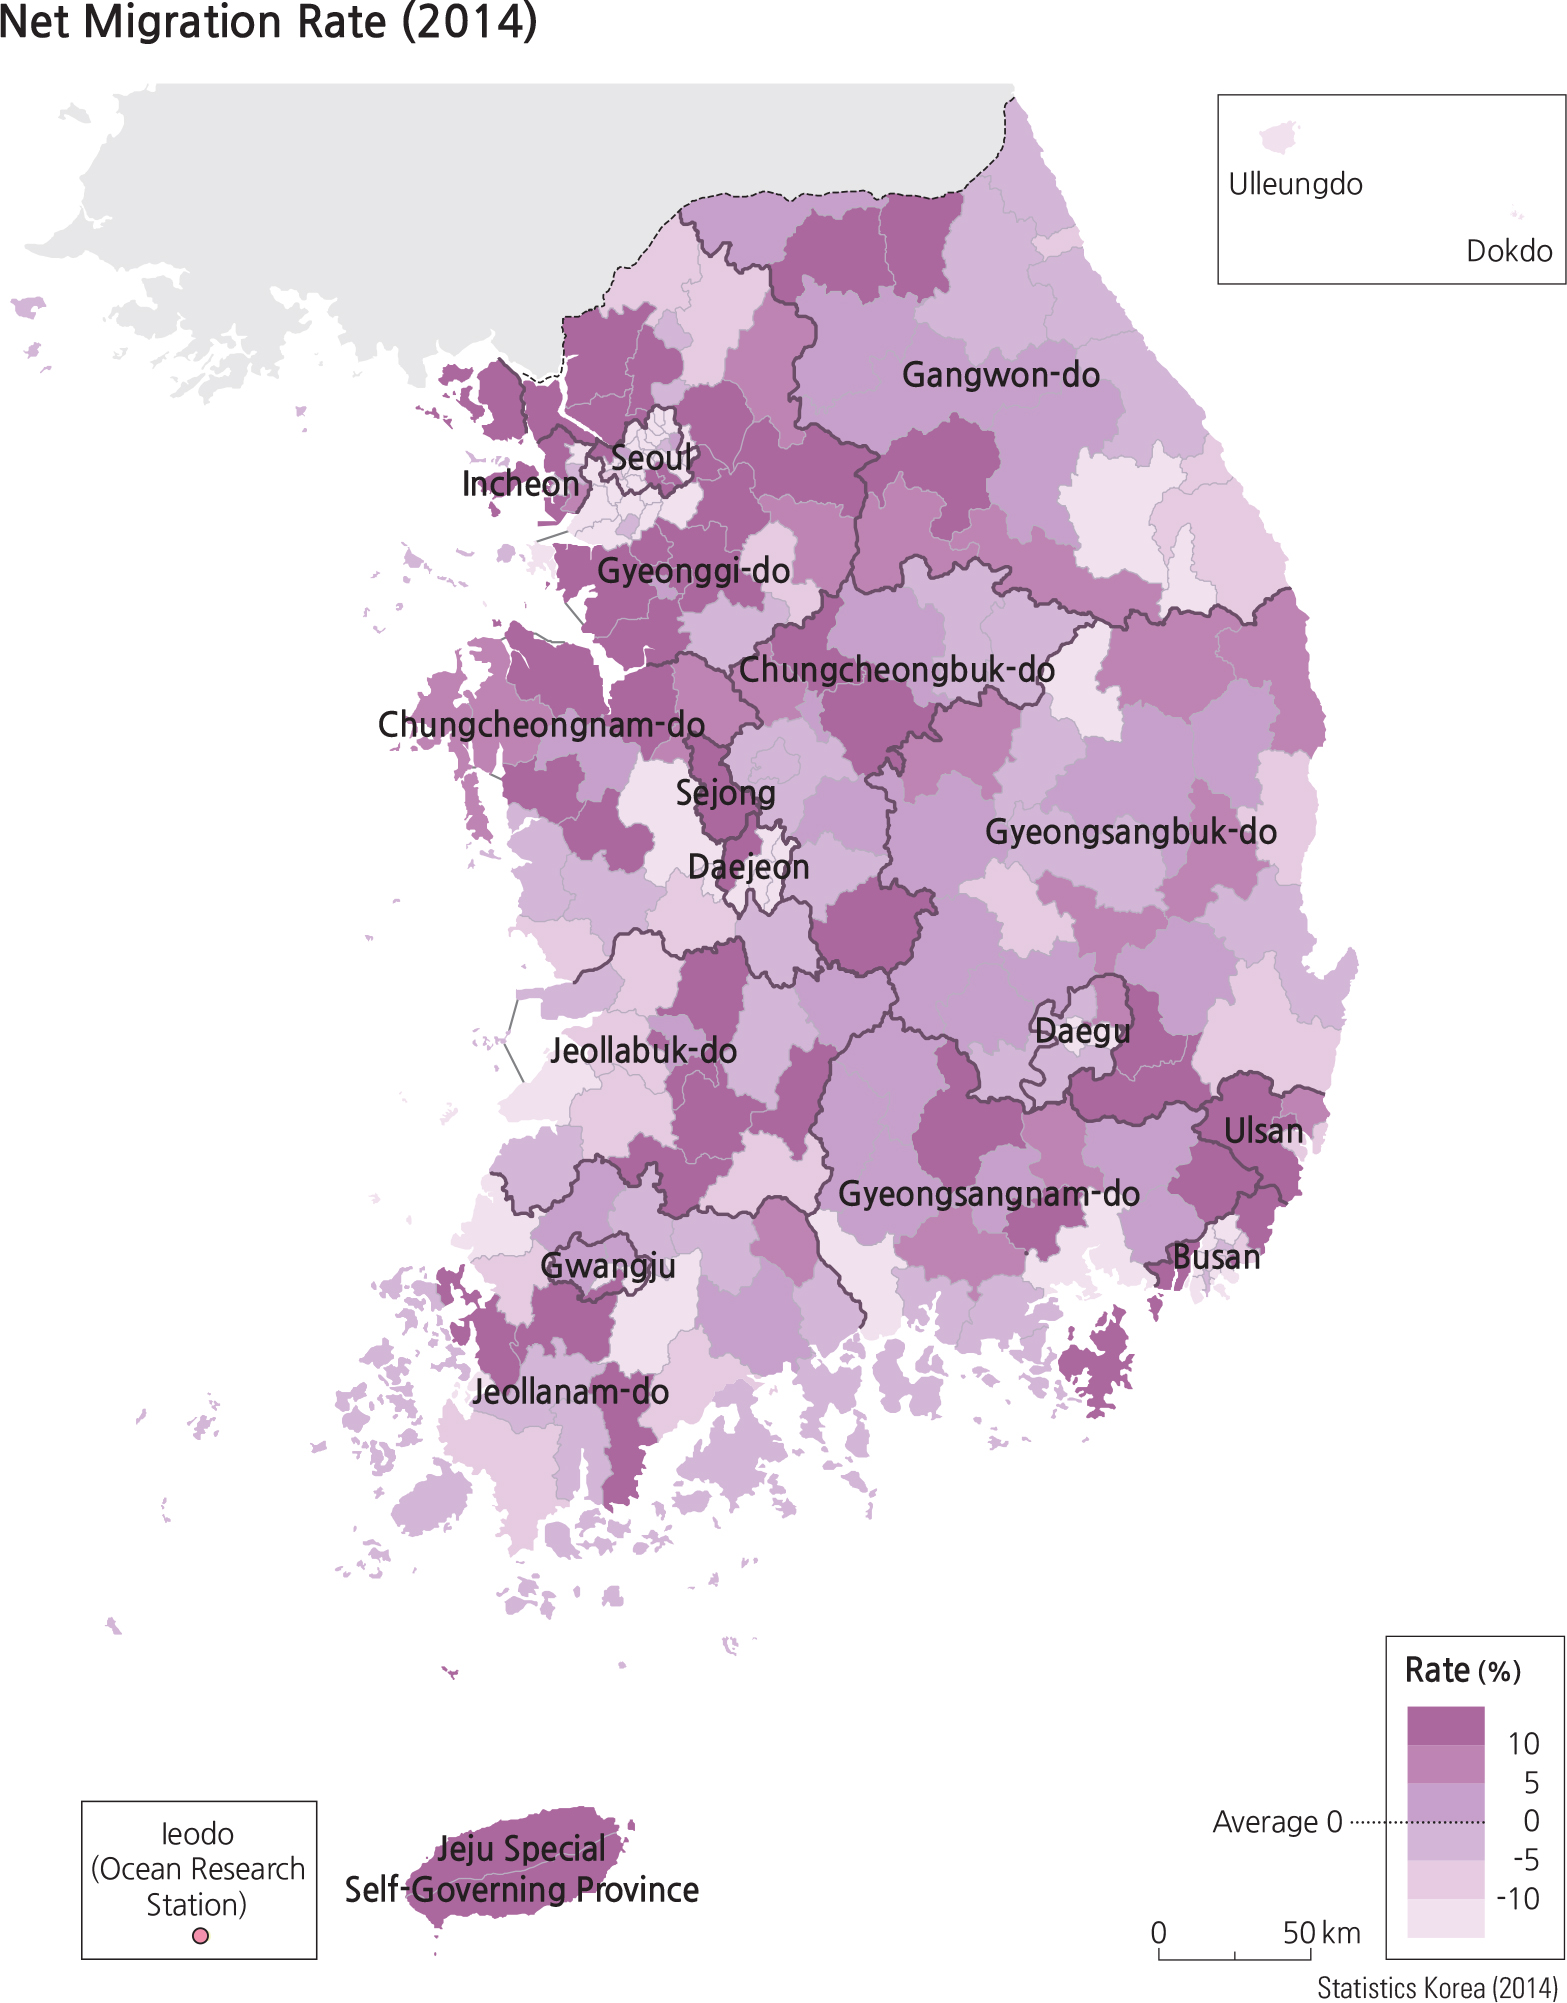
The 2014 Net Migration Rate map presents the net migration range from more than 10% loss to more than 10% gain with the national average at 0. While most metropolitan and large urban centers show a net loss, all surrounding suburbs display net gains. These migration patterns clearly indicate that the central core of large cities have been saturated and people are willing to move into surrounding suburbs due to more efficient transportation modes in recent decades. The Seoul subway system extends in many directions to connect to all surrounding suburbs. This also creates new spatial phenomena and patterns that relate to daily commuters (see page 77).
Are there spatial pattern similarities and differences between the two 2014 migration maps (one on total migration and one on net migration)? What can you conclude about the distances traveled for migrants in areas of the map that similar patterns? By the same token, if the same area shows different spatial patterns between the two maps, what can you surmise about the distances traveled by migrants to and from this area?