At the end of the Korean War (1950–.1953), the Korean government started housing projects as a part of post-war reconstruction efforts. Until the 1960s, strategic investment priorities were placed on rebuilding industries. Government investment in housing was therefore very small, reaching only 2.4% of GNP during the 1962–.1966 period and 3.0% during the 1967–-1971 period. During these periods, housing developments were mostly led by the private sector, and only about 13% of housing development was supported by the public sector.
As the population grew, the demand for and supply of housing units have both increased as well. The housing supply has soared since the 1980s, exceeding 10 million housing units by the year 2000. The housing supply rate exceeded 100% by 2008, meaning that nationally there is enough housing for everyone. There are, of course, regional differences; some regions have more than enough housing supply, other regions do not. Traditionally, the dominant housing type was single-detached dwellings; however, due to pressure on available space, these have been outnumbered by apartments, thus increasing the apartment residence rate significantly. The single detached dwelling ratio was 87.5% in 1980, but dropped to 27.3% by 2010. During the same period, the apartment ratio has increased from 7% to 59%. The supply of apartments varies by region, and the trend shows that the supply is mainly concentrated in the capital and metropolitan areas rather than in non-metropolitan areas.
In the 1970s, the Korean government began to invest more heavily in housing, and established a series of necessary policies and laws. For example, the Housing Construction Promotion Act was enacted in 1973, and the Act promoted provision of “national housing” using funds from government-owned banks or local governments. Priority to purchase was granted to people who never owned a home
before, and this purchase-priority policy was maintained for more than thirty years. In addition, the national and local governments contributed to the improvement of the urban environment, with land improvement projects and residential land development projects. As a result, housing conditions in the Greater Seoul Metropolitan Area and other metropolitan cities improved significantly from the perspective of total housing stock as well as homeowner ratios. In 1975 there were 4.734 million housing units in total. The number of total housing units in 2010 was 13.884 million, which was about a three-fold increase since 1975.
In the Greater Seoul Metropolitan Area, the number of housing units per 1,000 persons was only about 137 in 1975. It surpassed 200 by 2000, and reached 364 units by 2010 (a 2.7-fold increase from 1975 and an average of 2.75 persons per unit), indicating that three out of every ten people own a house. Regarding the total number of housing units, the Greater Seoul Metropolitan Area had 6.291 million houses in 2010 (45.4% of the national total). With such dramatic increases in housing supply, the housing supply ratio in the Seoul Metropolitan Area in 2010 was 99%, and, nationally, it was greater than 100%.
Brief Interpretation of the Maps
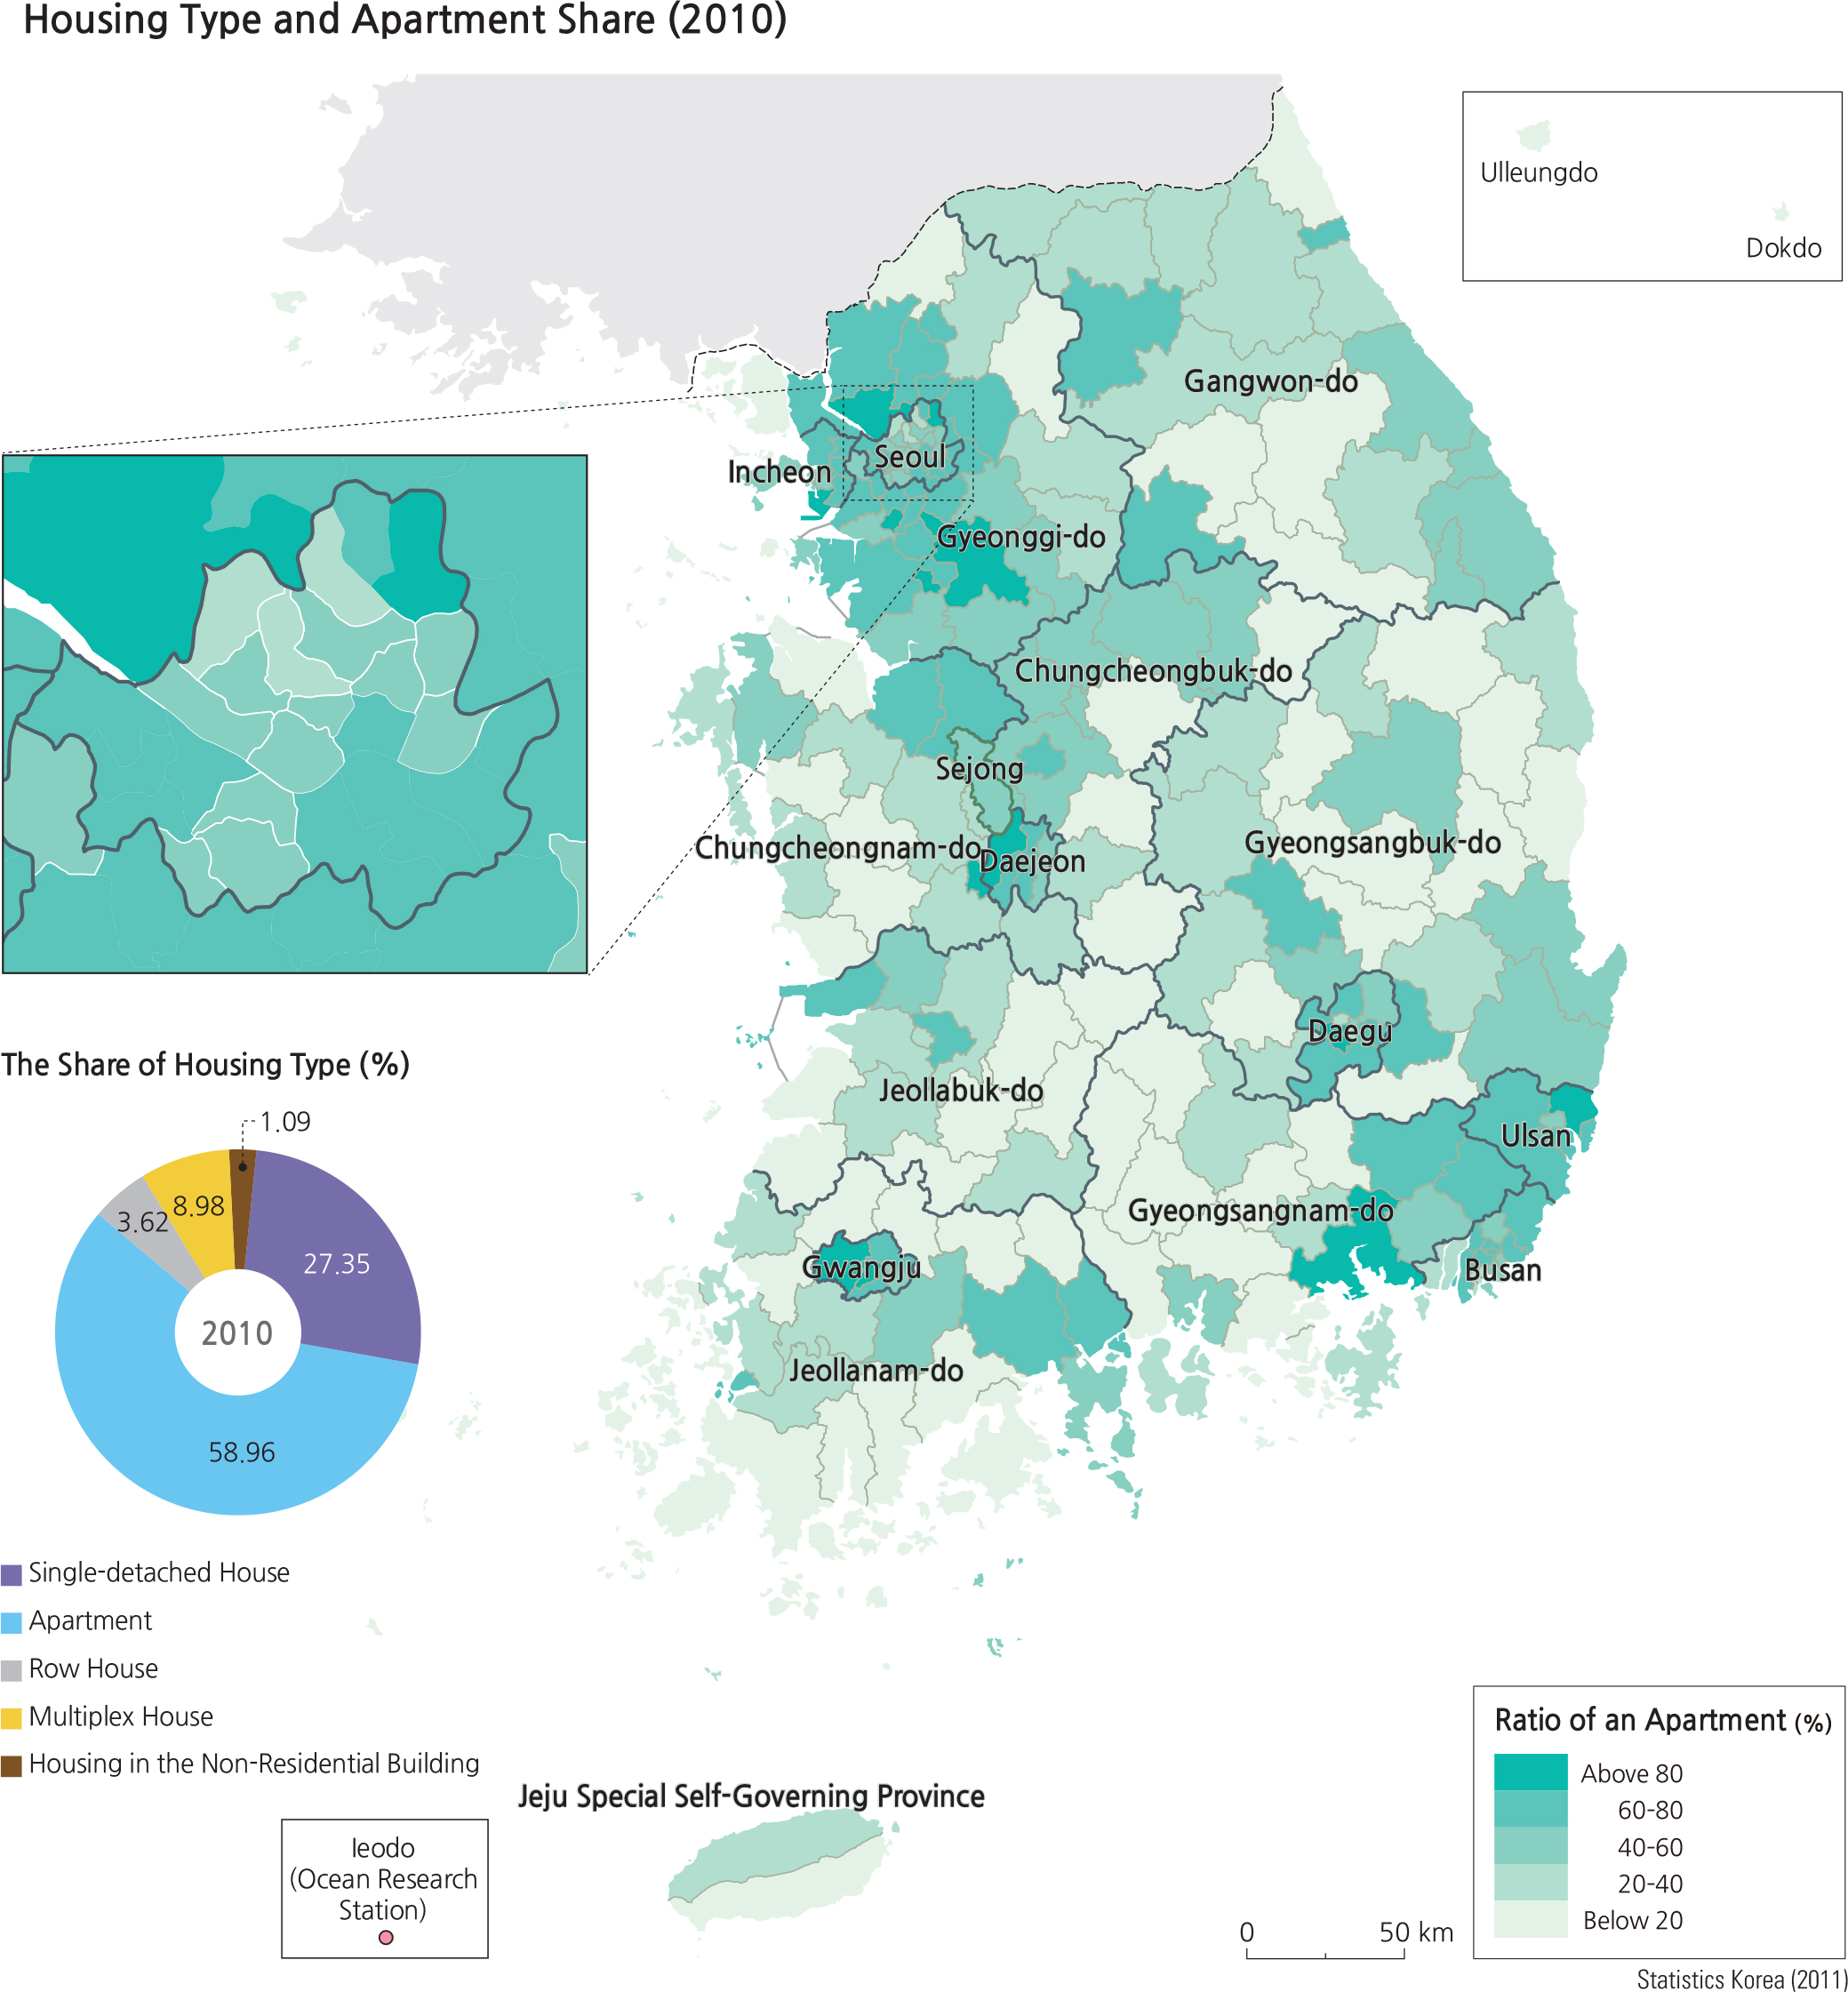
The 2010 Housing Type and Apartment Share map displays two sets of statistics: namely, map data pertaining to the percentage of apartments within each administrative unit at the -si/-gun/-gu level, and secondly, the percentage of each type of housing nationwide (as shown in sectors of a circle). The green colors on the map highlight very high percentages of apartments within administrative units. The spatial pattern of high apartment percentages correlates with urban centers while the lighter shades of green (representing lower percentages of apartments) are located in rural areas.
The sectors in the circle diagram depict that apartments make up 58.96 % of all housing units. The number of single detached houses still make up 27.35% nationwide, even though they are hardly visible in dense urban settings. The inset map enlargement of the Seoul area illustrates very high percentages of apartments with the exception of three administrative units.
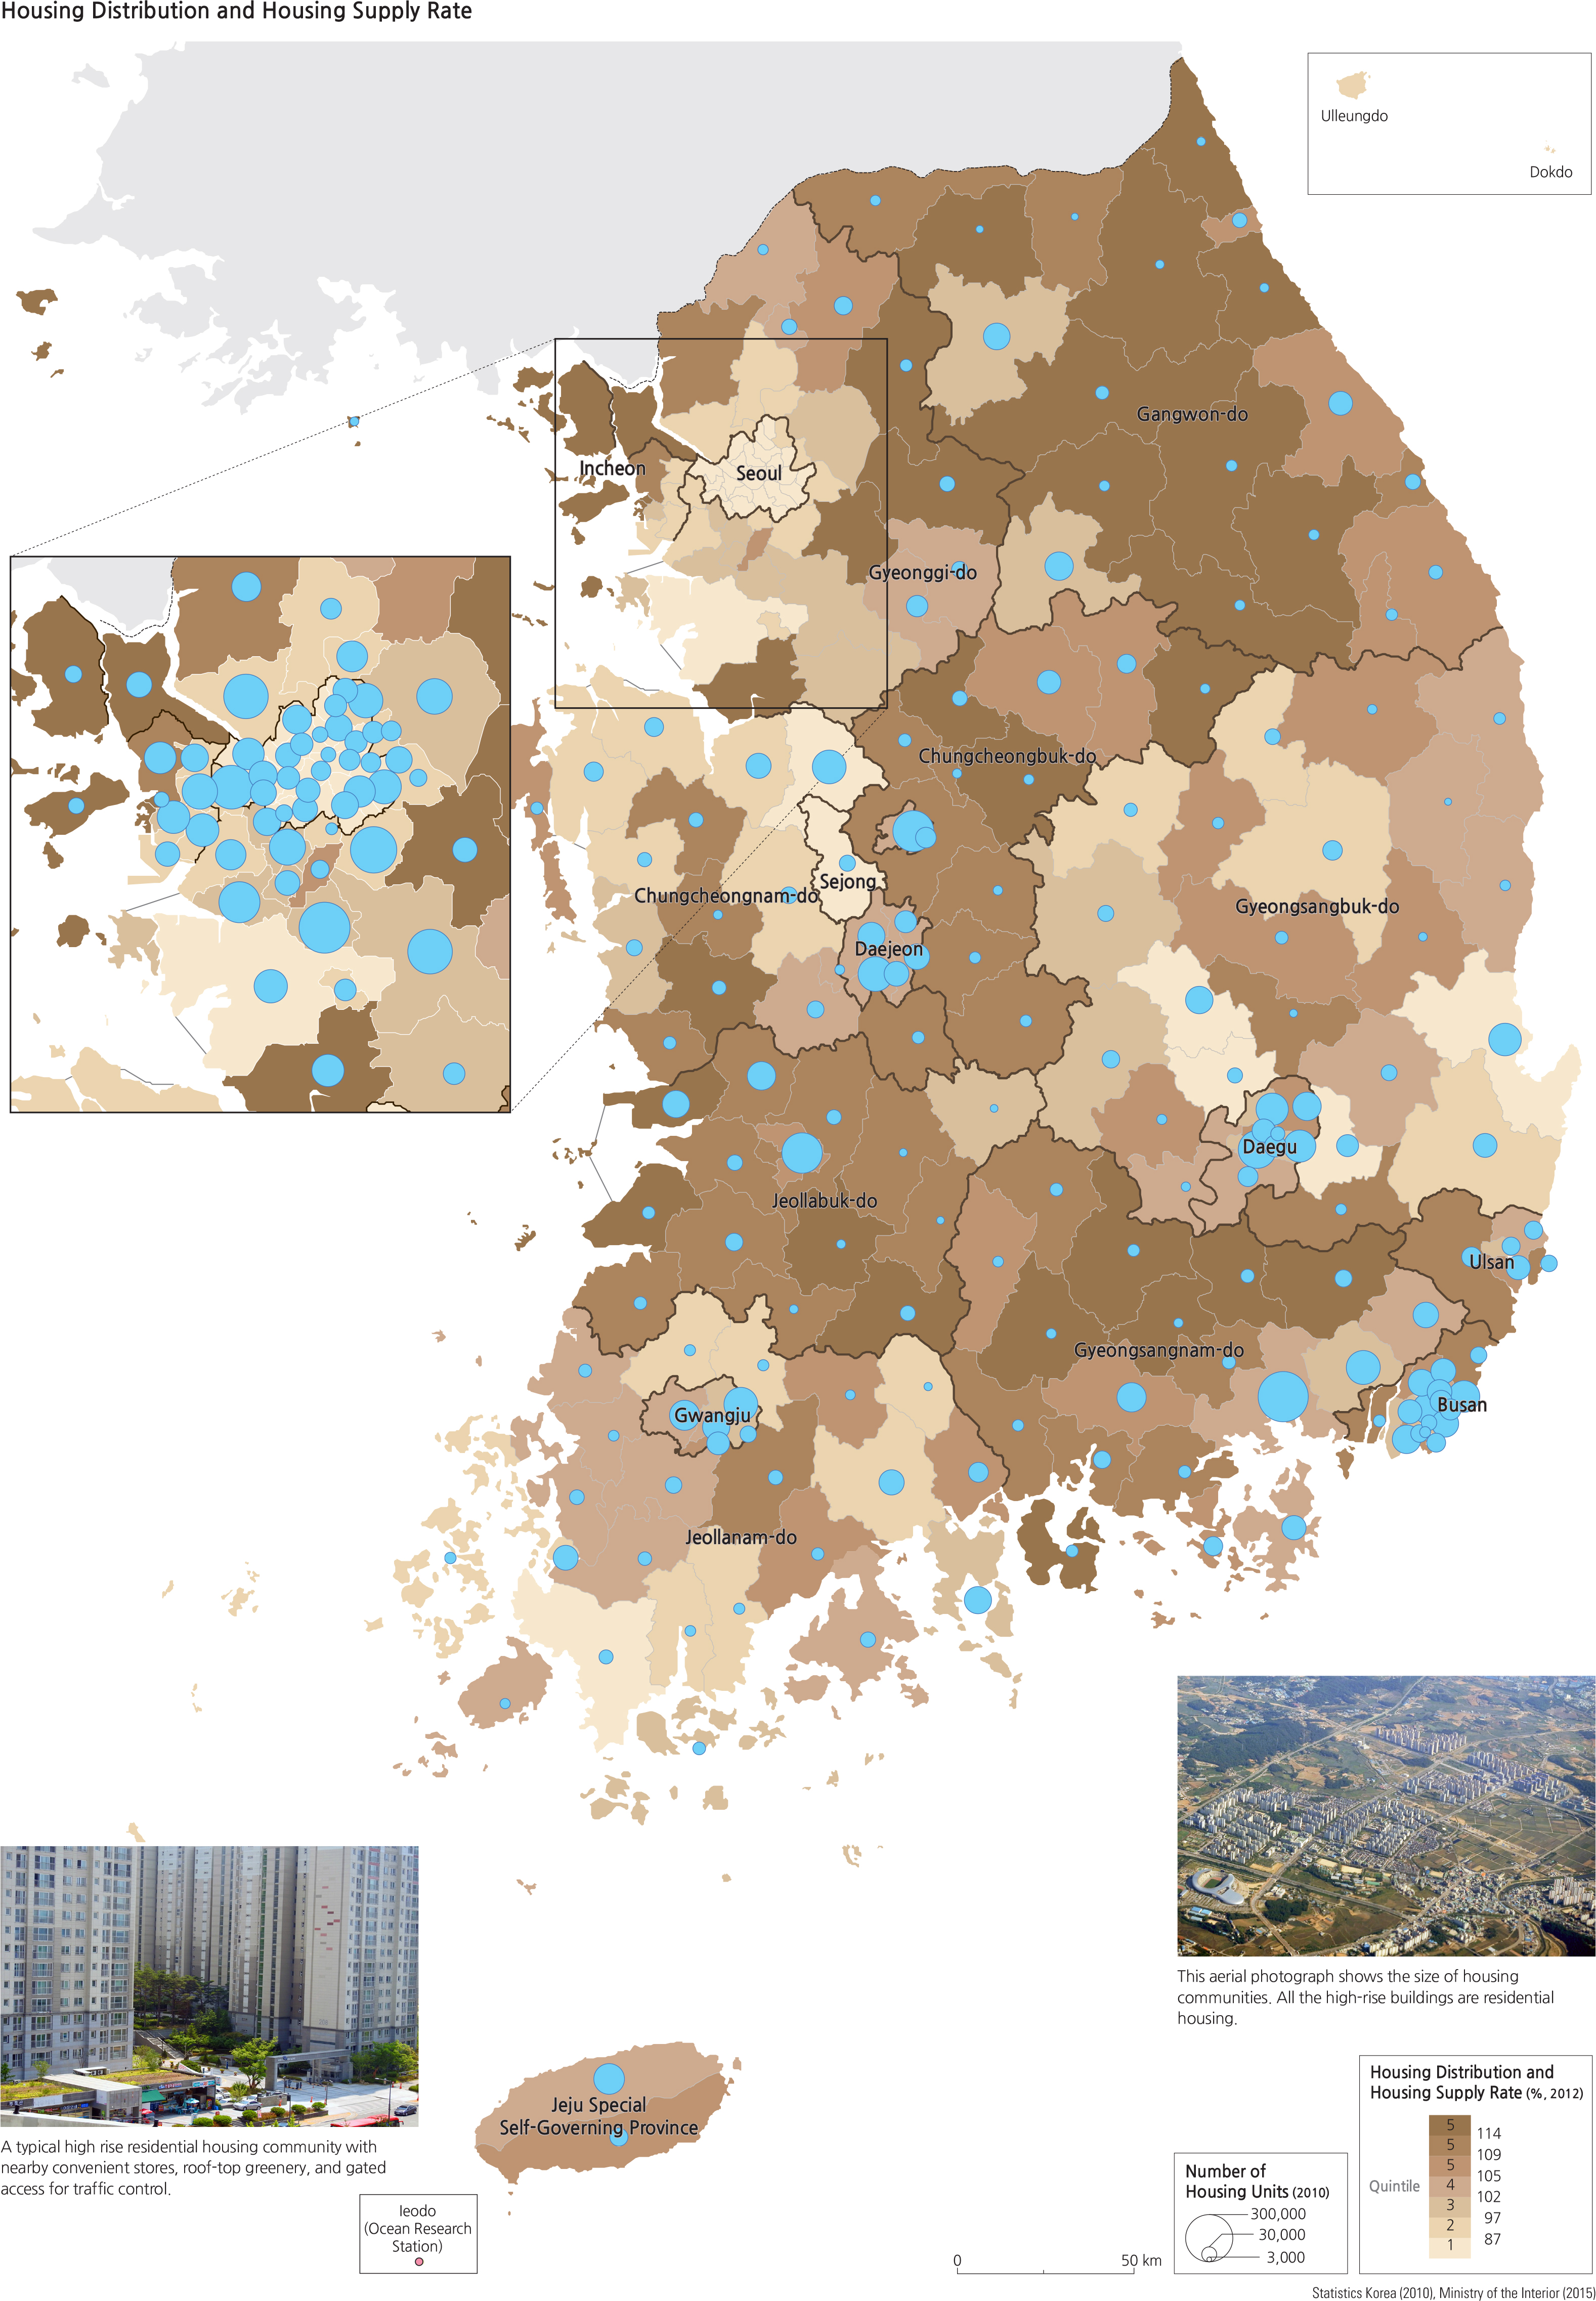
The Housing Distribution and Housing Supply Rate map displays the percentage of housing rate in 2012 by administrative units at the -si/-gun/-gu level with the quintile choropleth mapping method (refer to p.11 for the explanation of this mapping method). The map uses graduated circles to highlight the distribution of the number of housing units. The map legend shows three classes of administrative units that have a housing supply shortage represented by the three lightest shades of brown at rates of less than 87%, 87–97%, and 97–102%. Although theoretically one would expect a 100% rate is a breakeven point for the adequacy of housing supply, in reality, there needs to be a slightly higher percentage in order to be considered adequate because families of different sizes have different needs. The 102–105% class is considered ideal. Oversupply, of course, will lead to unoccupied housing units; three classes on the map (represented by the darkest brown shades) present classes of housing supply rates at 105–109%, 109–114%, and higher than 114%. The oversupply rate areas are associated with rural areas while the under-supplied rate areas are all urban areas.
From analyzing these two maps, where would you most likely invest in and build apartment buildings if you are entrusted with the task of locating sites to build and offer housing supplies to awaiting families? (Hint: search for the lightest brown areas with the least number of graduated circles that are small.)