Comprehensive Edition
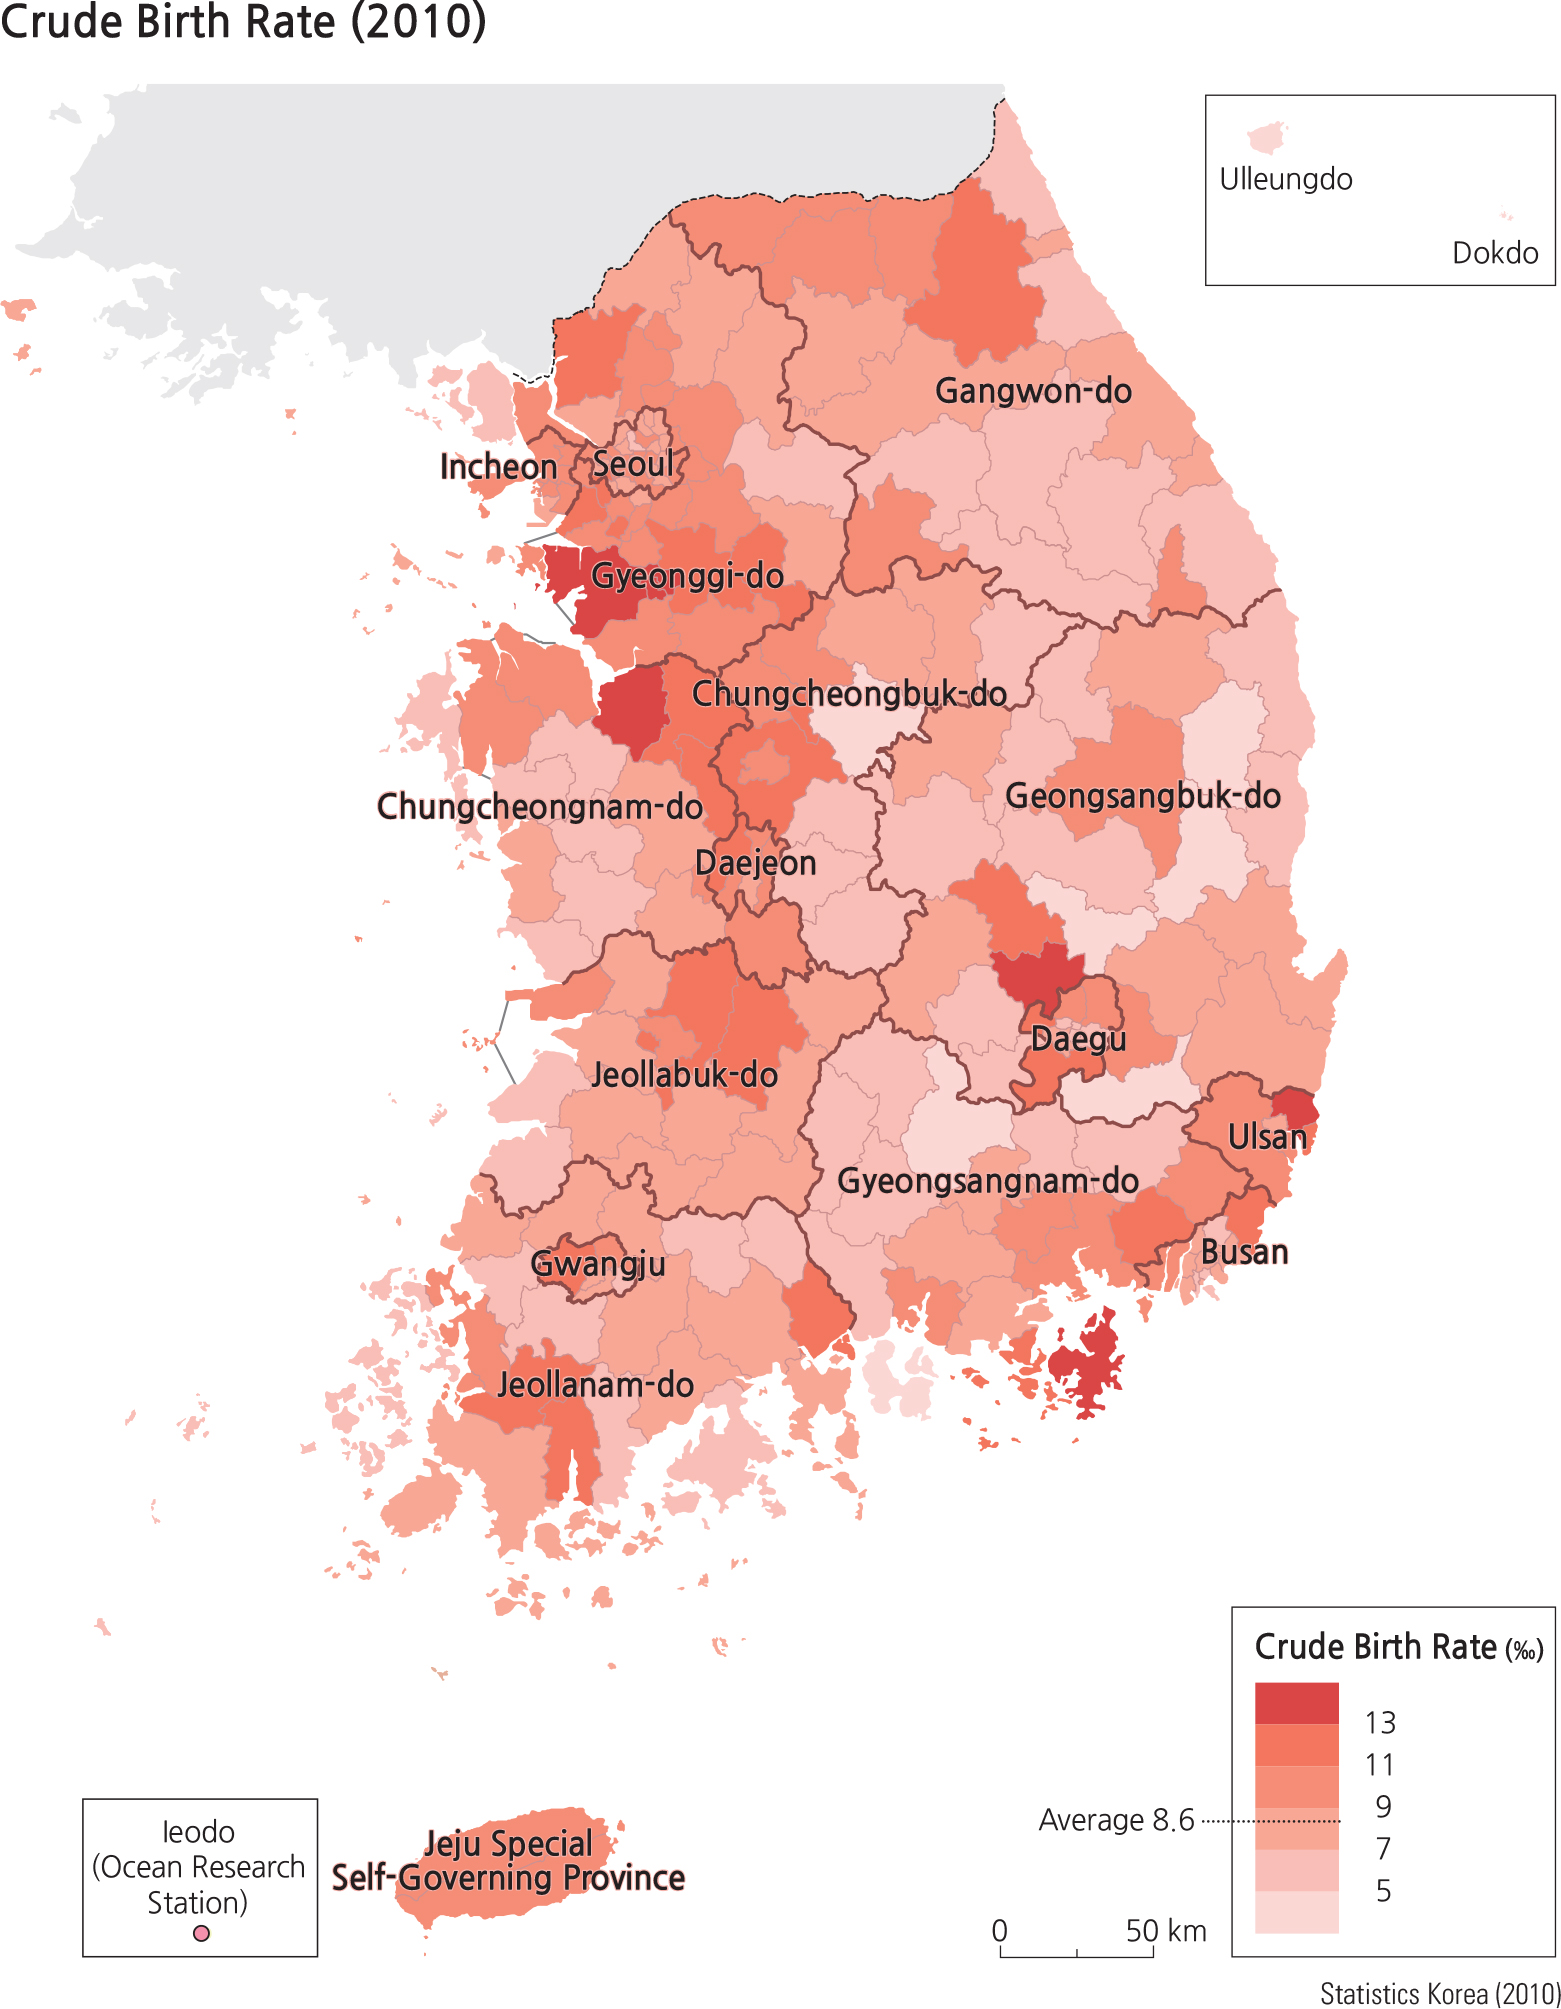
Population changes can be analyzed by tracking births, deaths, migrations, marriages, and divorces. These statistics, related to important life events, are collectively referred to as vital statistics. The total fertility rate, which refers to the number of children born per woman in her lifetime, remained above 4 until 1973. It gradually fell to 2.1 by 1983, and by the 2000s became one of the lowest in the world. It was 1.2 as of 2014. The low fertility rate is directly related to the crude birth rate, which is the number of births per 1,000 persons. The crude birth rate of South Koreais 8.6. Nevertheless, the crude death rate (the number ofdeaths per 1,000 persons) is 5.4. The rate of natural increase (the difference between births and deaths) is 3.2 per 1,000 persons. Metropolitan areas have higher total fertility rates, and the rates of natural increase are higher in the Greater Seoul Metropolitan Area, northern Chungcheongnam-do, and Busan-Ulsan regions.
The annual number of births in Korea continuously decreased over the years to 470,000 while the number of deaths slowly rose and reached 260,000 by 2010. Examining the sex ratios (the number of males to 100 females) by birth order, the sex ratio fell into the natural range (103–107 males per 100 females) for the first child. In the case of the third or later child, the sex ratio reached as high as 180 in 1995, which was recognized as a serious social issue; however, the situation was improved and dropped to 111by2010. Of total births, first children account for 50% whilechildren born third or later only account for 11%. In 1990, the largest percentage (54%) of mothers giving birth was in the 25-29 age group. In 2010, the largest percentage (46%) of mothers giving birth was in the 30–34 age group, which indicates that the age of mothers giving birth is becoming older in relation to the increase in age of marriage.
Compared with 1990, the number of deaths in 2010 increased by 14,000. However, the number of deaths decreased in the 0–69 age groups, and only increased in the 70 or older age group. The number of deaths among young people and the working age population has clearly decreased along with the advancement of medical technology, while the number of deaths in the elderly population has increased as Korean society becomes older.
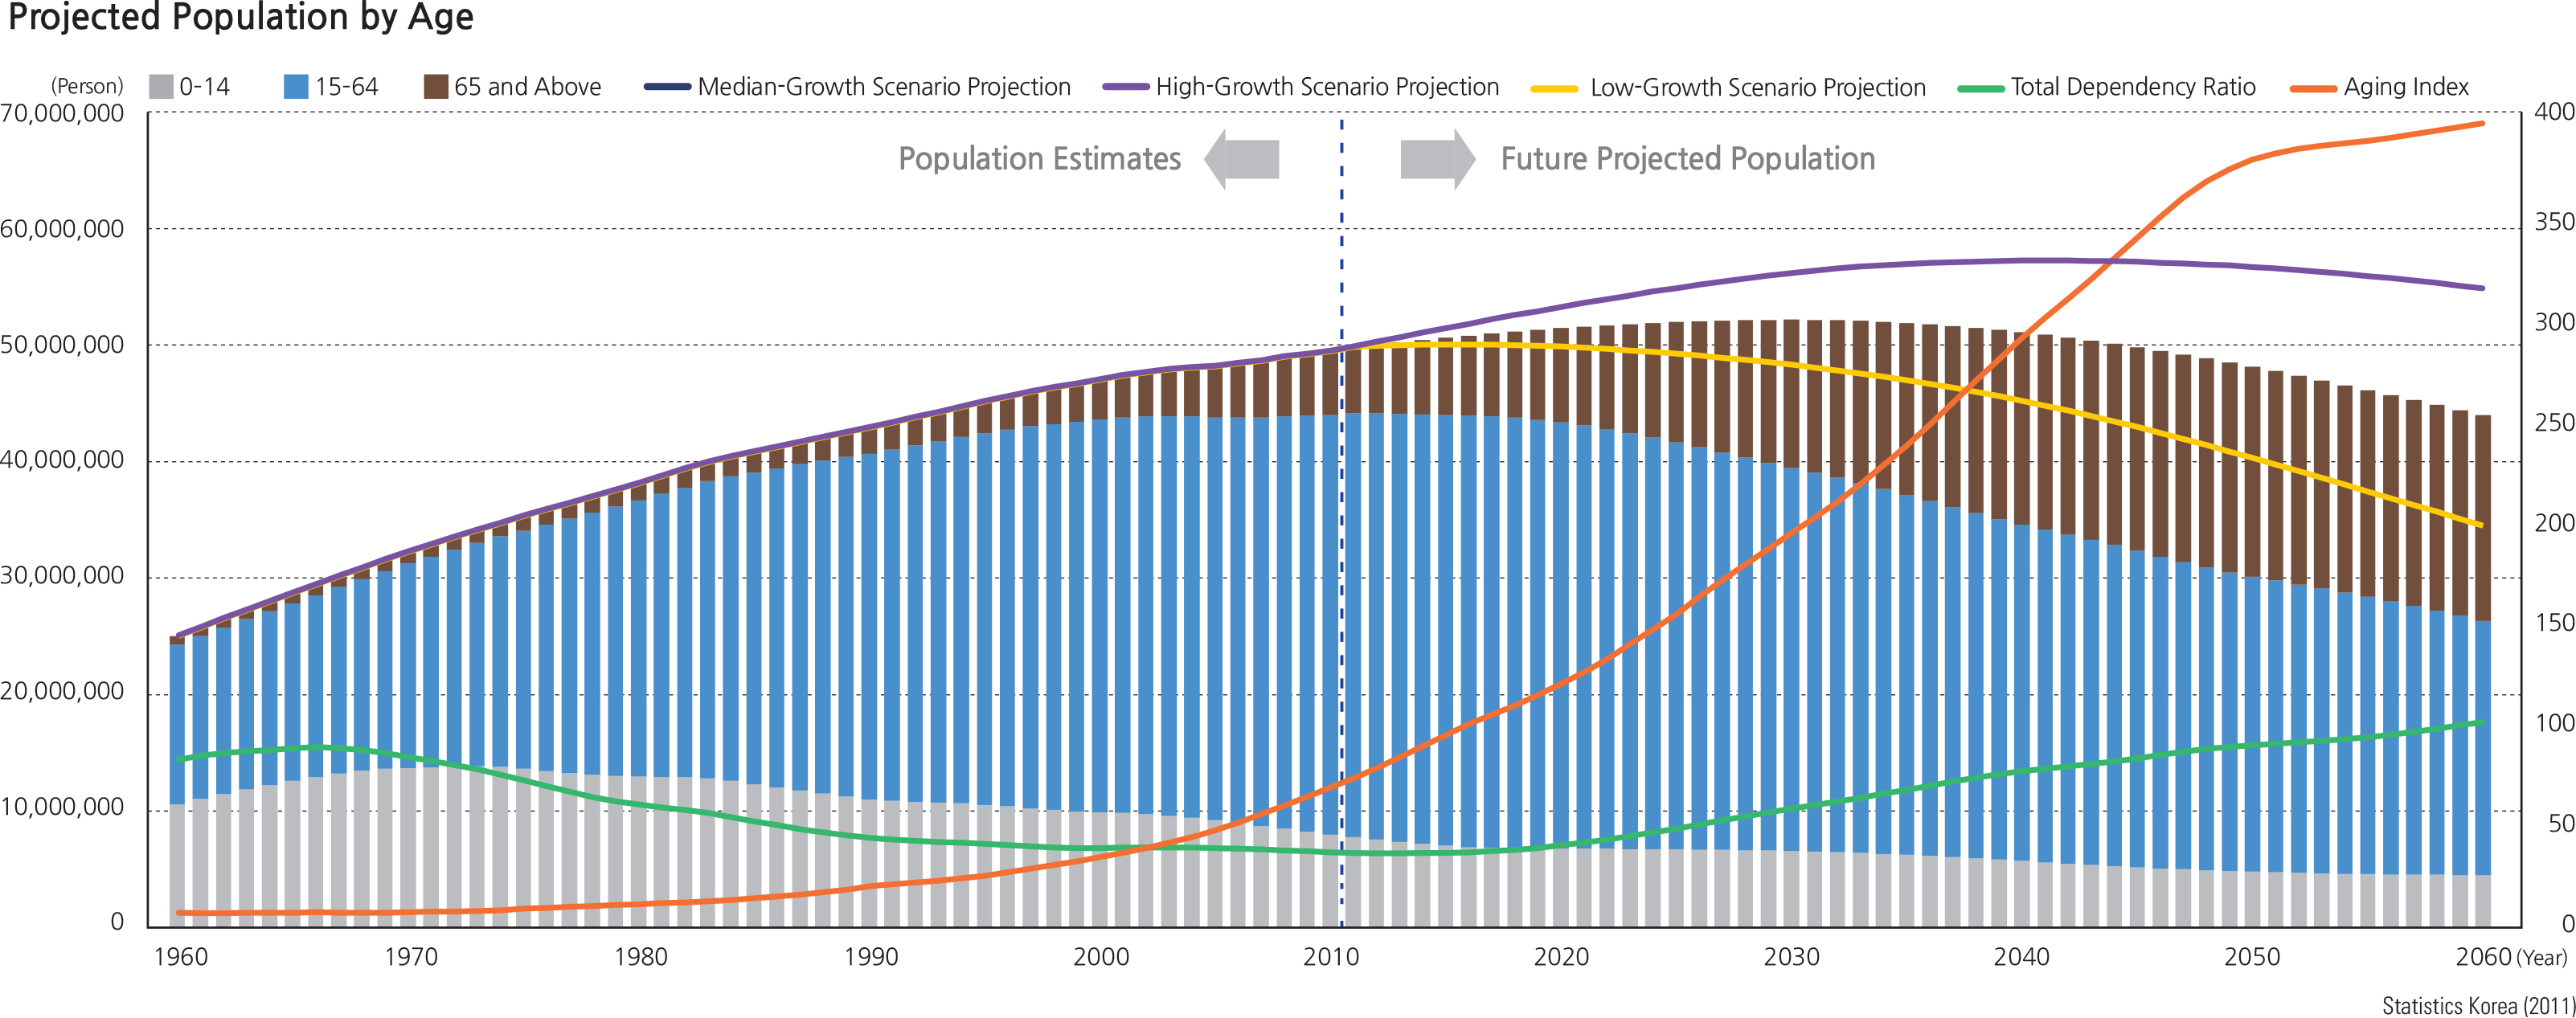
In 2011, Statistics Korea estimated and projected changes in the population structure through the year 2060 by gender and age. The estimation was made with the cohort component method using the 2010 population census data, along with the vital statistics and international migration data since 2005. Population estimation was conducted with three different growth scenarios: low-growth, median- growth, and high-growth. According to the low-growth scenario, the population will peak at 50.02 million in 2016, and then return to the 1974 level of 34.47 million by 2060. In the median-growth scenario, the population will increase from 49.41 million in 2010 to 52.16 million in 2030. Then it will decrease and return to the 1992 level of 43.96 million by 2060. In the high-growth scenario, the population will peak in 2041 at 57.15 million, then decrease to 54.78 million by 2060.
Brief Interpretation of the Maps
For the 2010 Total Fertility Rate map, the data shown in the legend ranges from less than 1 to higher than 1.8 with a national average of 1.2. Because these numbers refer to the average total number of children ever born in a woman’s lifetime, interpretation of spatial patterns becomes difficult. The mapped data refer to a specific year, 2010, while no consideration was taken to account for the pattern of migration of the women over their lifetimes. Thus, the map only represents the time frame of an instant and nota true lifetime geographic pattern. Nevertheless, the mapillustrates a general lower fertility rate in urban centers, but substantially higher fertility rates in suburbs.
The 2010 Rate of Natural Increase map depicts datafrom minus 5 or less to 5 or more per 1000 people with thenational average at 3.2. Thus, the significant increases are represented by the two darkes which produce a spatial pattern that is quite similar to the major lines in the transportation network and in urban areas and surrounding suburbs.
The 2010 Crude Birth Rate map shows data ranging from less than 5 to more than 13 births per 1000 persons with a national average of 8.6. This map correlates very highly with the 2010 Total Fertility Rate map in spatial arrangement. Of course, one would expect higher crude birth rates in places of higher total fertility rates.
The 2010 Crude Death Rate map displays data ranging from less than 5 to more than 13 deaths per 1000 persons with a national average of 5.4. This map has a distinctly different spatial pattern than the Crude Birth Rate map.While crude death rate is low in the urban areas, it is high inthe rural areas where the bulge of the population pyramid is in the older groups.
The Projected Population by Age chart makes projections of future population based on low, medium, and high population growth rates into the year 2060. In all three scenarios, population decline is expected. Also shown is the structure of three age groups, 0-14, 15-64, and 65 and above, corresponding to a school-age group, a labor force group, and a retirement group. These projections provide a glimpse into the kind of policies that may need to be implemented to mitigate future imbalances in numbers of schools and teachers, income levels for workers, and retirement welfare for the aged.
Given the disparity between urban and rural areas in birth, death, fertility, and natural increase rates, how important is it to consider an evenly distributed pattern of health care clinics and hospitals so as to minimize the disparity between easy urban access (better health care and better facilities) and longer travel to reach rural health facilities that mayonly be able to provide minimal health care? Do NorthAmerican countries face the same problem?
|