Comprehensive Edition
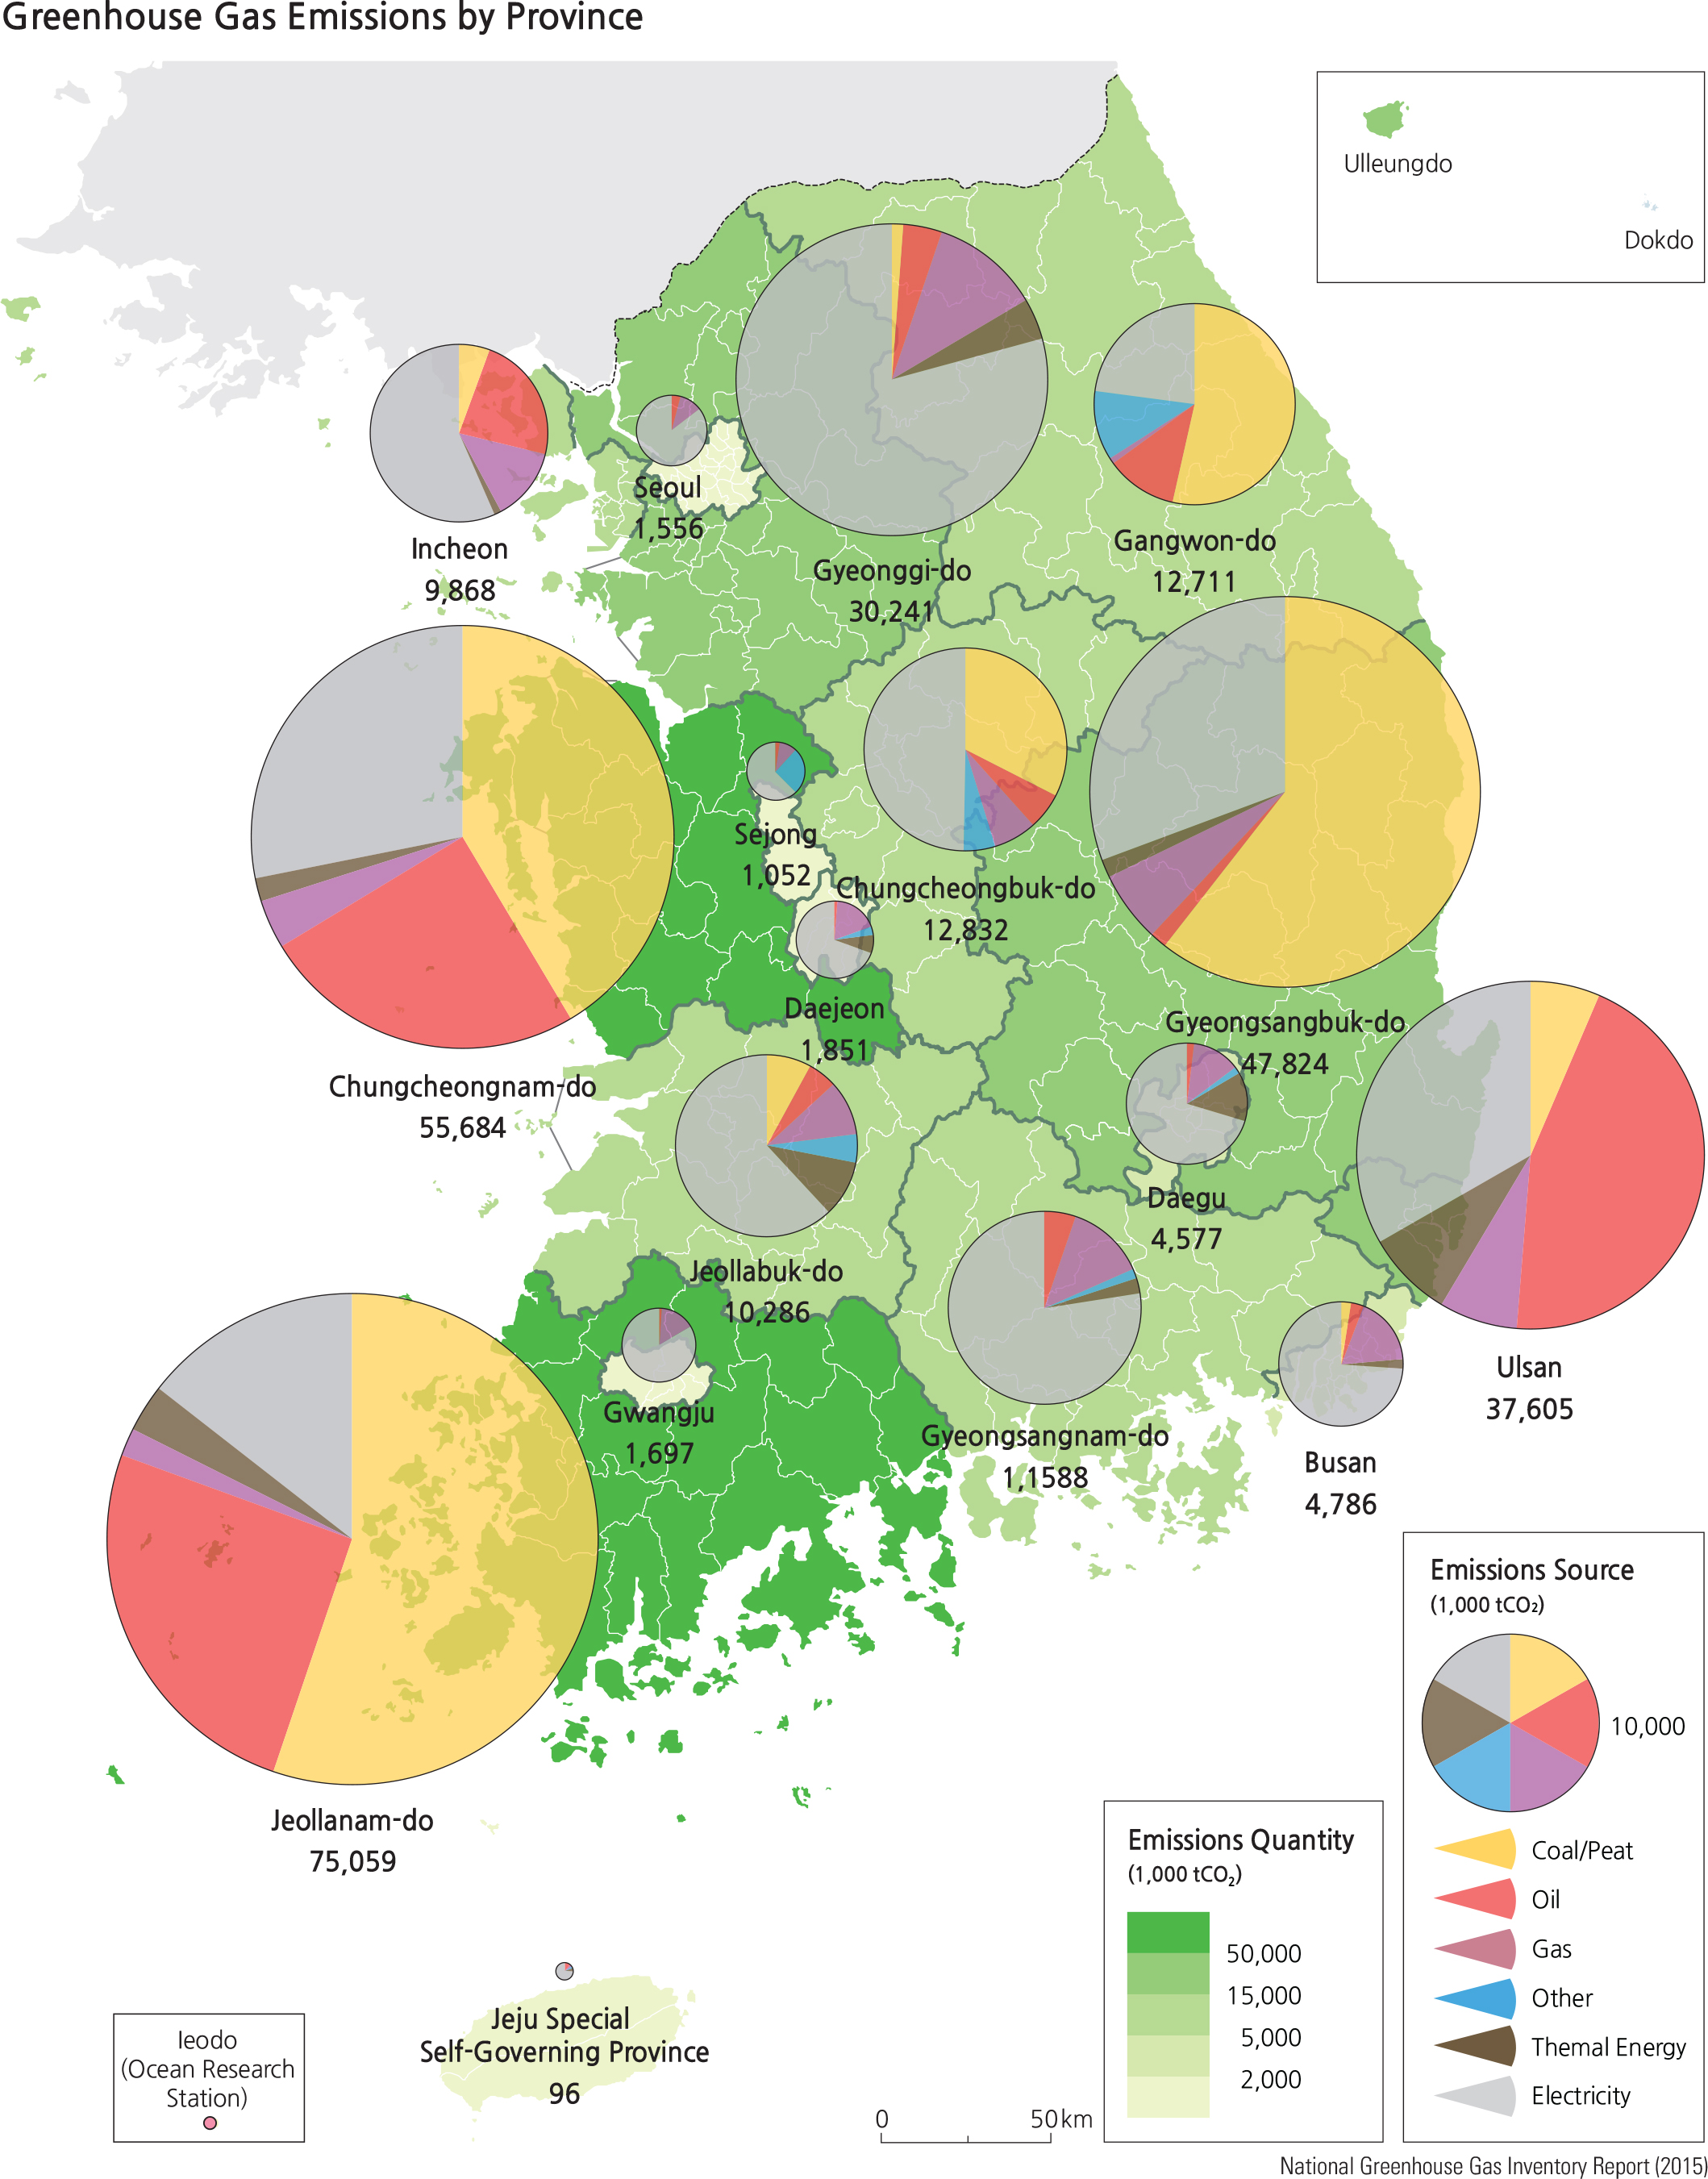
While greenhouse gases may not necessarily be considered as air pollution, Korea has a vested interest in monitoring the amounts of emissions because of the direct effects of these gases on global warming. The 1996 and 2006 Intergovernmental Panel on Climate Change (IPCC) guidelines for national greenhouse gas inventories provided international standards for national greenhouse gas (GHG) emissions estimations. The current national GHG inventory of Korea has been formulated according to the 1996 IPCC guidelines. The government established the Greenhouse Gas Inventory and Research Center of Korea (GIR), which conducts monitoring and research on GHG emissions and reduction strategies. The total GHG emissions in 2013 were recorded at 694.5 million tons of carbon dioxide (CO2) equivalent. This represents an increase of 137.6% compared with 292.3 million tons CO2 equivalent in 1990, and 1.5% compared with 684.3 million tons CO2 equivalent in 2012. Net emissions were recorded at 651.7 million tons CO2 equivalent as of 2013, representing an increase of 152.5% compared with 258.1 million tons CO2 equivalent in 1990, and 1.9% compared with 639.5 million tons CO2 equivalent in 2012. The energy sector accounted for the largest portion in 2013 at 606.2 million tons CO2 equivalent (87.3% of total GHG emissions), followed by the industrial processes sector at 52.6 million tons CO2 equivalent (7.6%), the agricultural sector at 20.7 million tons CO2 equivalent (3.0%), and the waste sector at 15.0 million tons CO2 equivalent (2.2%). Brief Interpretation of the Map The Greenhouse Gas Emissions by Province map shows two sets of spatial data: 1) emissions quantity and 2) emissions source by energy sectors. Both of these datasets are in units of thousands of tons of carbon dioxide. Although the title of the map specifically addresses “reenhouse gas”emissions, the only greenhouse gas that is mapped here is carbon dioxide; all other greenhouse gases (water vapor, carbon monoxide, methane, and ozone) have not been included on this map. The title also specifies “y province”which should really be “y administrative units”as metropolitan cities are also used as data collection base units (e.g. Incheon, Seoul, Ulsan, and Busan). The map shows Jeollanam-do Province as the largest emitter, followed by Chungcheongnam-do, then by Gyeongsangbukdo, and by Ulsan as the four largest emitters. The energy sectors map legend information shows that the highest use of coal-peat and oil are, by far, the highest contributors of carbon dioxide emissions. These administrative units also coincide with petroleum, chemical, and energy industries. All metropolitan cities, other than Ulsan, appear to produce little contribution to carbon dioxide emissions. Can you suggest a reason why this is the case? Do you expect to find large heavy industries or chemical industrial plants or petroleum processing plants located in urban centers? Provide the rationale for your answers.
|