Since the 1960s, the Korean industrial structure has changed from traditional agricultural-, forestry-, and livestock-based primary industries to manufacturing-based secondary industries led by the government's manufacturing promotion policies. But manufacturing reached its peak in the 1990s and in the mid-2010s service industries are growing continuously and have become the main foundation of the Korean economy.
Service industries provide non-material products including commerce, food and lodging services, tourism, transportation, communication, finance, real estate, health and medical care, and so forth. Unlike manufacturing, the final products of service industries are non-material.
The spectrum of service industries is almost limitless as it includes all types of economic activities that satisfy human desires apart from material goods. The activities are diverse and vary from simple labor to complex knowledge dissemination, and from satisfying individual needs to assisting with various other production activities. Moreover, as the scale of the economy gets larger and the standard of living improves, the demand for various service sectors becomes more diverse and rapidly-changing. The categories of service industries have expanded and the activities have become more complex. Producer services, those services assisting a business in conducting its operations, have gained more attention in recent years and play more important roles as they produce new jobs by counterbalancing the job losses that were created by the declining manufacturing sector. Producer services are also important because they provide high technology jobs for other industrial activities.
Such vast and complex industrial service categories can be classified in a myriad of ways. They include service industries that handle the distribution of already produced goods such as in retailing and wholesaling; transportation and communication; and finance, insurance, and real estate that manages wealth and finance. Service industries were also extended to include other personal services that satisfy individual service activities as well as business services that help other producer services, and public services that help individuals and the public to participate in economic activities. A more common classification of service industries is the division by groups that demand services (i.e., consumer services and business services). The categories of consumer services include retail, lodging,
leisure and tourism industries, personal services, and public services. Producer services include transportation, warehousing, financing, insurance, real estate, research and development, and advertising.
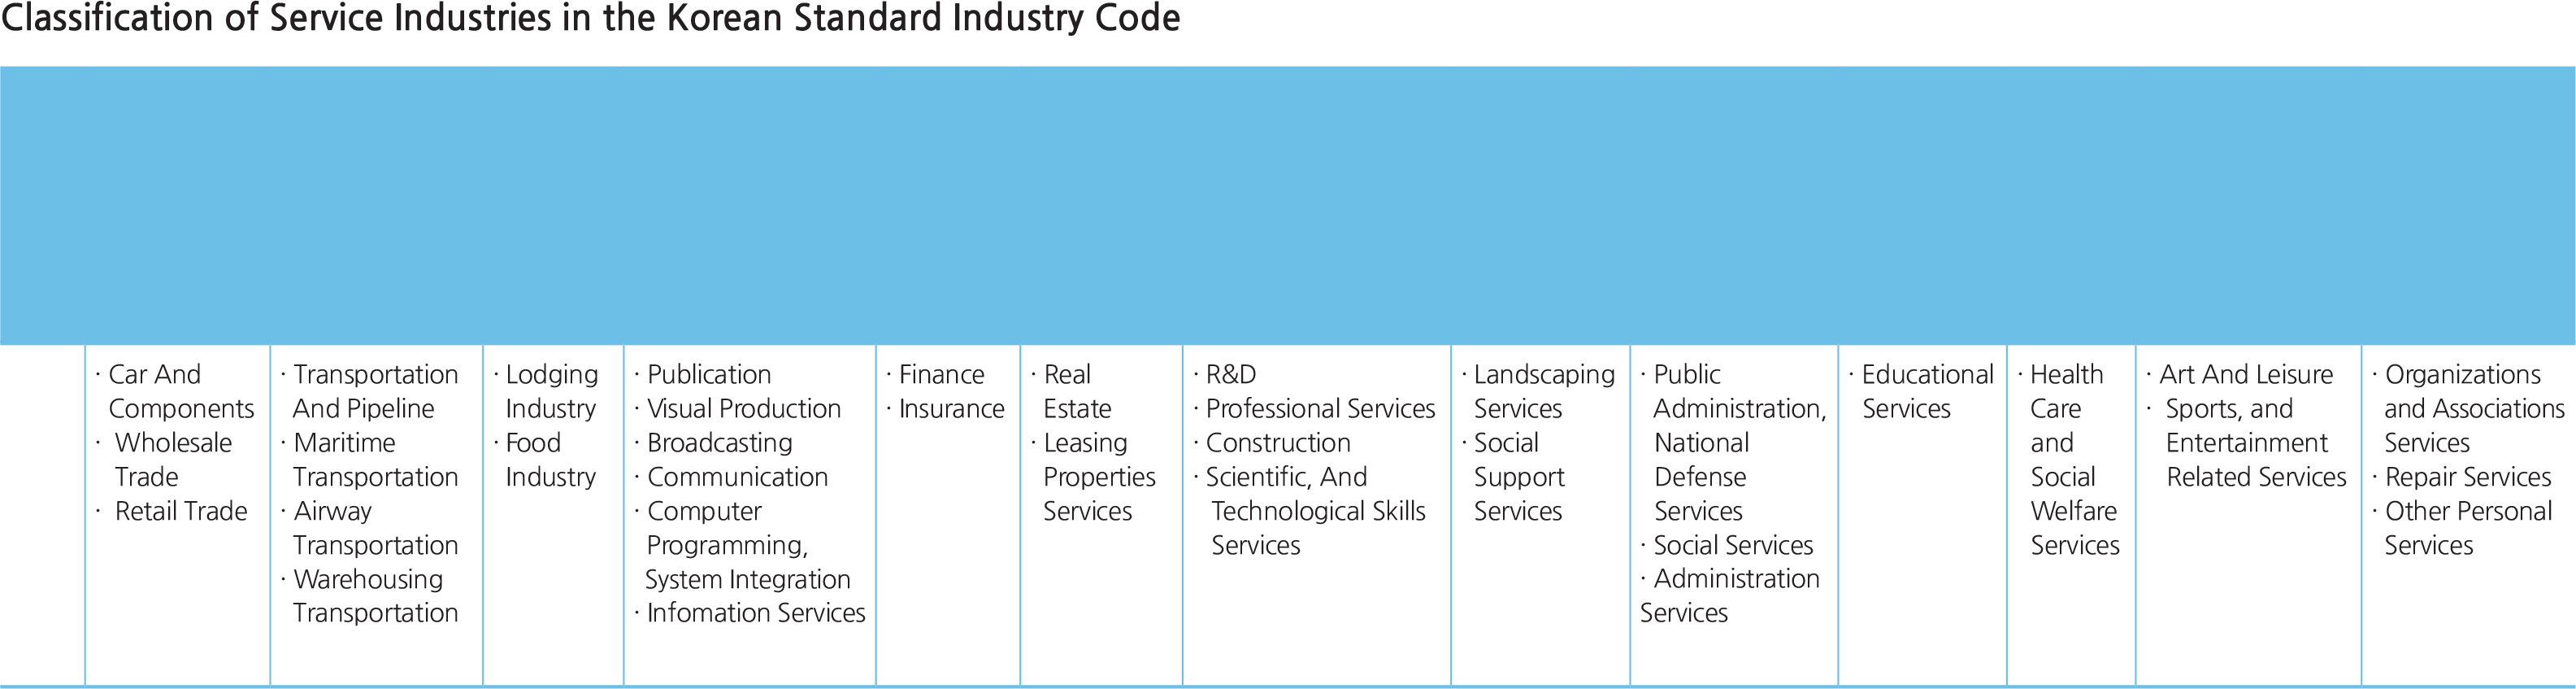
According to the KSIC (Korean Standard Industry Code) classification by the Bureau of Statistics, the service industries of Korea can be divided into 13 classifications: wholesale trade and retail trade services; transportation services; lodging and food industries; publication, visual production, broadcasting communication, information services; finance, insurance, real estate, and leasing properties services; professional, scientific, and technological skills services; social support services; public administration, national defense, and social services administration services; educational services; health care and social welfare services; art, sports, and entertainment related services; organizations and associations services; and repair and other personal services.
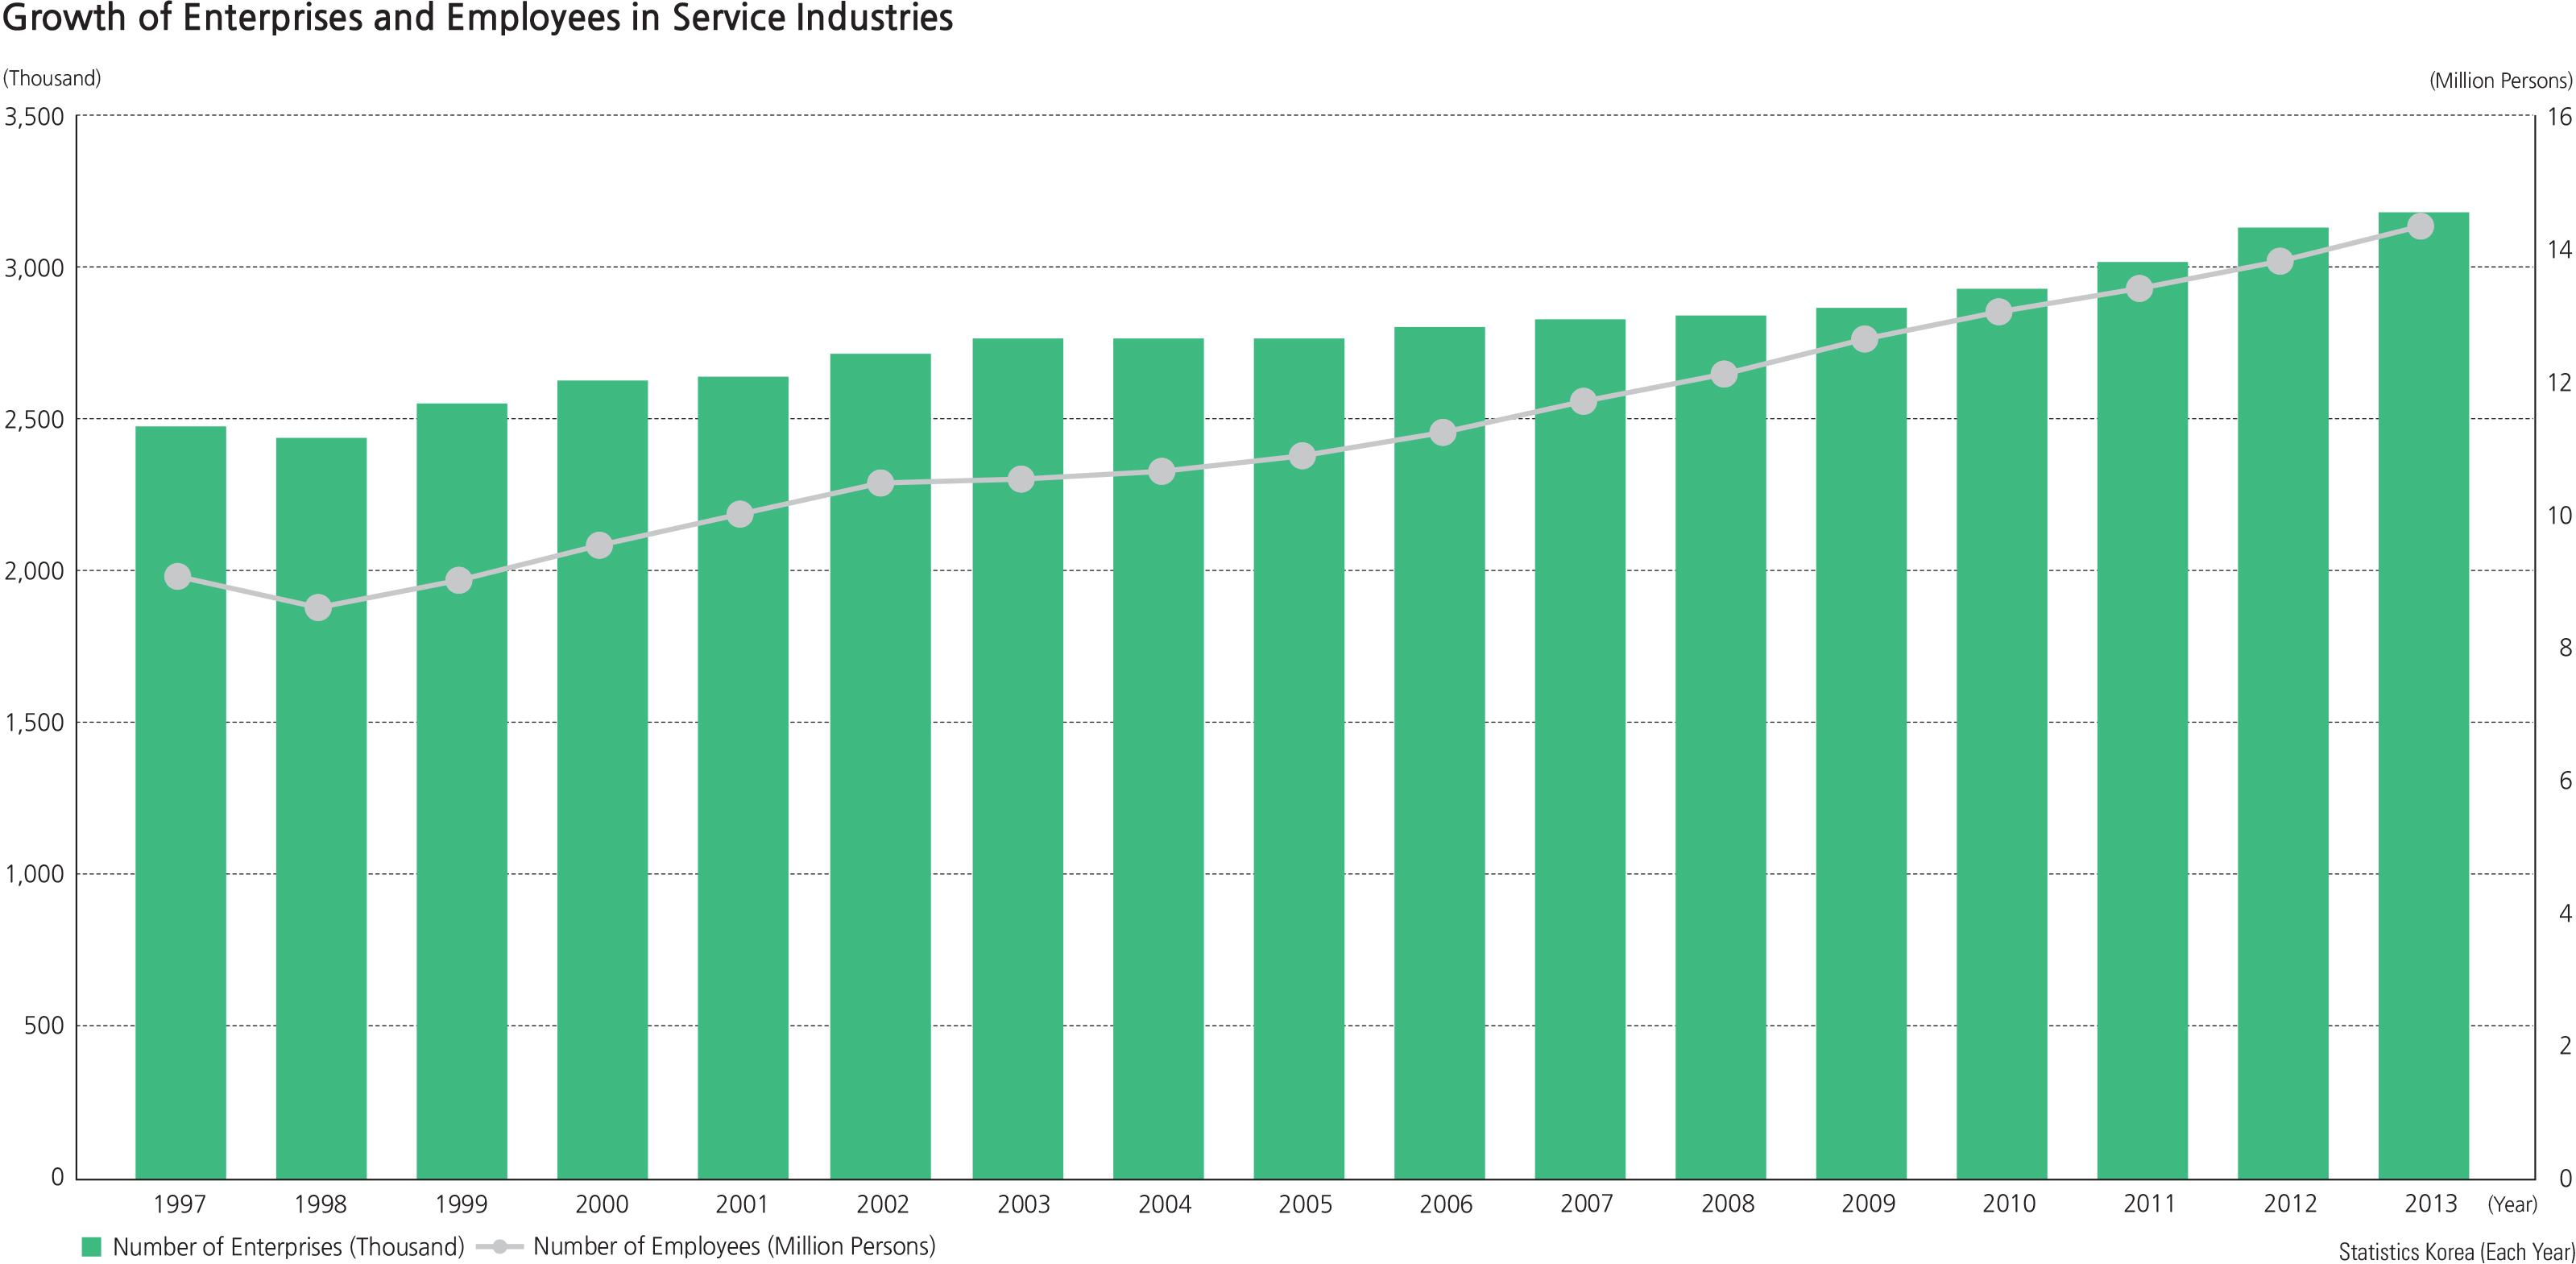
Service industries have continued to grow, even today. In 2013, the number of service industry business establishments had reached 3.2 million and accounted for
86.6% of the total number of industrial establishments. There were 14.2 million service workers, 74.1% of the total number of employees. The total sales for service industries were about 2 trillion US dollars, 51.2 % of the total industrial sales. The service industry has continued its steady growth annually with the exception of the economic crisis of 1997.
When comparing service industry employment among the greater metropolitan areas and provinces, the number of service employees in Seoul is 3.93 million, or 28.7% of the total number of service employees. Gyeonggi-do had 2.73 million (19.9%) and Busan had 0.99 million (7.2%). About half of the service workers are concentrated in the Greater Seoul Metropolitan Area (Seoul and Gyeonggi-do), which is similar to the geographic distribution of the population. The average number of employees per service establishment in 2013 was 4.5 persons, indicating that small businesses are the norm. In terms of the number of employees by the size of establishment, small businesses with fewer than 10 employees accounted for about 46.9%; establishments with 10-299 employees accounted for 41.1 %, indicating that most service establishments are small- and medium-sized businesses.
Brief Interpretation of Map and Graphics
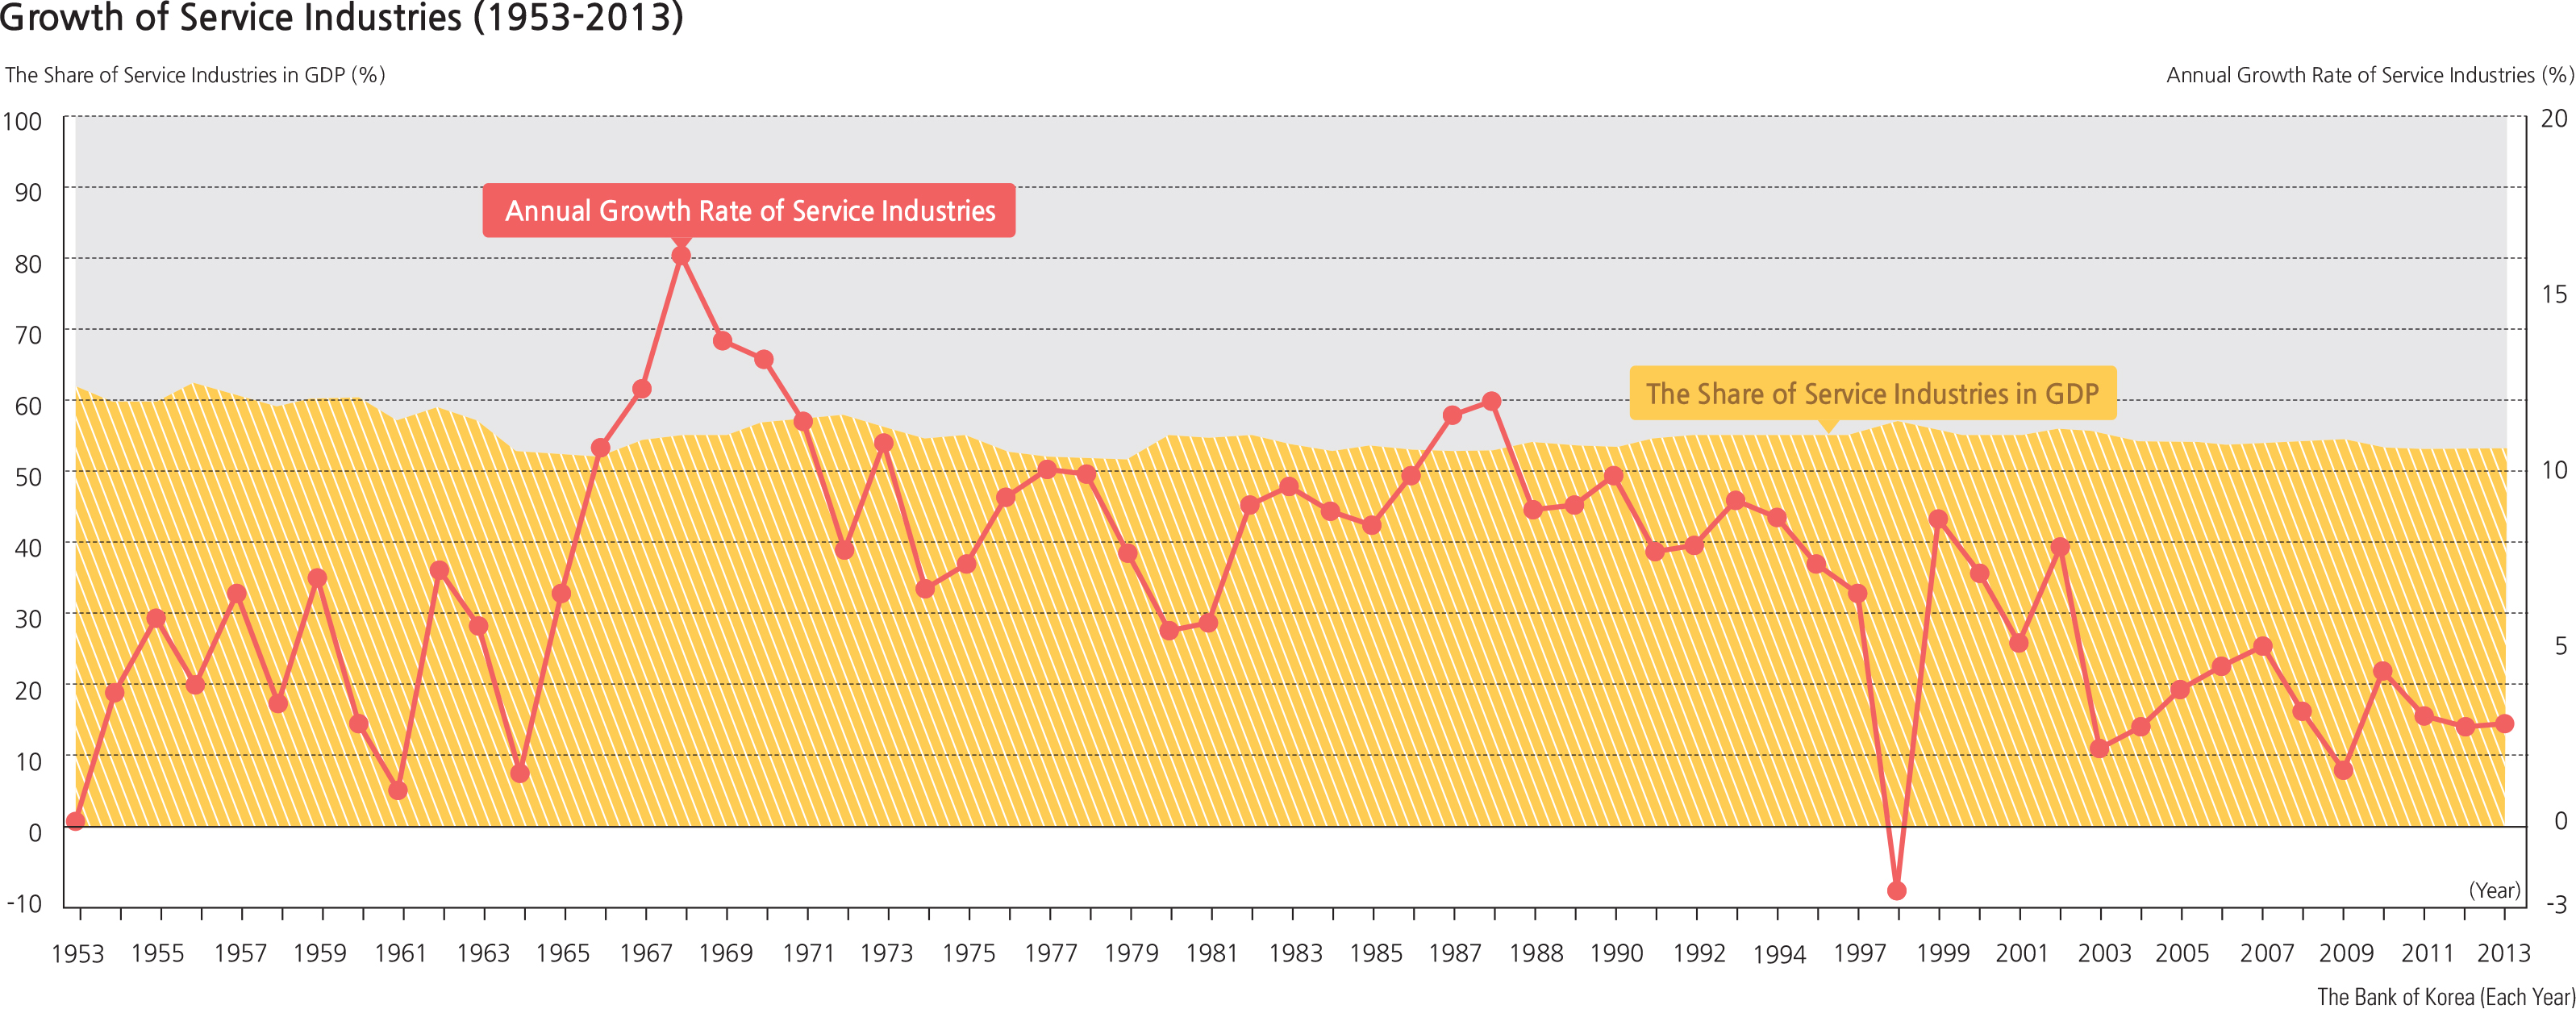
The statistics relating to the growth and status of Service Industries in South Korea show some very interesting contrasts and changes. The long central graph plots the percentage annual growth rate against the percentage share of services industries in the annual Gross Domestic Product. The graph shows a pattern of spikes and valleys throughout the period from 1953 until 2013. There was a large spike in 1968 and then a general decrease until the present. However, the percentage of GDP hovered between approximately 11 or 12 percent for the whole period indicating a continuous growth of the value of the service sector since the GDP has grown throughout that period.
The lower right graph shows the growth of enterprises plotted against the growth of employees in the period from 1997 to 2013. This graph shows a slowing growth of the number of enterprises in the period but an increasing growth in the number of employees. It reflects an increasing rate of employment for existing enterprises which also indicates increasing levels of business in current firms. The map shows that there is a degree of stability in the Service sector. Over 70% of the firms nationwide are of the very small to medium-sized category and over 40% of the enterprises are classed as “Petty” or very-small with less than four employees. This indicates that while the Service sector is very large, the largest sector in the country, there is a continuous potential for the establishment of new
enterprises as part of the normal attrition of older small firms.
There are relatively few high value-added employee sub-districts in South Korea, with most concentrated on the northern-most areas along the DMZ. What factors might be assumed to be a part of these high value-added per employee areas? The Seoul Metropolitan shows the largest number of employees in small and medium-sized enterprises, while Busan has many fewer employees in these categories. What might account for these differences in these relatively large urban areas?