English III
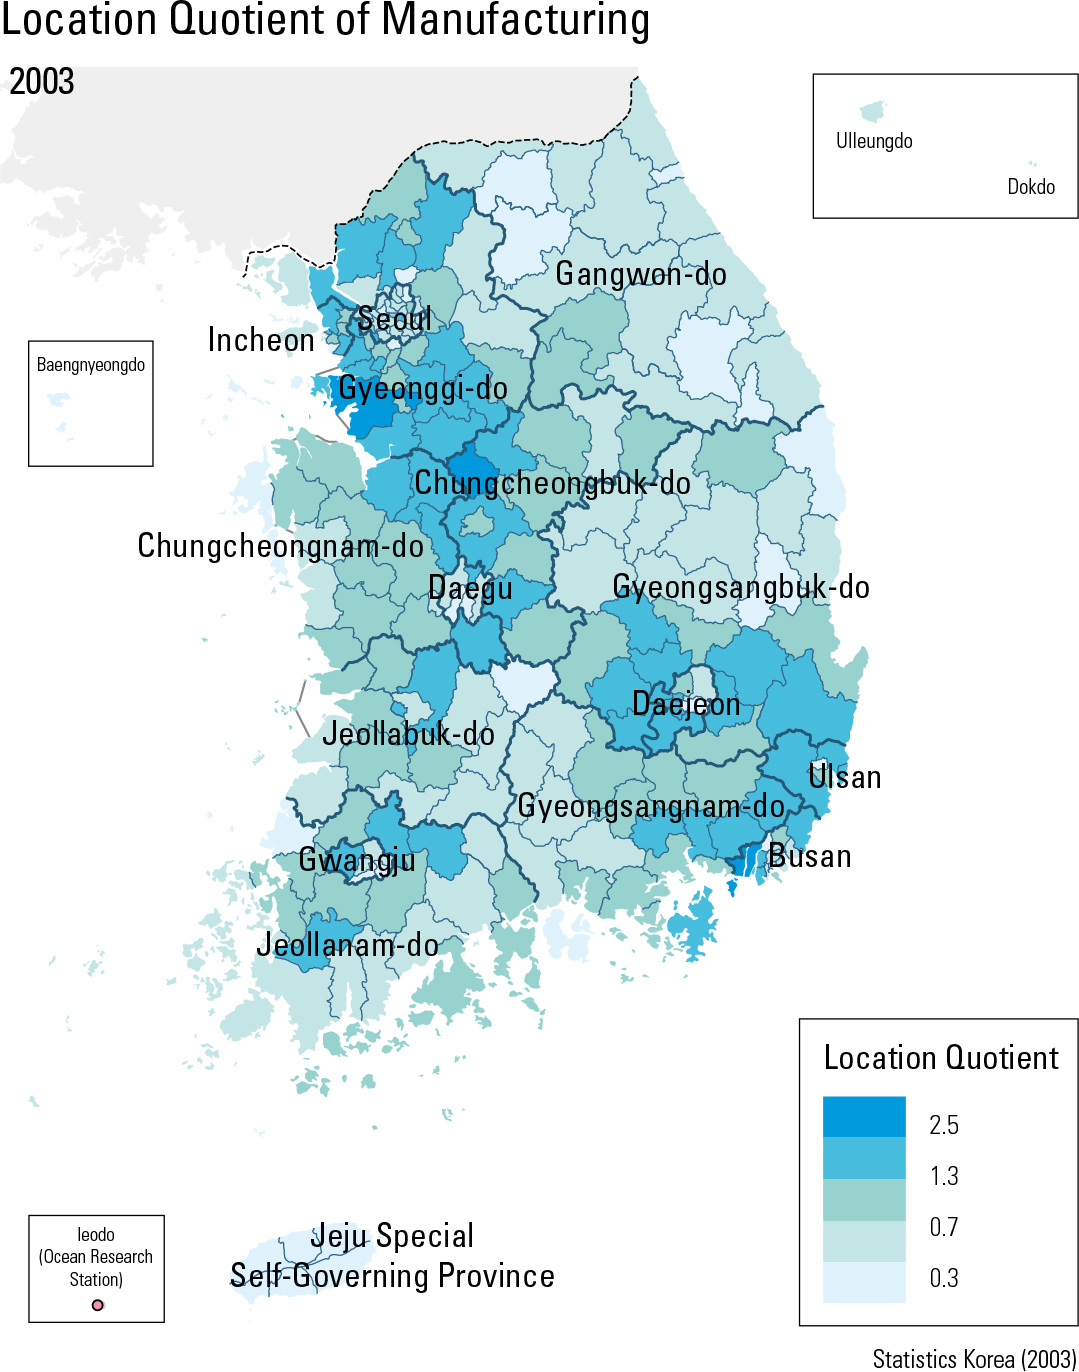
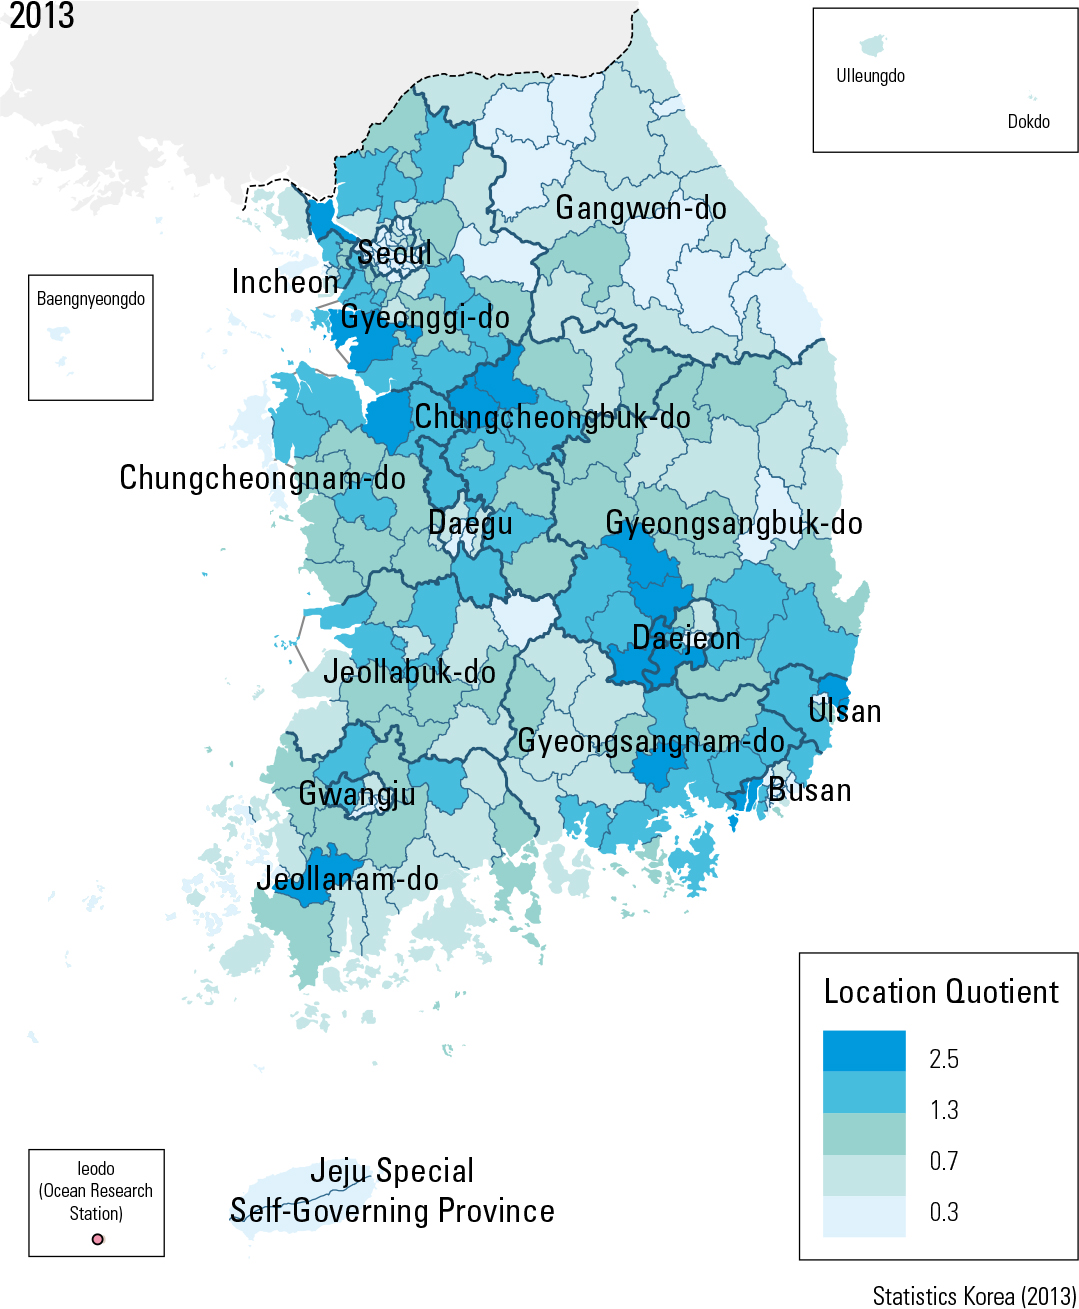
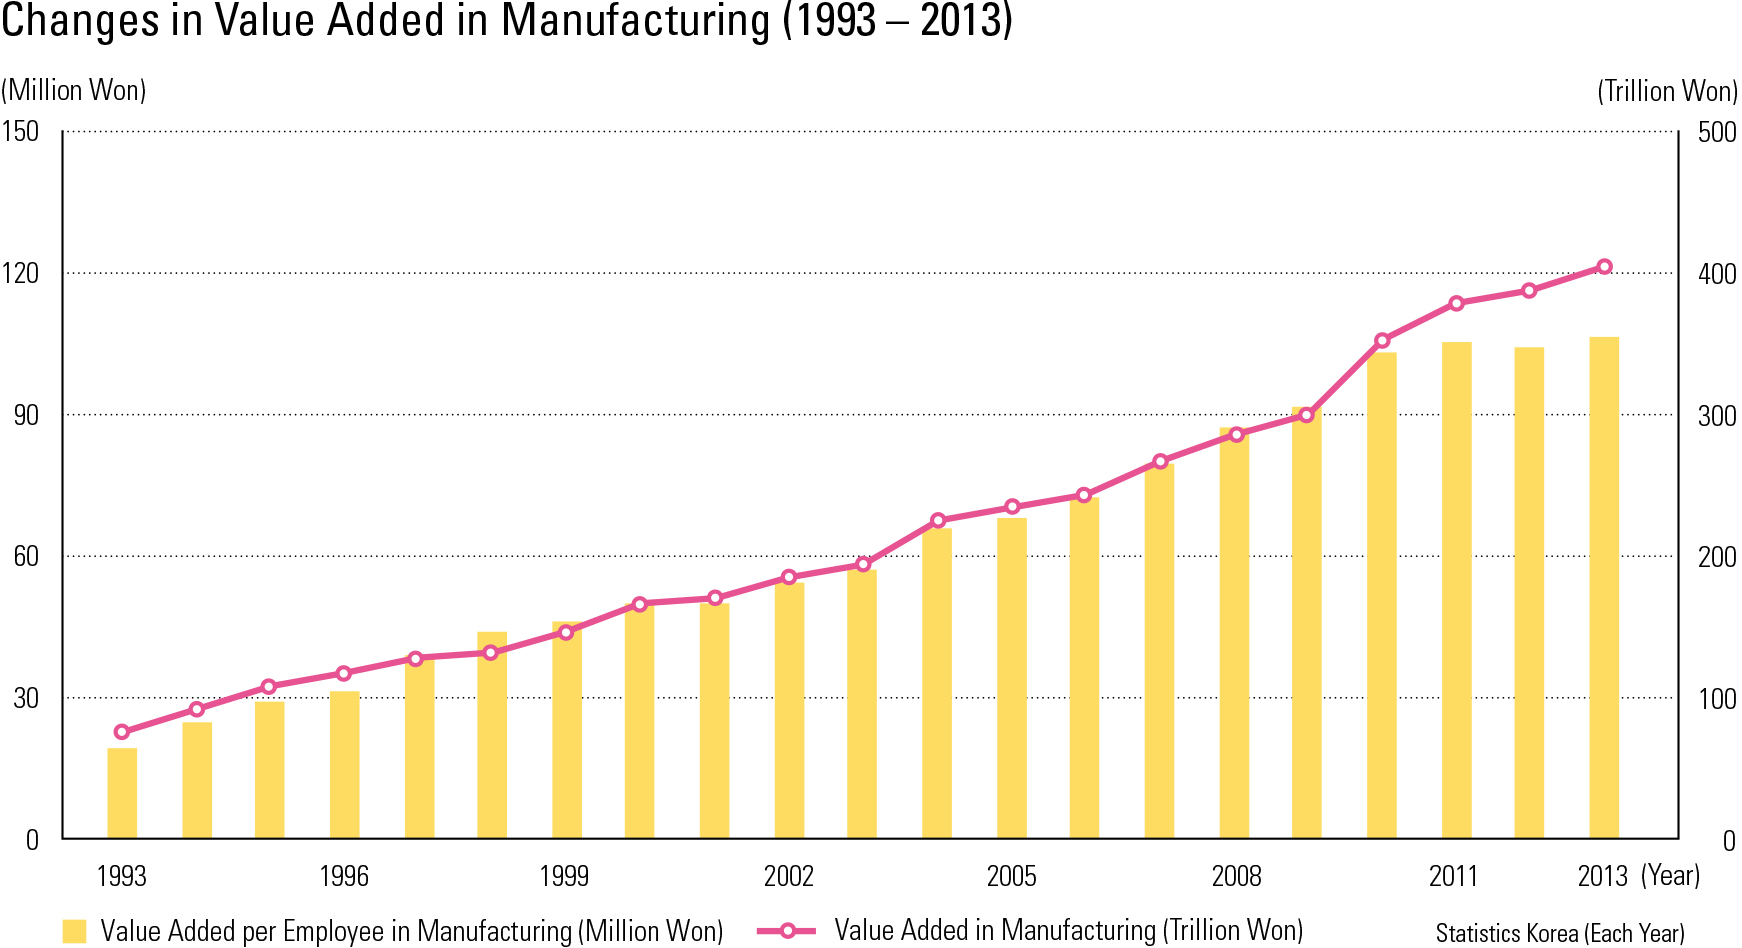
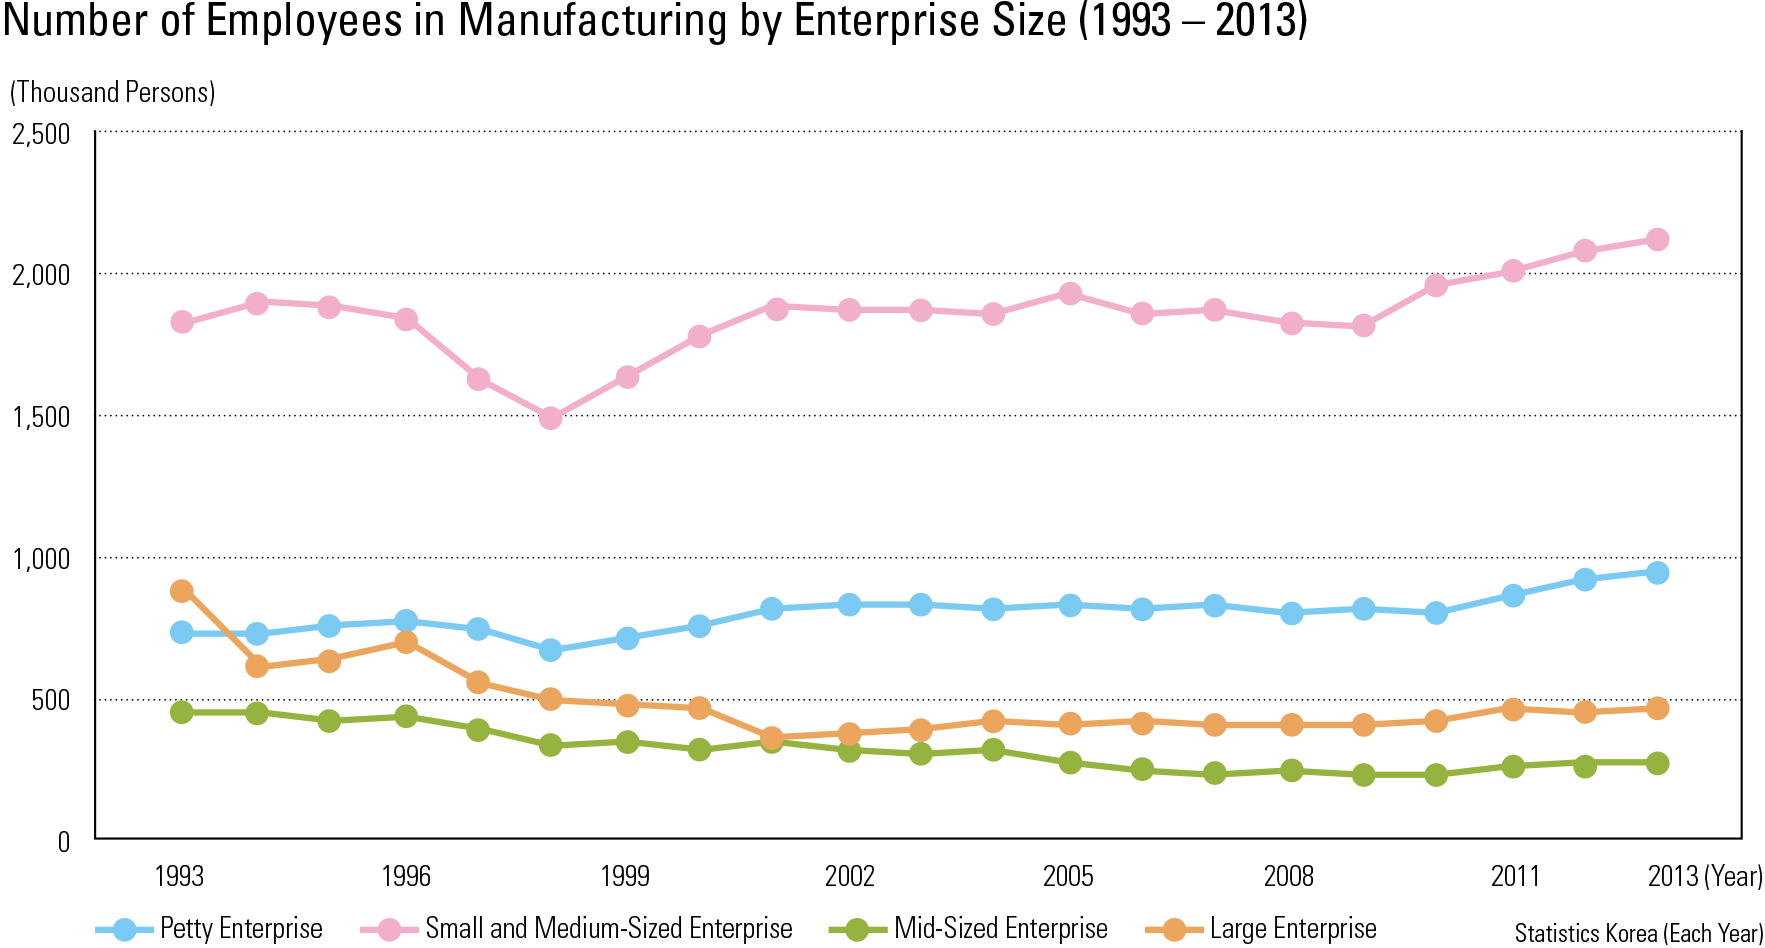
In 1993, Korea’s gross value-added manufac- turing was at 74.9 trillion KWN and its (per cap- ita) value-added rate was at 19.29 million KWN. In 2013, these numbers increased to 404.6 trillion KWN and 106.41 KWN, respectively. Per capita value-added manufacturing by region for 2013 was as follows: Yeosu-si (KRW 5.0 billion), Nam- gu in Ulsan (KRW 4.6 billion), Gwangyang-si (KRW 3.5 billion), Seosan-si (KRW 3.2 billion) Yongin-si (KRW 2.7 billion), Dangjin-si (KRW 2.6 billion), and Asan-si (KRW 2.3 billion won). In 1993, manufacturing workers hired by different sizes of enterprises indicated that the large and mid-size enterprises hired 0.88 million workers (22.7%) and 0.45 million workers (11.7%), re- spectively. In 2013, both categories declined: 0.46 million workers (12.3 %) for large enterprises and 0.27 million workers (7.2%) for mid-size enter- prises. On the other hand, small-to-medium en- terprises (SMEs) and petty enterprises increased: in 1993, there were 1.82 million workers (47.0%) for SMEs and 0.72 million workers (18.6%) for petty enterprises, but in 2013 they increased to 2.11 million workers (55.7%) and 0.94 million workers (24.9%), respectively. In addition, location quotients for 2003 ranked by descending order were: Gangseo-gu in Busan (2.9), Hwaseong-si (2.9), Jincheon-gun (2.5), Buk-gu in Ulsan (2.5), Yangju-si (2.5), Ulju-gun (2.4), and Chilgok-gun (2.4). In 2013, the geo- graphic pattern changed: Gangseo-gu in Busan (3.8), Dong-gu in Ulsan (3.1), Jincheon-gun (3.0), Haman-si (3.0), Yeongam-gun (2.9), Asan-si (2.9), and Eumseong-gun (2.8).
page_2 |