English III
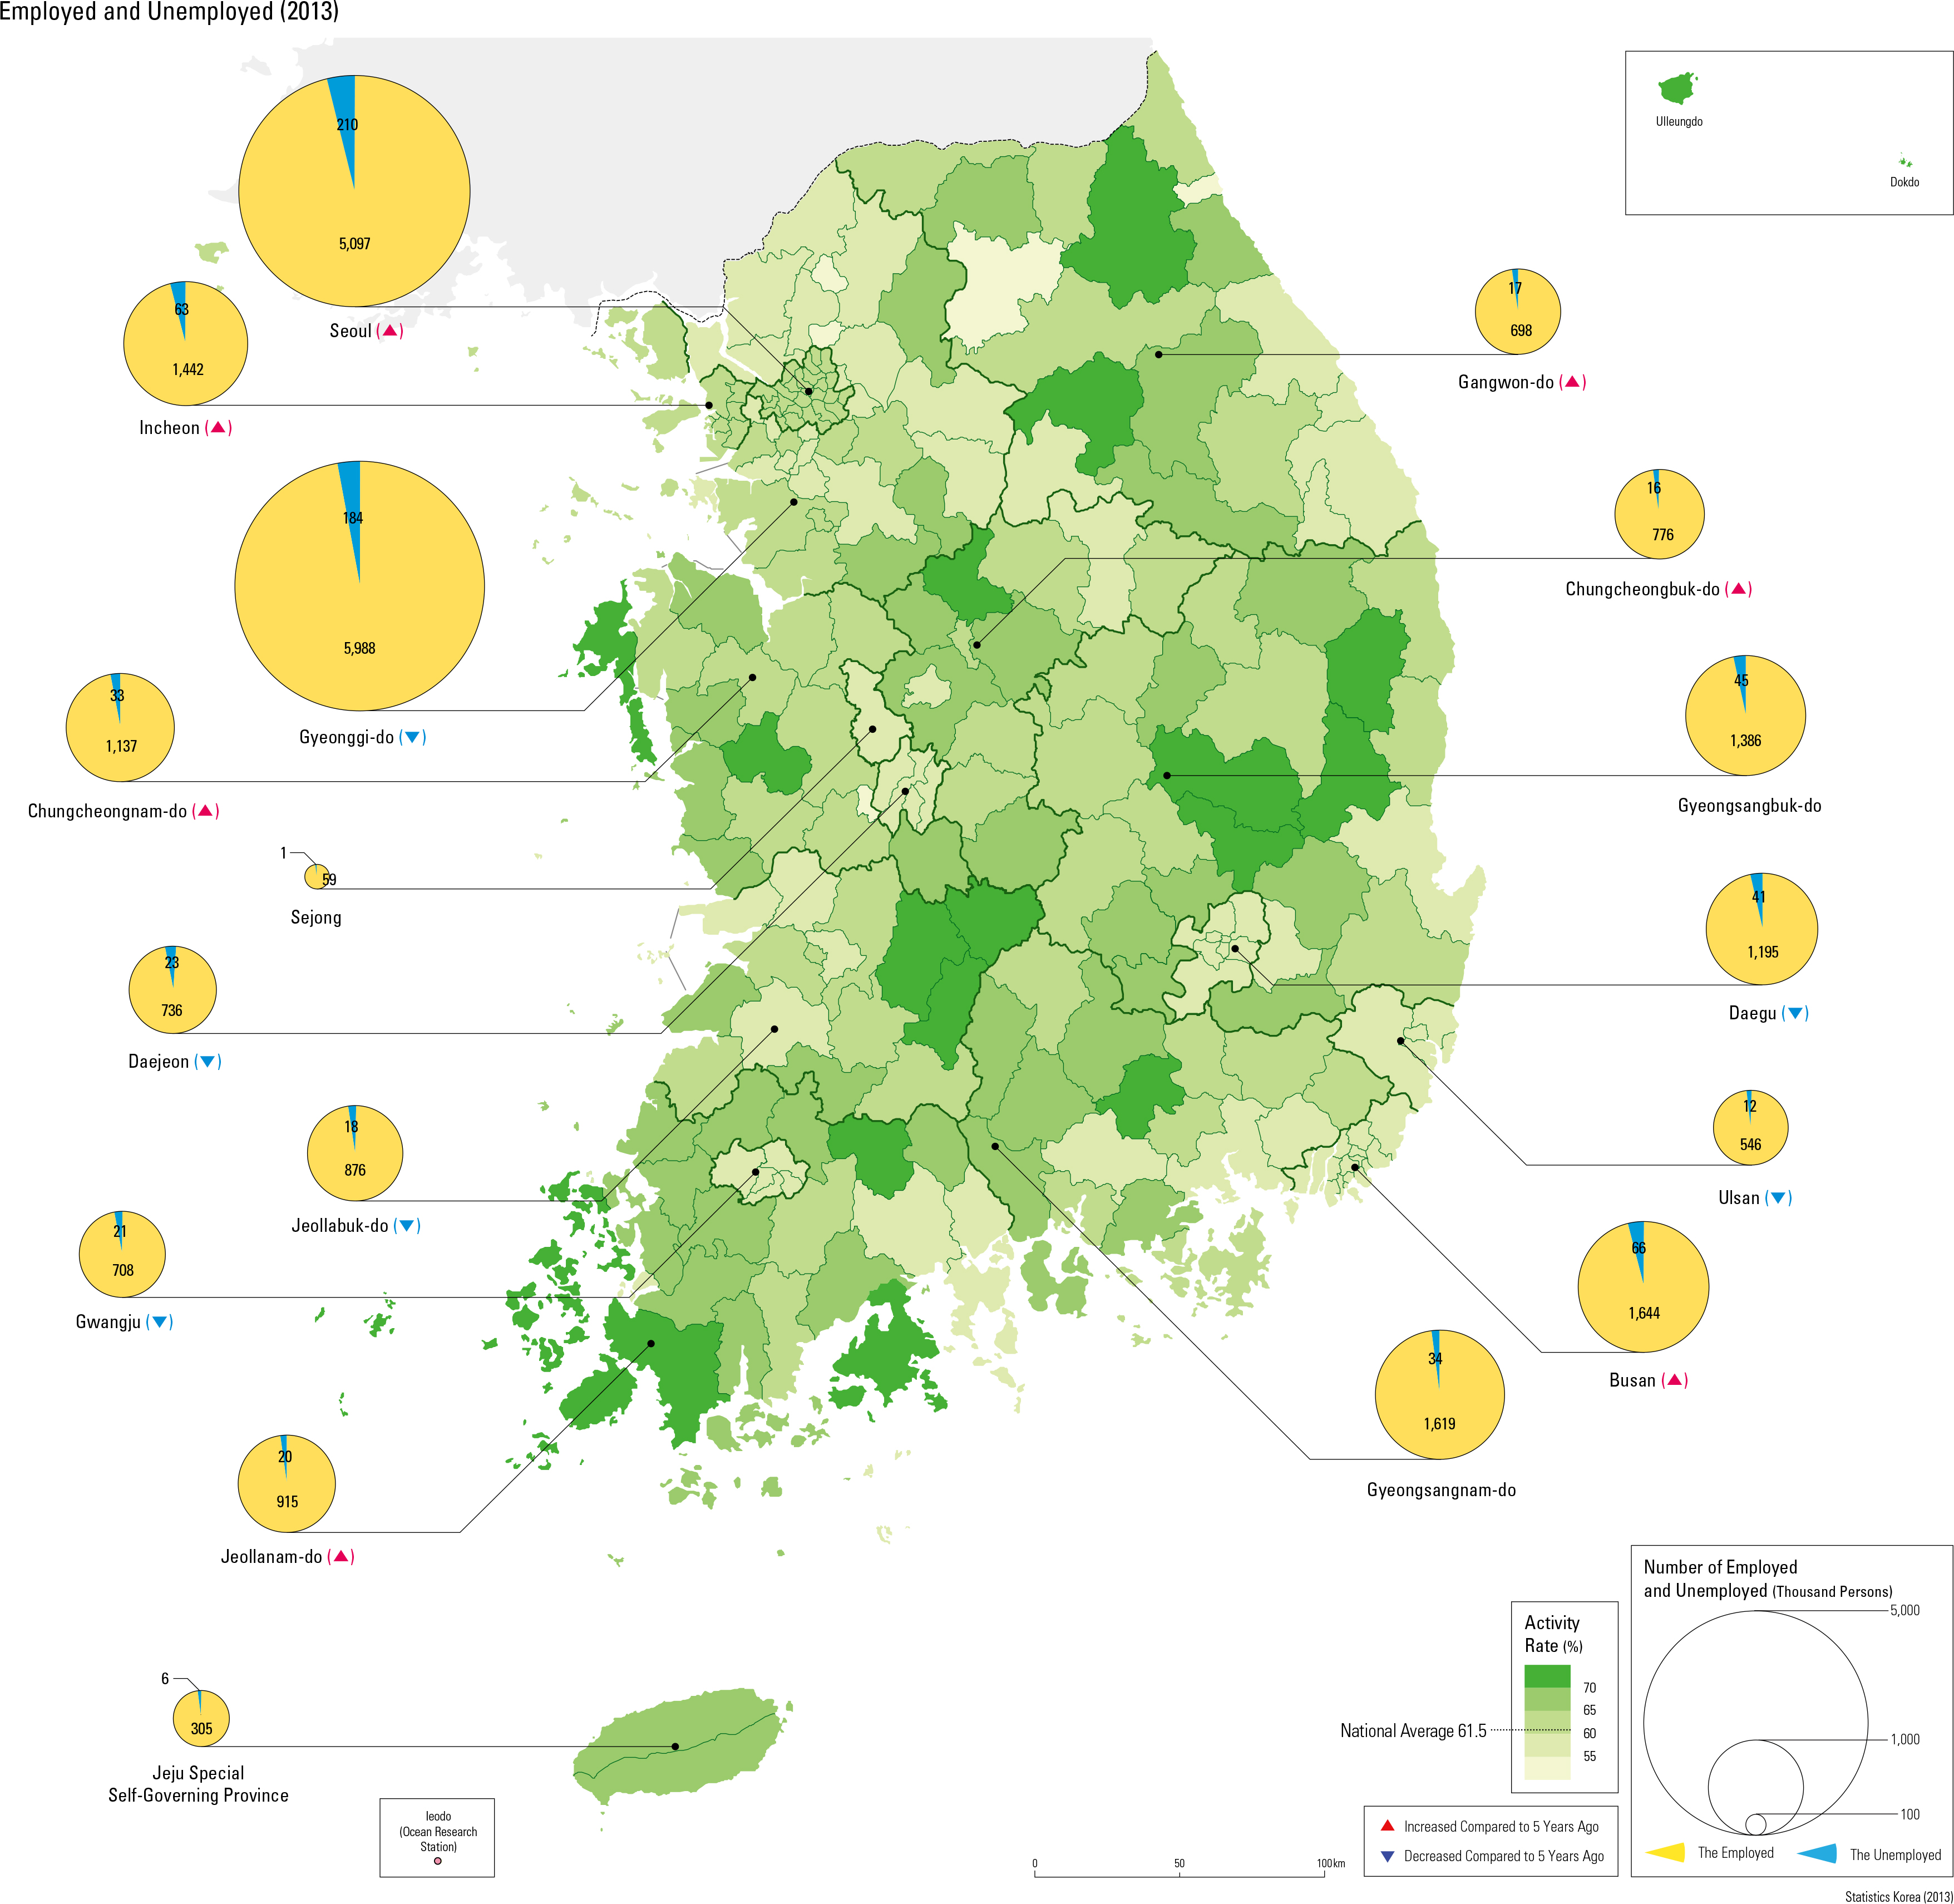
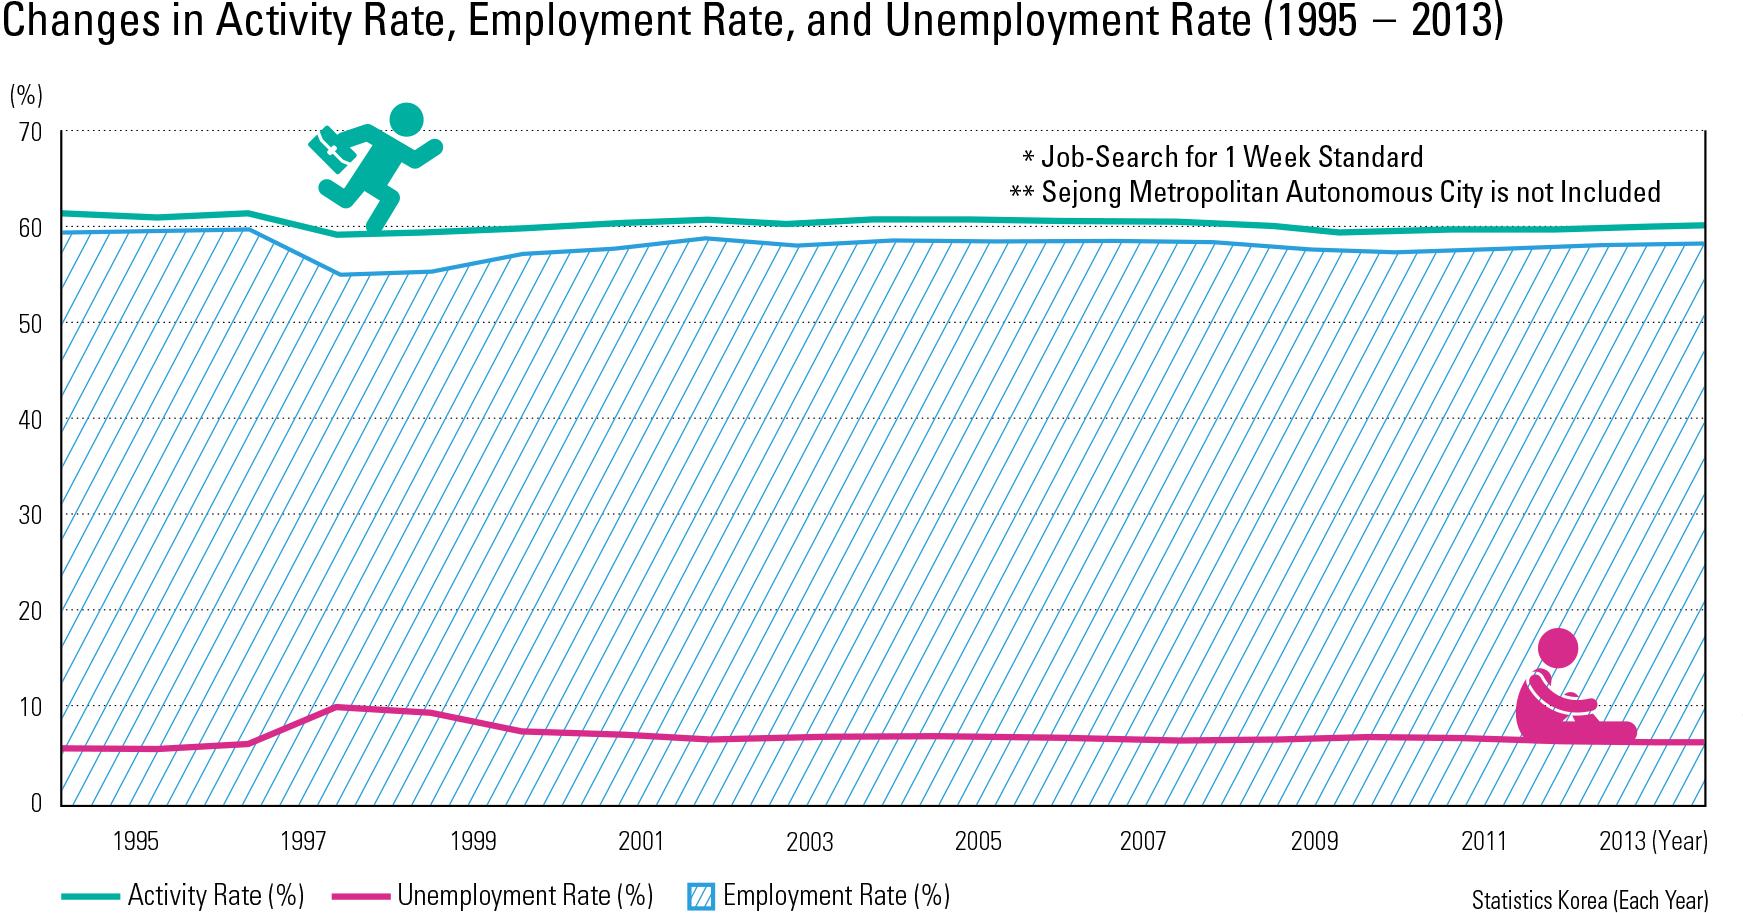
As of 2013, the total employable population over 15 was about 42.1 million. Of that, the economically inactive population, who are not actively searching for jobs (for reasons such as child rearing, homemaking, in school, in national defense, and for any other social reason) was 16.2 million. Therefore, the economically active population, those who are currently employed or actively searching for jobs, was 25.9 million. In 2000, the economic activity rate was 61.5 percent, and it has remained steady at around 60- 62 percent. The overall economic activity rate has remained higher in the larger metropolitan areas due to the higher demand for employment.
The economically active population can be divided into employed and unemployed. In 2013, the employed population was 25.1 million (96.9 percent), while the unemployed was 0.8 million (3.1 percent). The employment rate (based on the total employable population) fell to 56.7 percent in the late 1990s during the economic crisis, but gradually recovered to the previous level, reaching 59.9 percent in 2013. The unemployment rate (the ratio of unemployment to the total economically active population) was as high as 6.3 percent during the economic crisis but had declined to 2.8 percent by 2013.
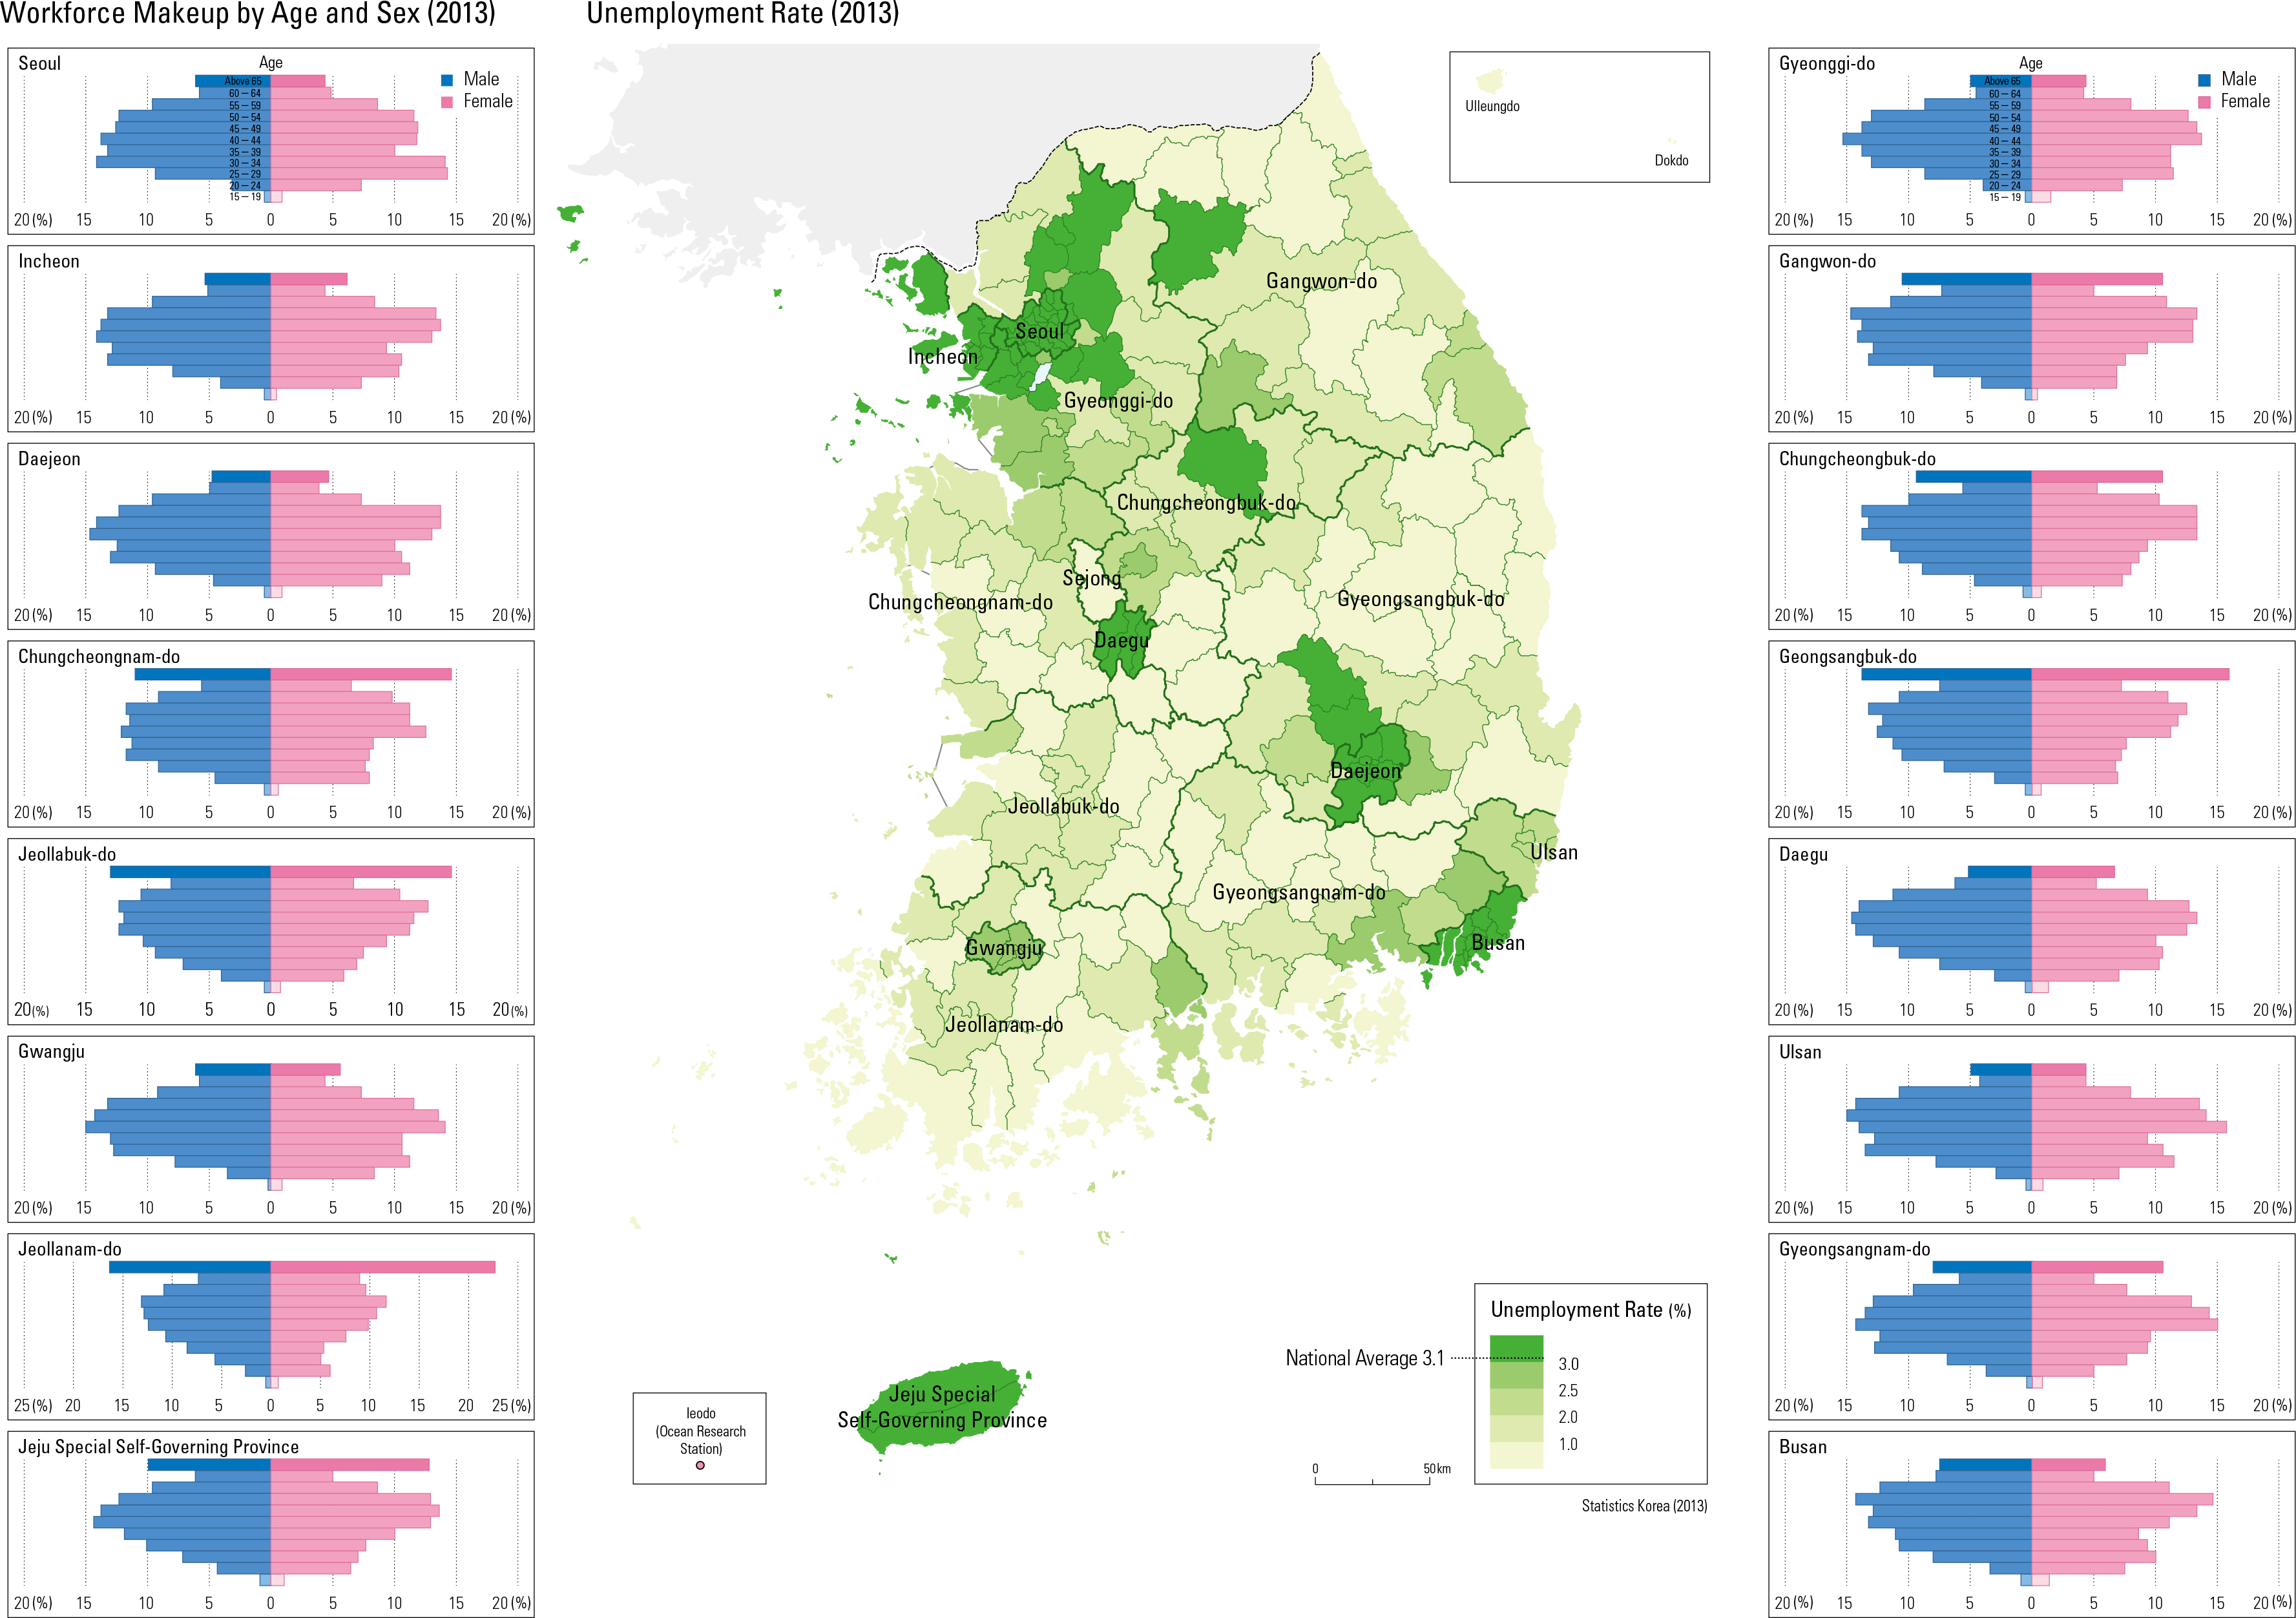
Unemployment rates are usually higher in large metropolitan areas because of the higher demand for employment that attracts job seekers to metropolitan areas. For the same reason, thereis a greater fluctuation of unemployment rates incities depending on the economic situation.
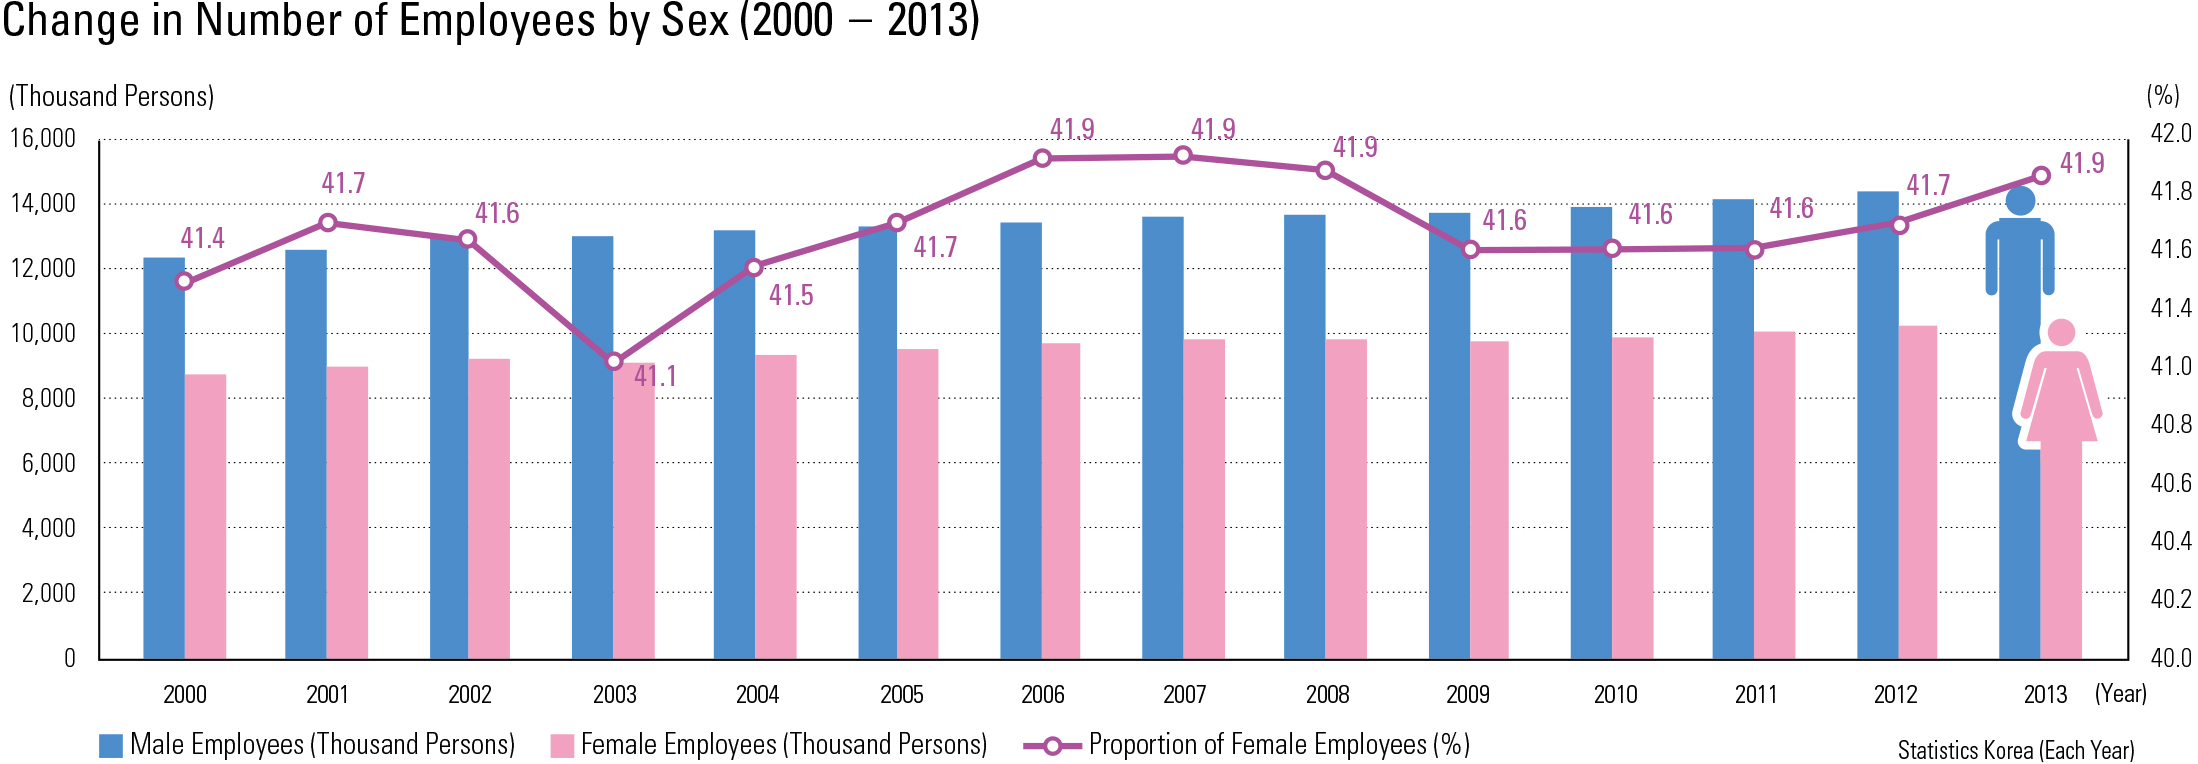
By gender, the number of employed males was 14.6 million and the number of employed females was 10.5 million. The female employment rate has gradually increased and has remained around 41 percent since 2000. Geographically speaking, the female employment rate is higher in metropolitan areas where the service economy is stronger than the national average, while in the manufacturing cities such as the Greater Ulsan Metropolitan Area, the male employment rate is higher than that of females.
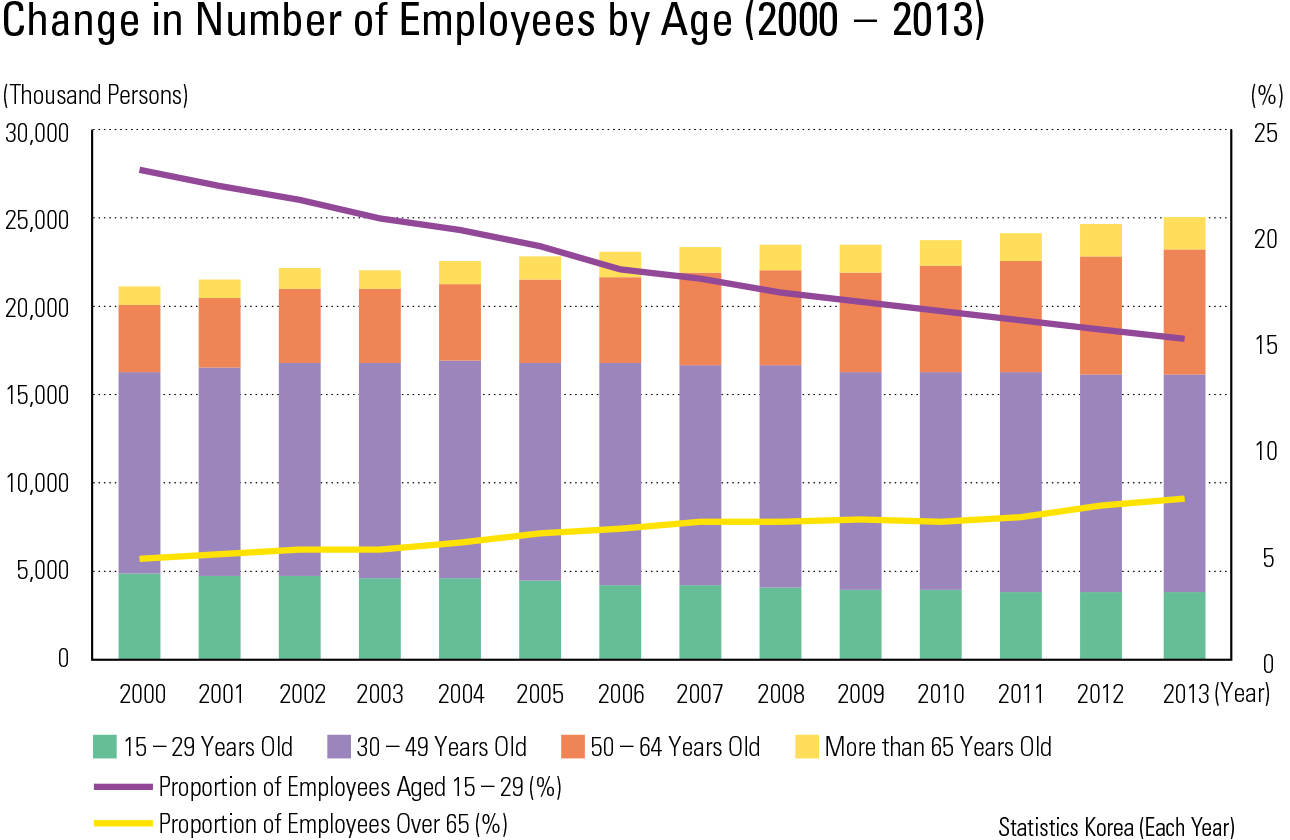
As Korean society ages, the employed population is also aging. In 2013, the most economically active age group, 30 – 49, comprised 49.9 percent of the employed population; the middle-aged group of 50 – 64 comprised 27 percent; the younger age group of 15 – 29 comprised 15.1 percent; and the older age group of over 65 comprised 7.6 percent. Compared to 2000, the proportion of employed individuals 49 and younger declined, while the proportion of employed individuals over 50 grew.
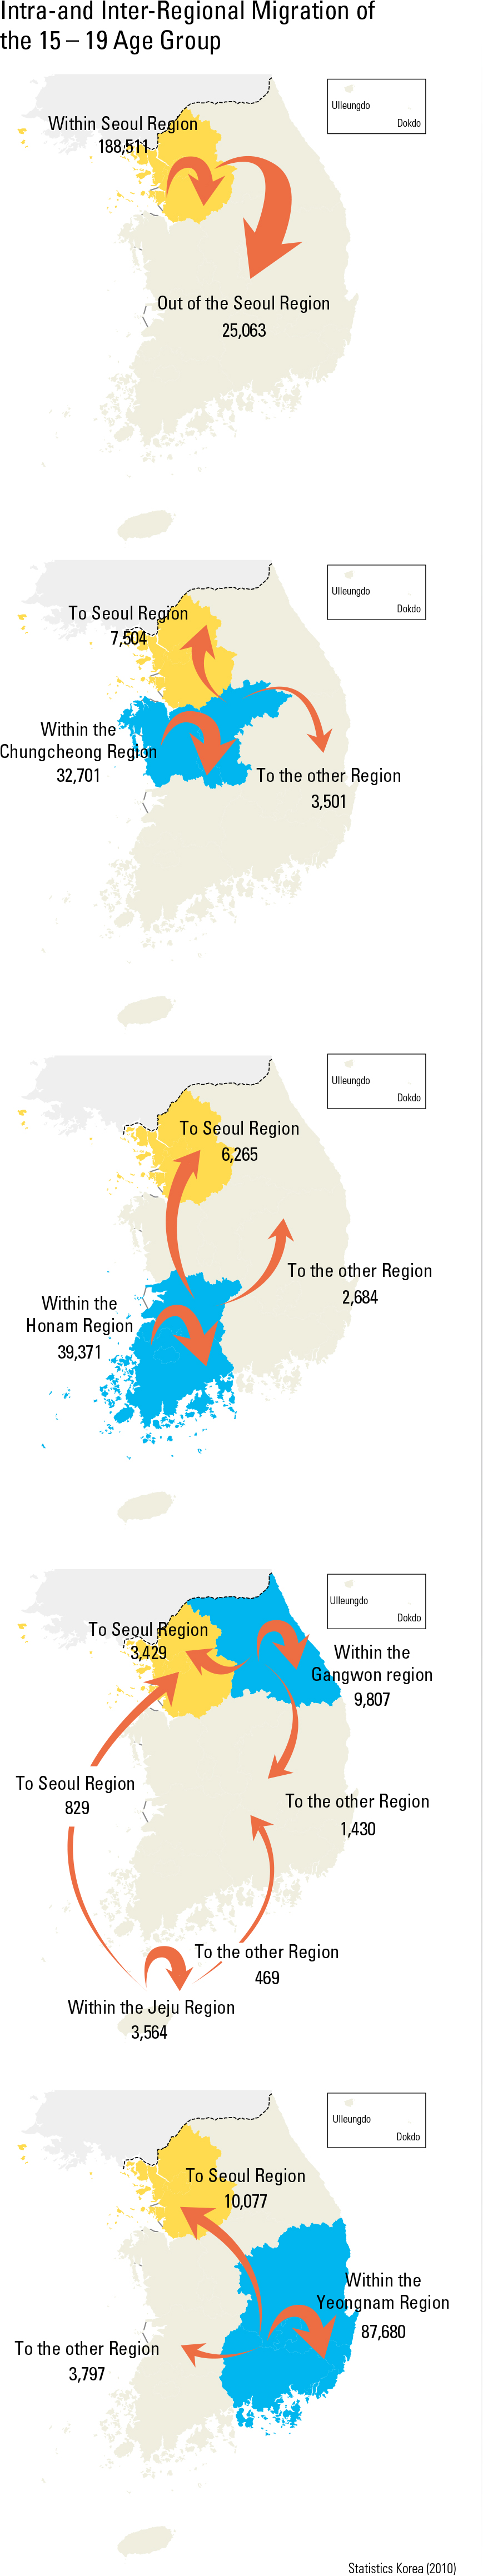
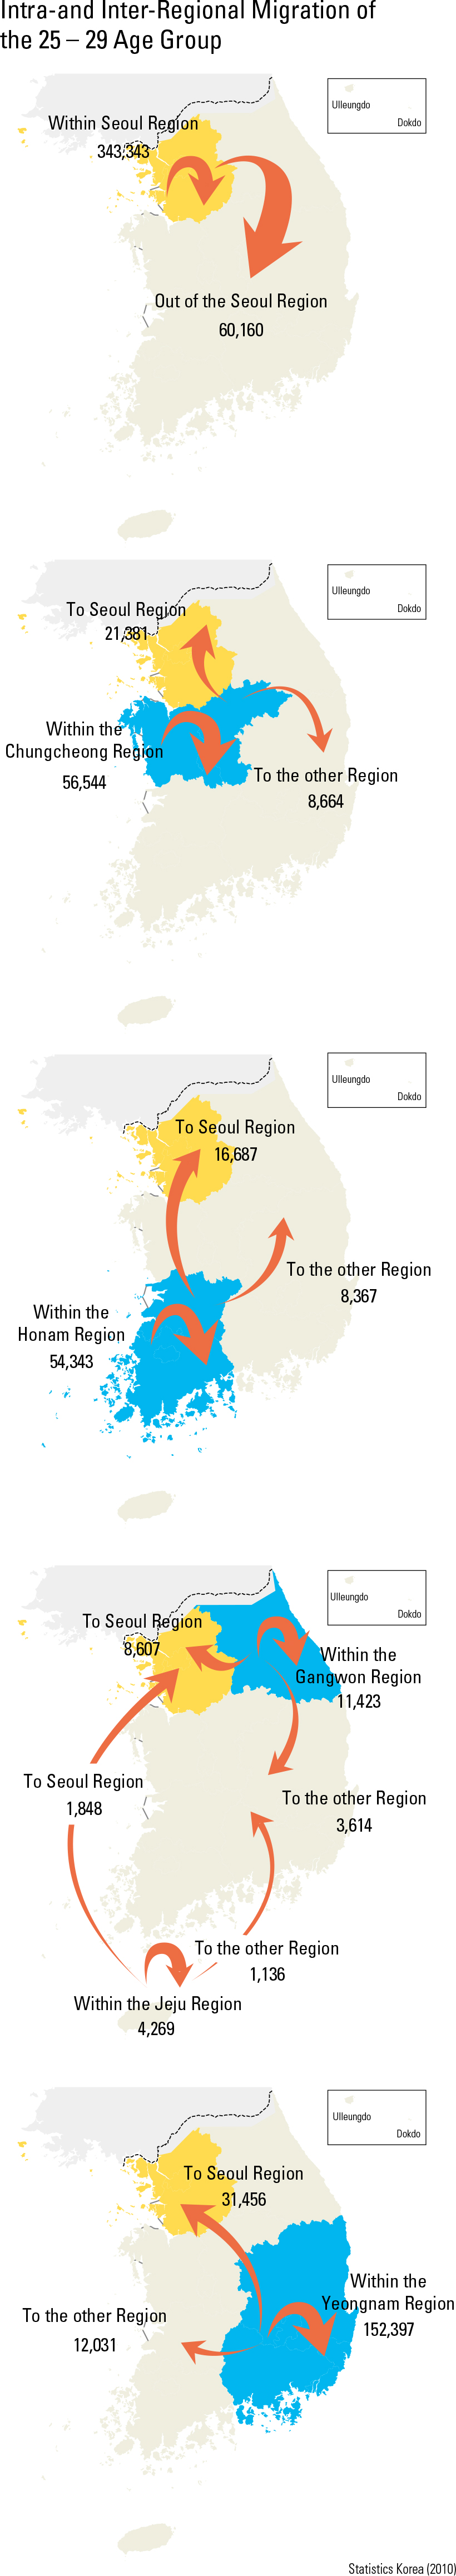
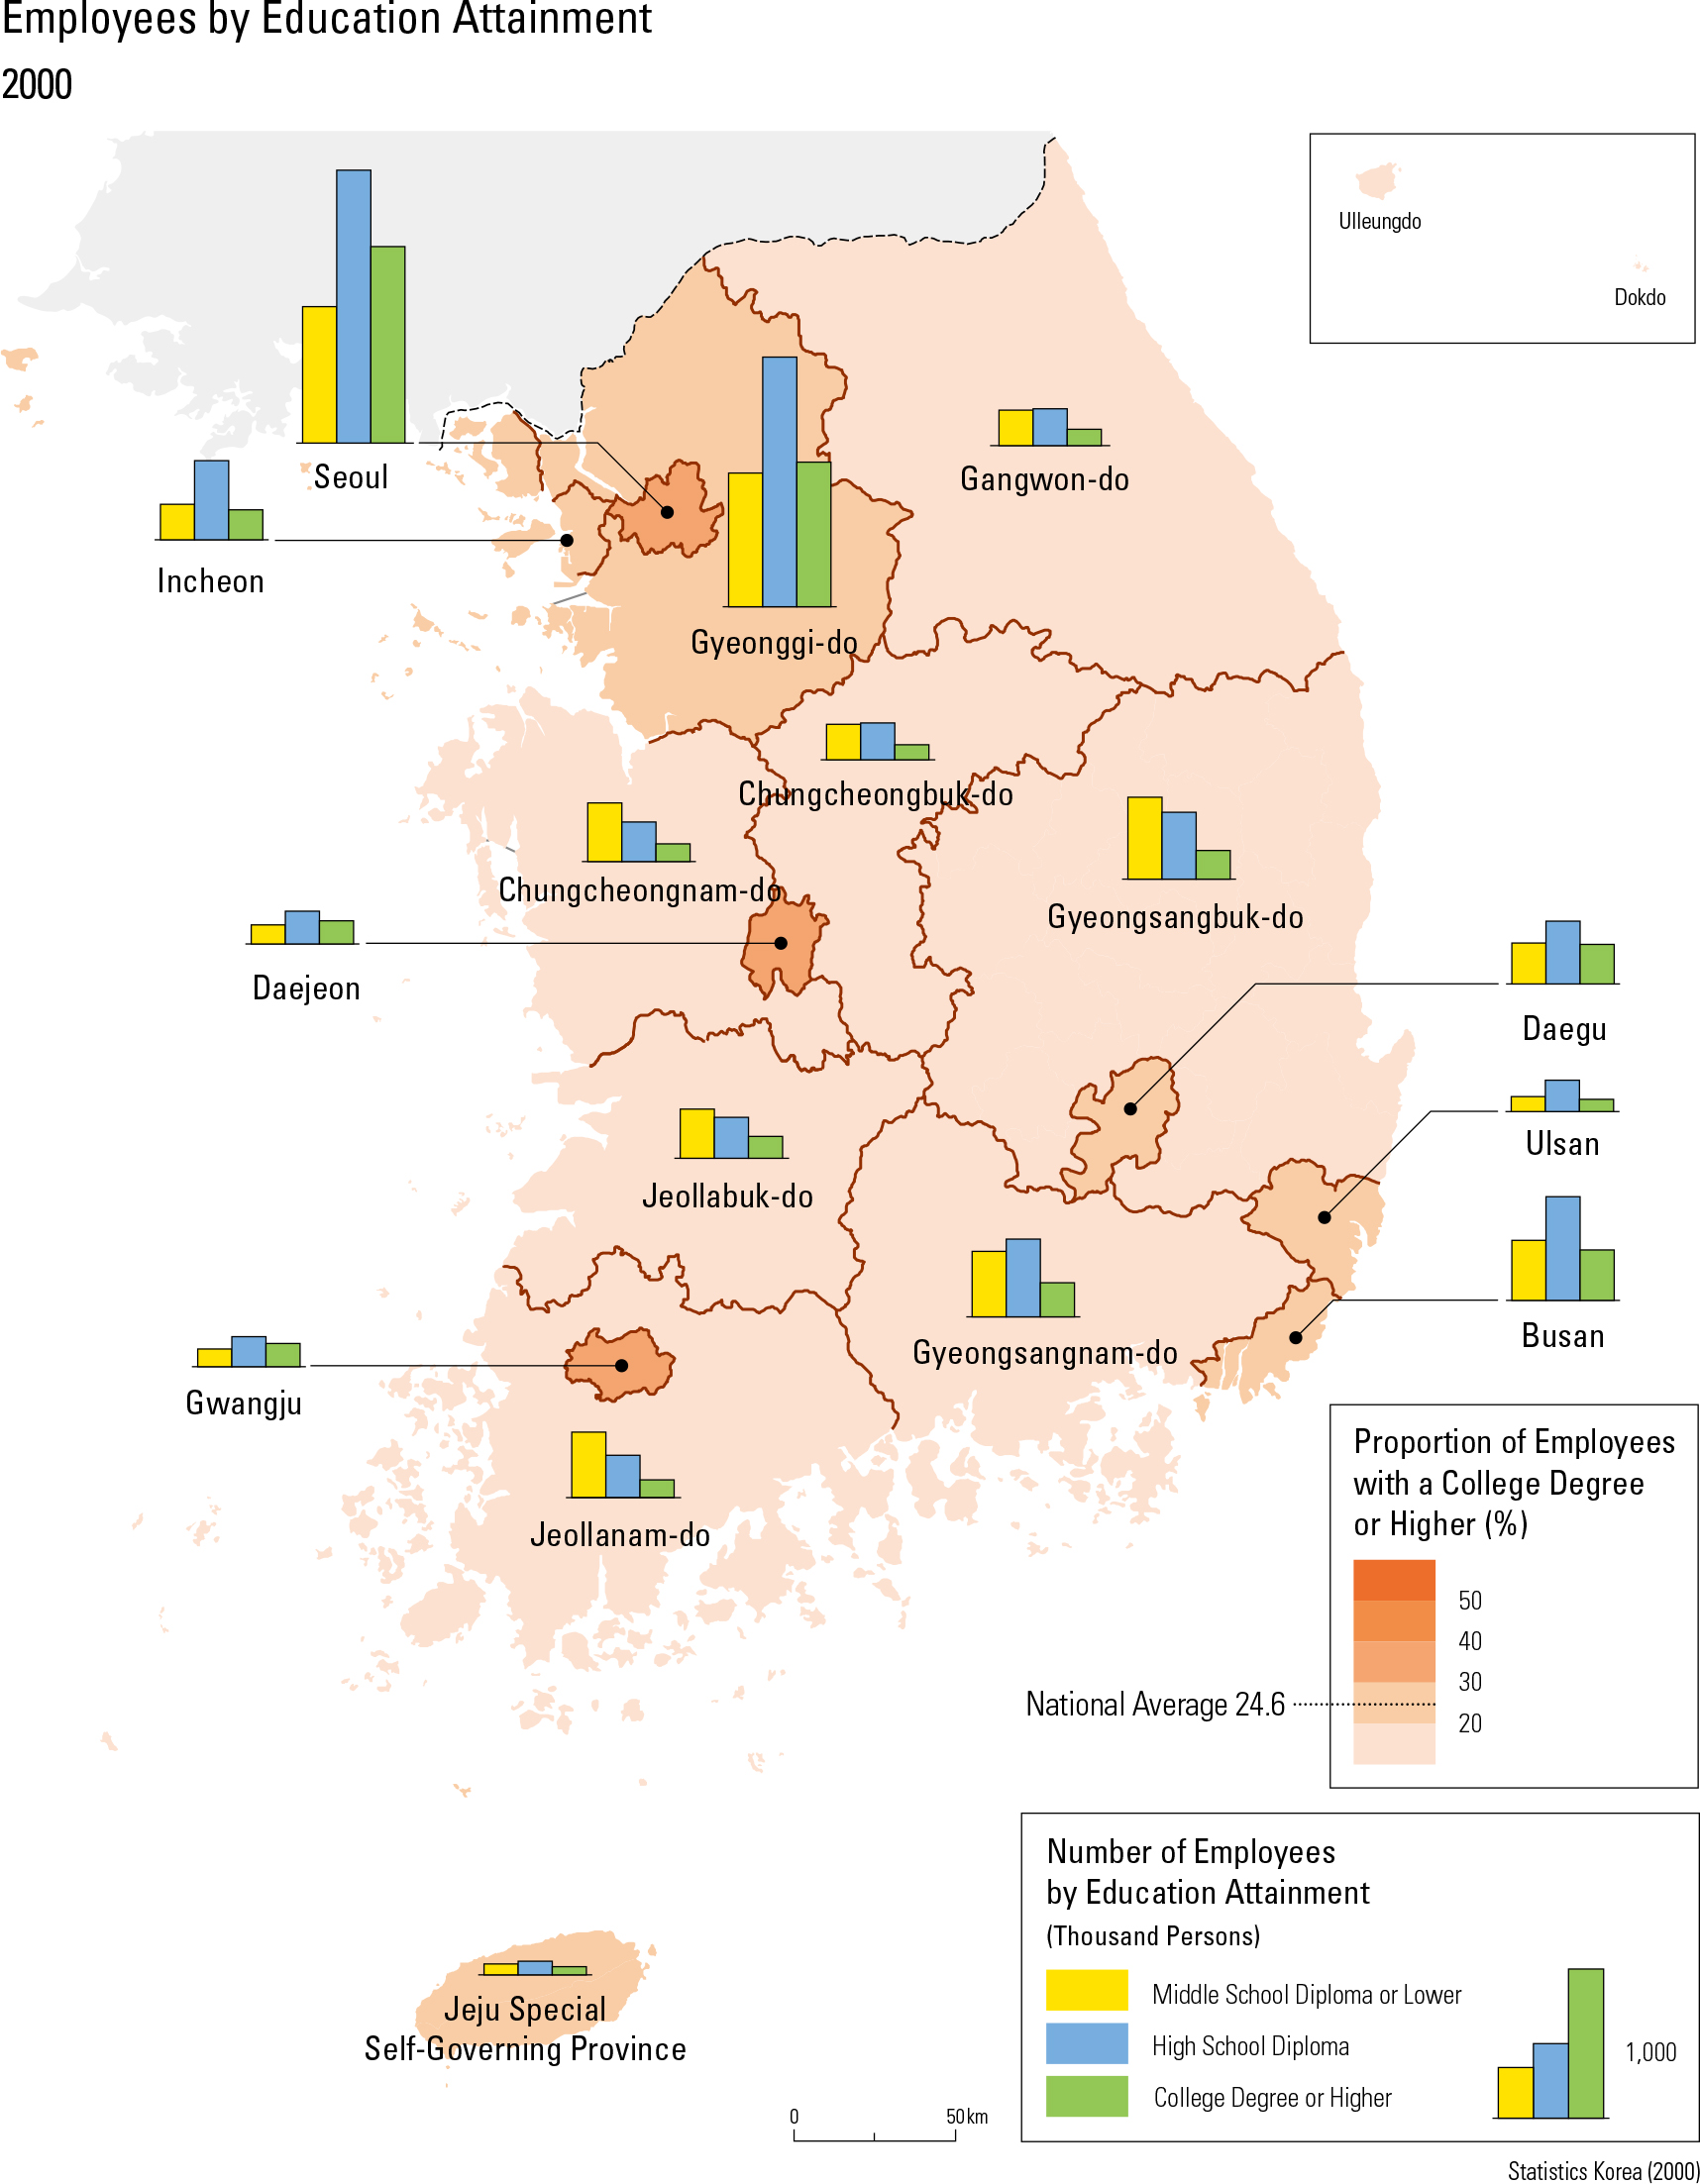
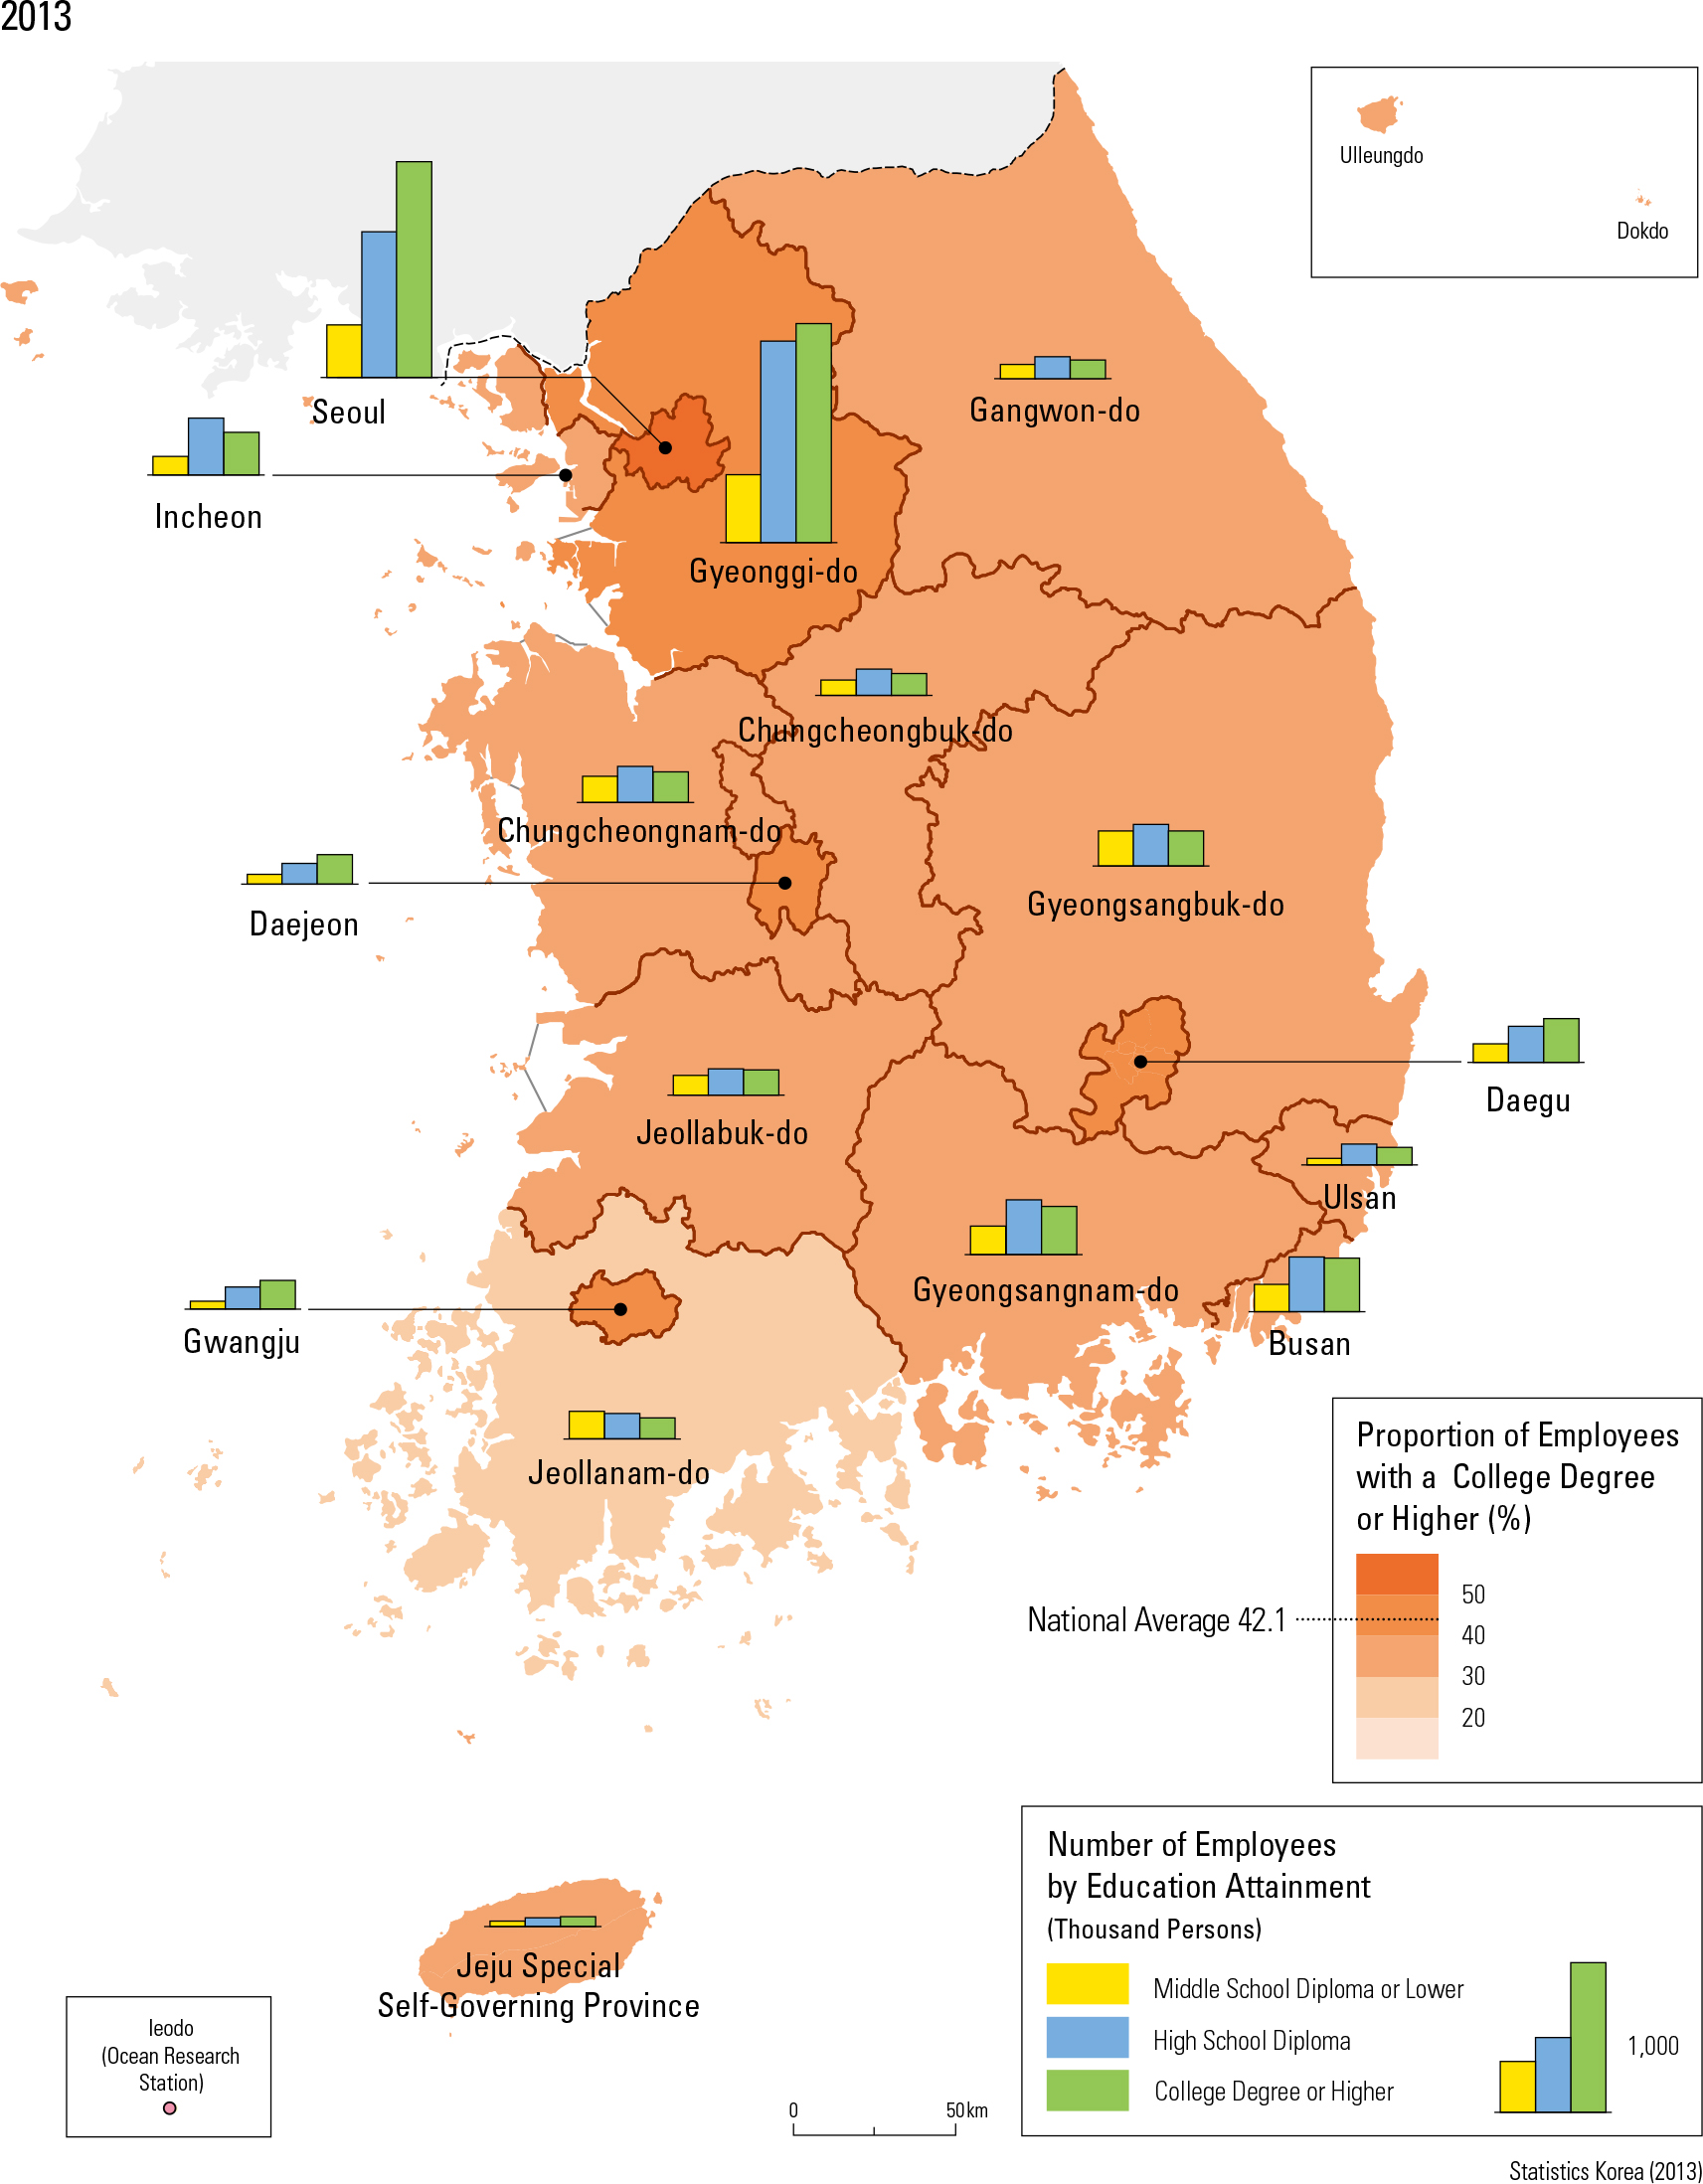
With the improvement of communication technology, the dissemination of information becomes more effective; thus, the advancement of knowledge-based informationalization becomes the foundation of new technology and industry. Correspondingly, the overall education level of Korean employees has increased. Up until 2000, the areas with over 40 percent of the population being college graduates were mostly the larger metropolitan areas; however, by 2013 that percentage extended to the entire country. During the same time, the number of college graduates across the nation surpassed those with only a high school education. Yet, most of the highly educated people are still concentrated in the Greater Seoul Metropolitan Area, as can be seen from the migration patterns for the “college-preparation” (15 – 19) and the “soon after college” (25 – 29) age groups. In 2014, the interregional migration for individuals ages 25 – 29 and out-migration for that age group was higher from non-Seoul regions, and the main destination was the Greater Seoul Metropolitan Area. To a lesser degree, the same pattern can be seen for ages 15 – 19, with a higher in-migration to the Greater Seoul Metropolitan Area. |