English III
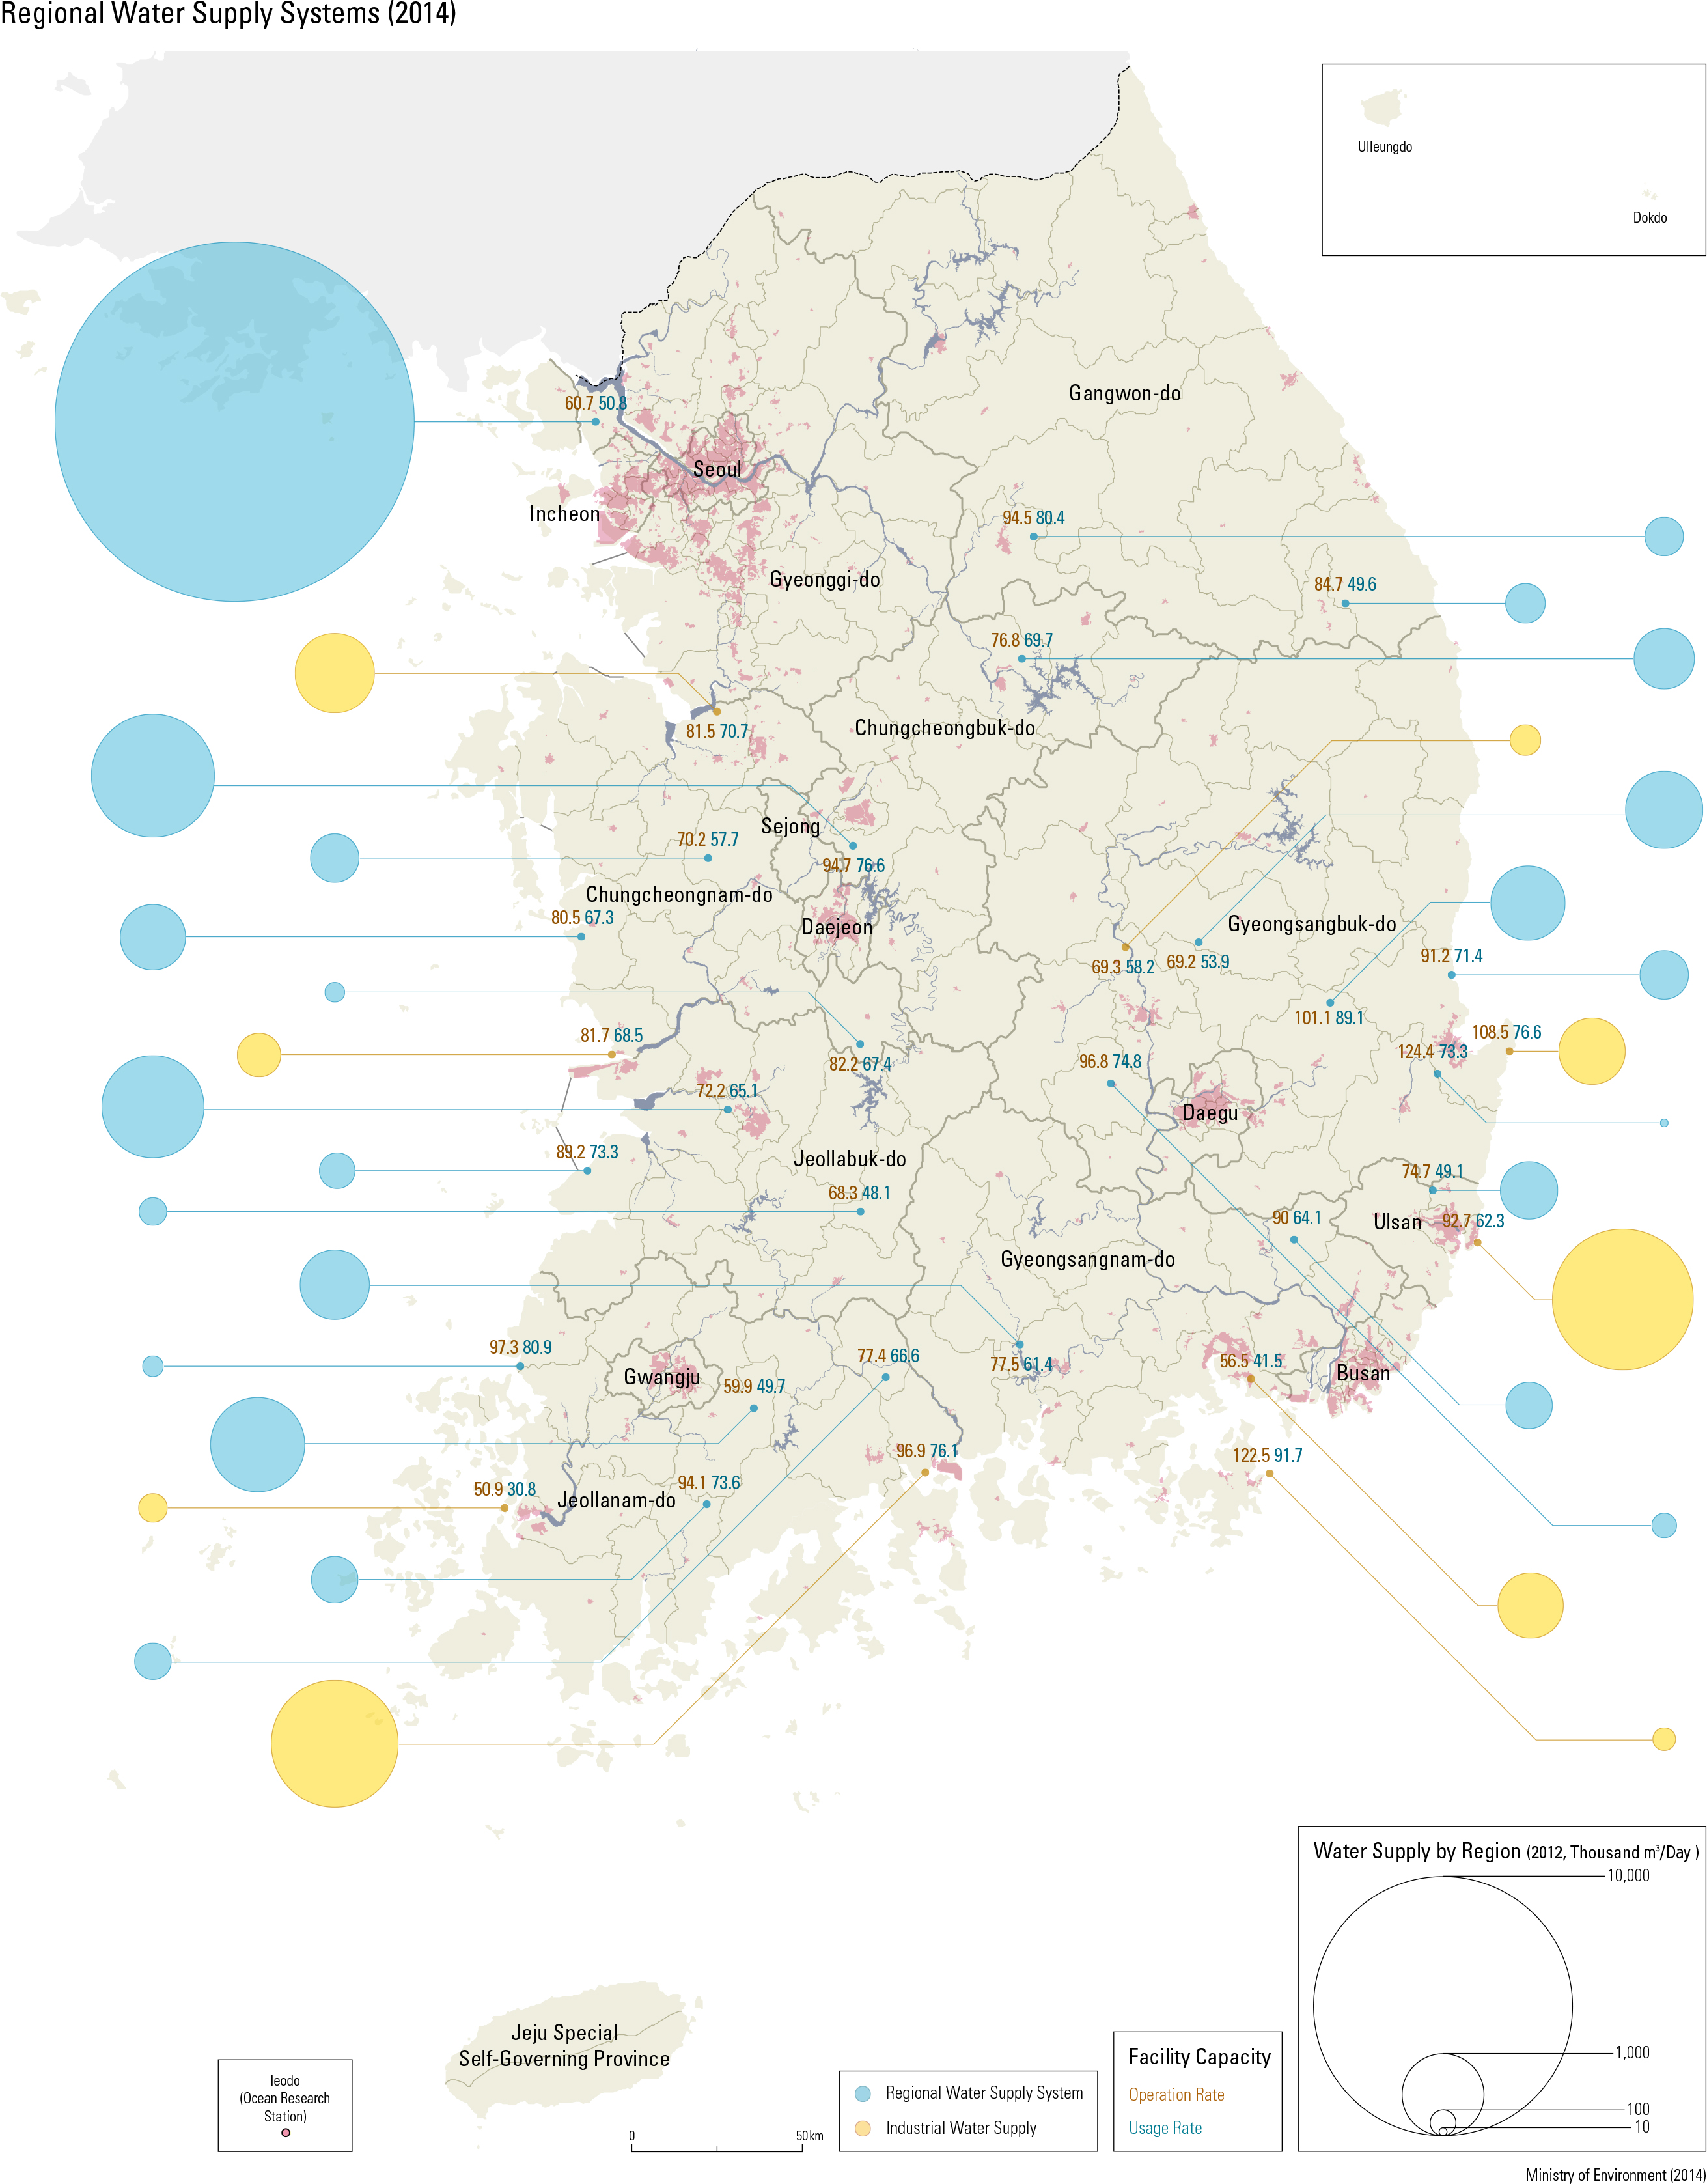
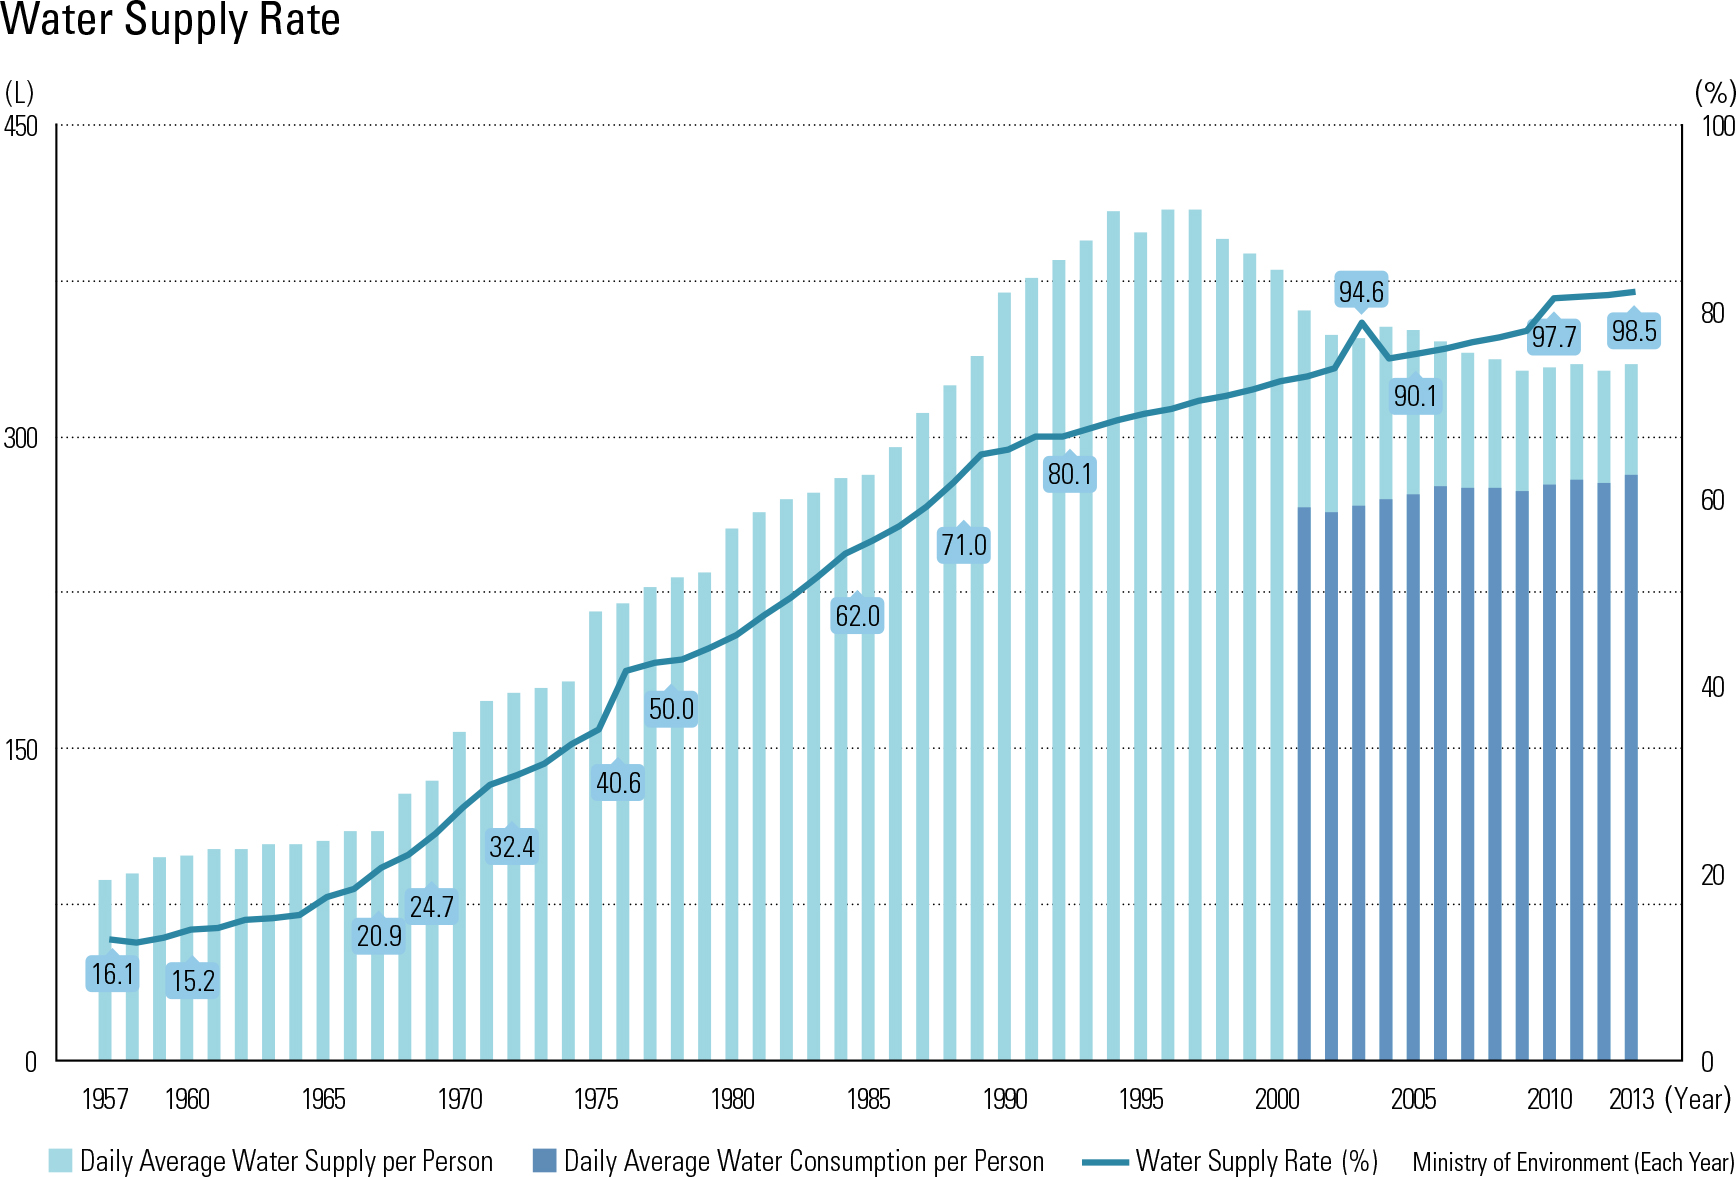
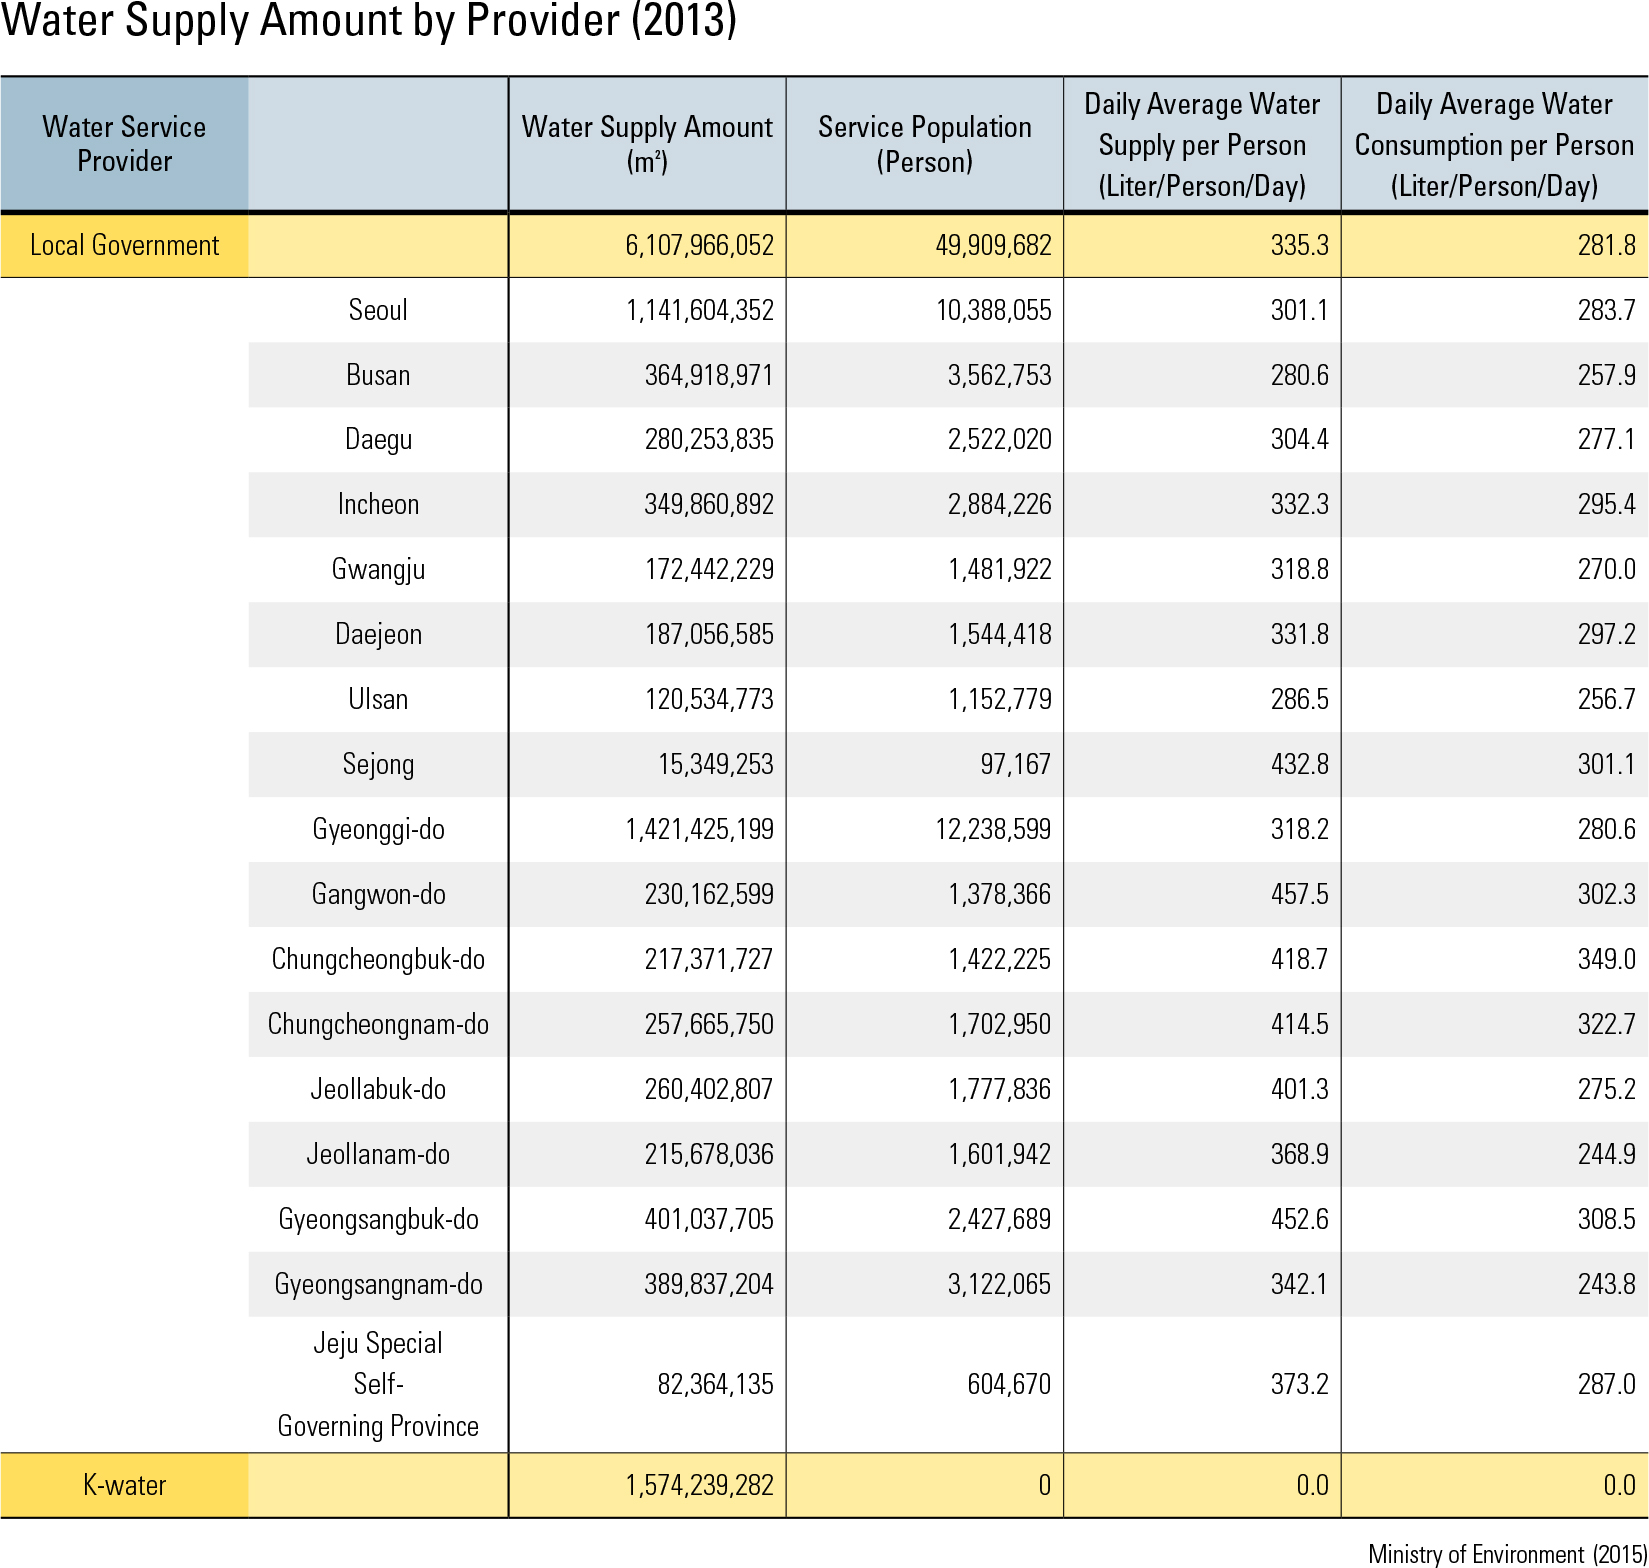
as 16.1% in 1955. The rate went up to 50% in 1976, 90% in 2003, and 98.5% in 2013. The daily average water supply per person was about 71 liters (L) in 1955, and reached 335 L by 2013. Among provinces, Gangwon-do has the largest water supply amount (457 L per person per day), while Busan has the smallest (281 L per person per day). In water consumption, the national av- erage is 282 L per person per day (not including 335 L of industrial consumption per company and per day); by comparison, Gyeongsangnam-do has the lowest amount (244 L per person per day) and Chungcheongbuk-do has the highest (349 L per person per day). Water supply systems are composed of multi-regional water supply systems, local water supply systems, village water supply systems, and small-scale water supply systems. About 51 mil- lion people rely on water supply systems. Local water supply systems support 38 million people (74.0%), and multi-regional water supply systems support 12 million people (23.3%). Local water supply systems are managed by 162 local govern- ments. The multi-regional water supply systems are managed by the national government. Water supply systems are composed of intake facilities, ltration facilities, and distribution net- works. In addition, distribution reservoirs store water in order to respond to temporary high de- mands. Korea has 589 intake facilities and their combined capacity is 37,181,000 m3 per year. The intake facility operation rate is 66.2%. Geo- graphically, Jeollabuk-do shows the highest oper- ation rate (156.4%) and Busan shows the lowest (43.4%). Major water intake sources are streams (49.9%, 18,569,000 m3/day) and dams (43.2%, 16,073,000 m3/day), accounting for 93.1% of the total. Other intake sources are underground streams (4.4%), groundwater (1.5%), and other reservoirs (1.0%). Jeollabuk-do shows the high- est rate (98.4%) of operating filtration facilities, followed by Sejong-si (94.9%). Daejeon shows the lowest rate (52.2%). The total length of distri- bution networks was 185,778 km as of 2013, and 97.2% belong to local water supply systems.
page_2 |