English III
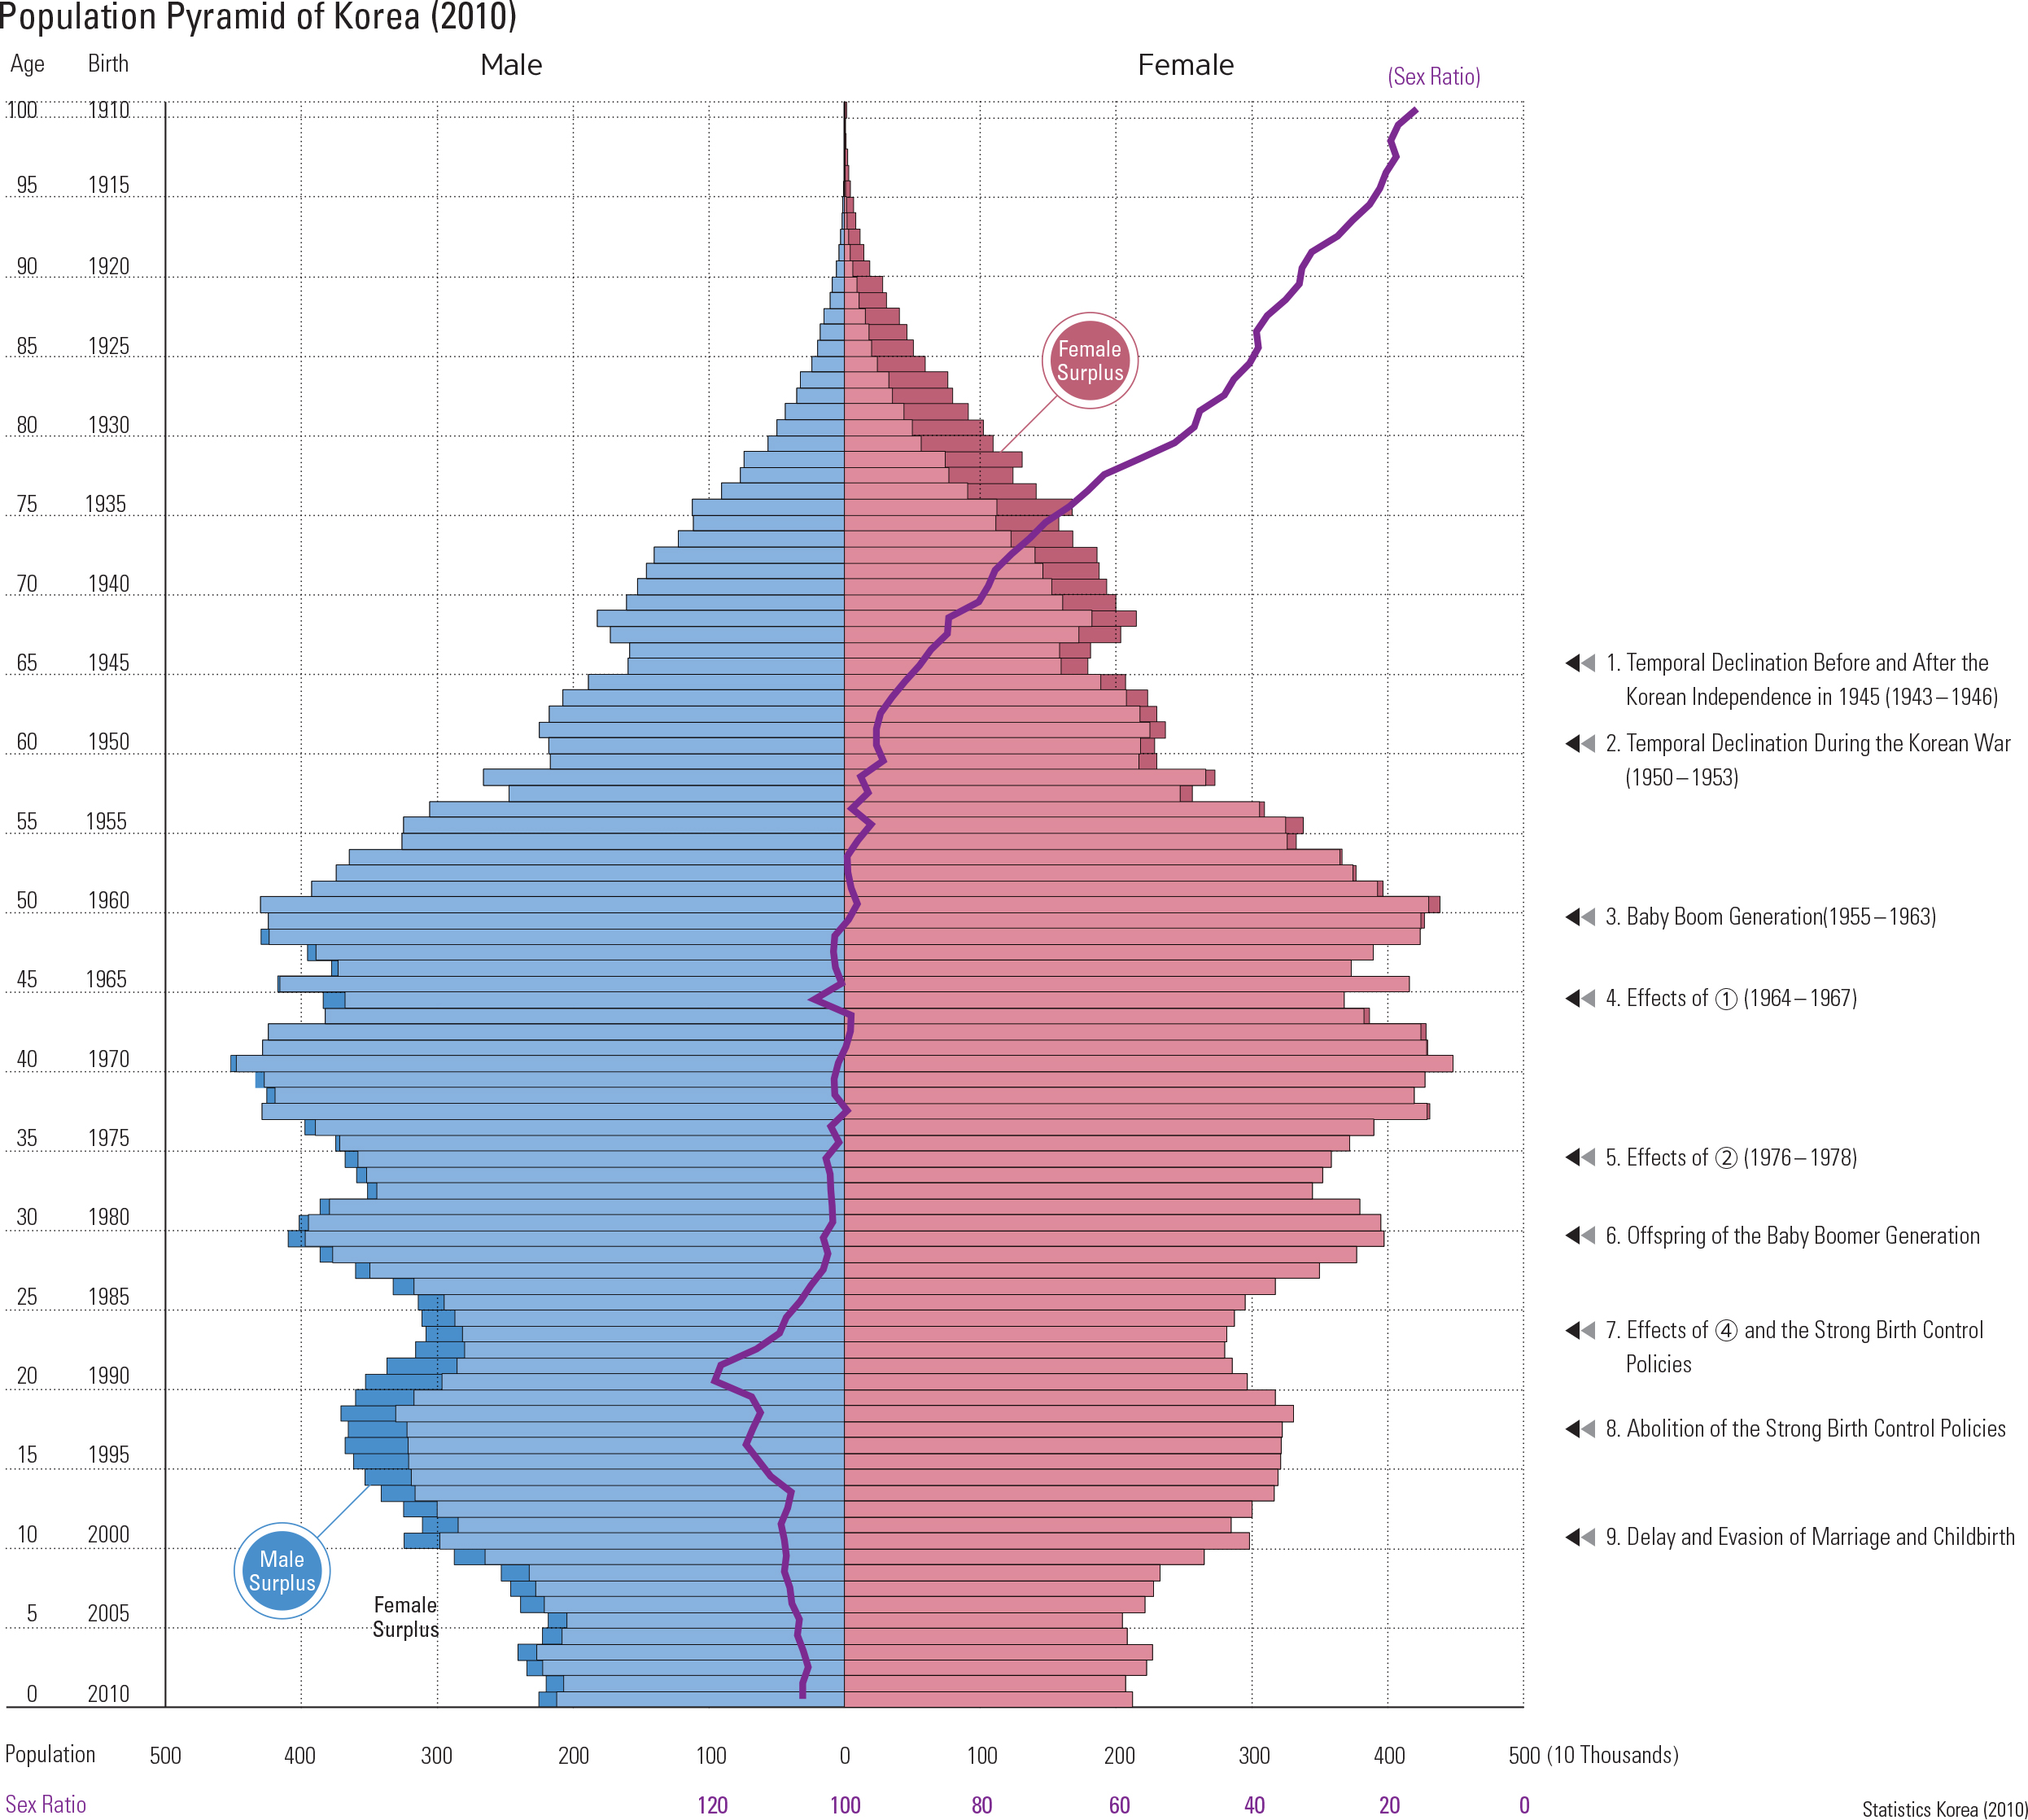
The 2010 population pyramid shows Korea’s popula- tion structure by gender and age. The newborn population temporarily declined during the Korean independence movement in 1945 and the Korean War (1950 – 53). The baby boom generation (i.e., born between 1955 – 1963) has played a key role in determining Korea’s population structure. The birth rate declined slightly between 1964 and 1967 because of a relatively small population of childbearing age individuals due to the unstable period of Korean independence. The birth rate declined again between 1976 and 1978 because of a relatively small pop- ulation of childbearing age related to the Korean War. Birth rates increased in the early 1980s as the baby boom generation began having children. The population born between 1985 and 1990 decreased substantially since they were the offspring of the generation born in 1964 – 67, and strong birth control policies were enforced during this period. Although the number of new births increased slightly after the government’s birth control policies were abolished, birth rates have decreased due to people wait- ing longer to marry and choosing not to have children. The sex ratio (i.e., number of males per 100 females) indicates that males outnumber females in the population under 35 years old, while females outnumber males in the population over 60 years old. Korea’s estimated population was approximately 49.4 million in 2010. If the current trend continues, it is expect- ed to peak at approximately 52.2 million in 2030, and de- cline thereafter. The Korean government has encouraged people to have children since 2000, but the fertility rate has still fallen to one of the lowest in the world due to so- cial and economic circumstances. Korea faces signi cant challenges associated with a stagnant or declining future population.
page_2 |