English III
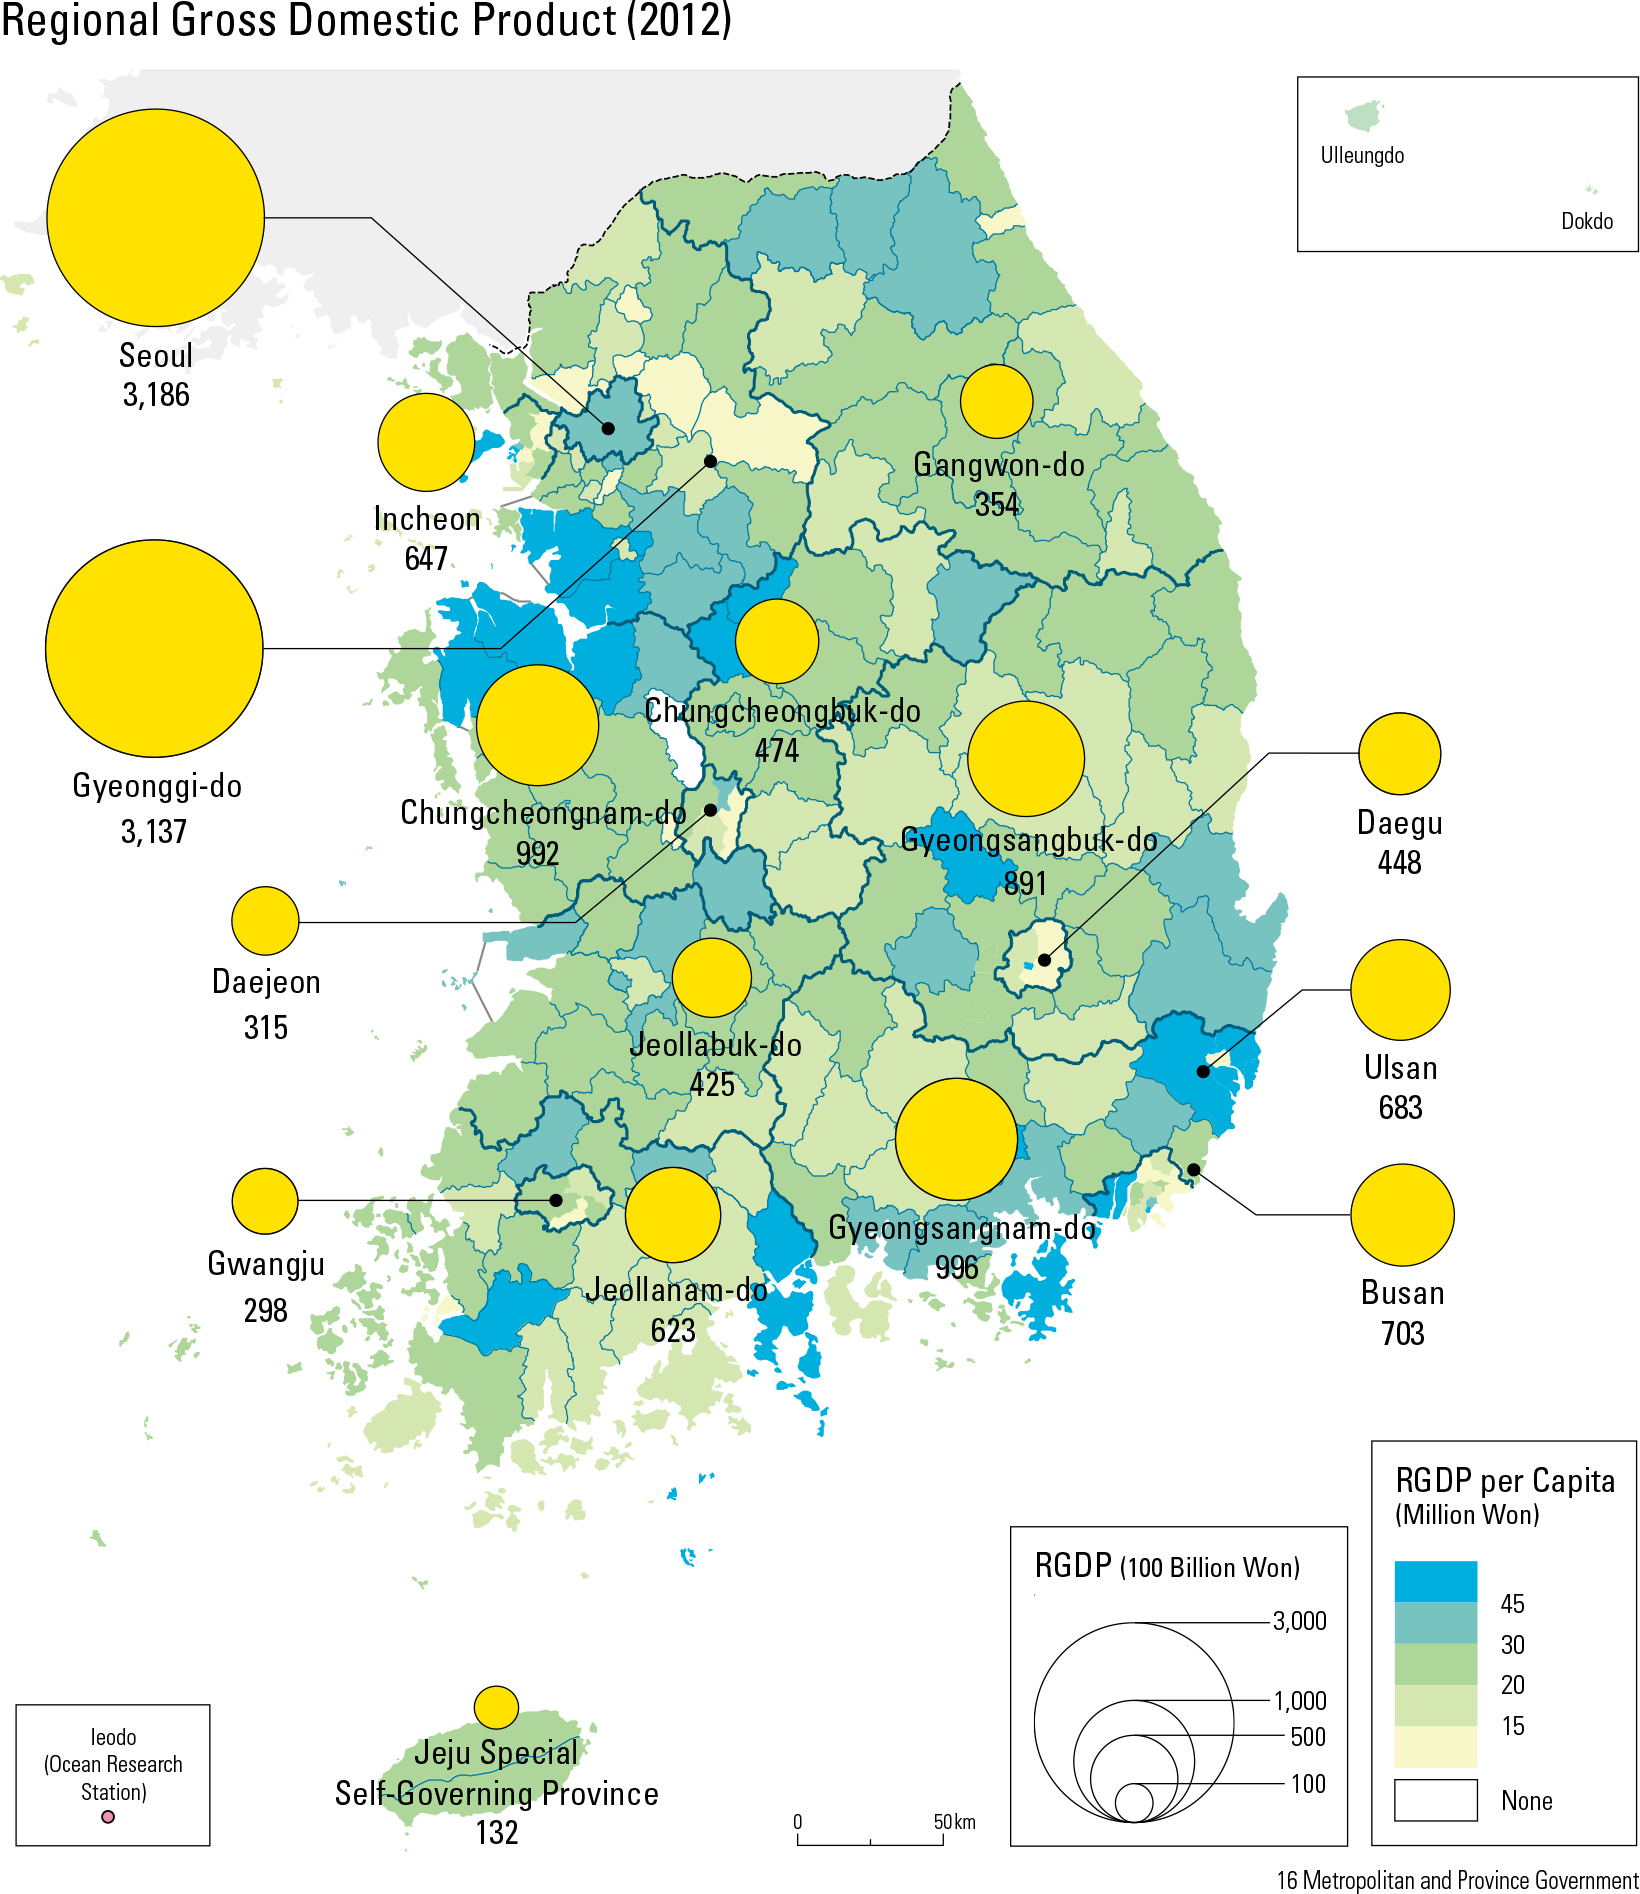
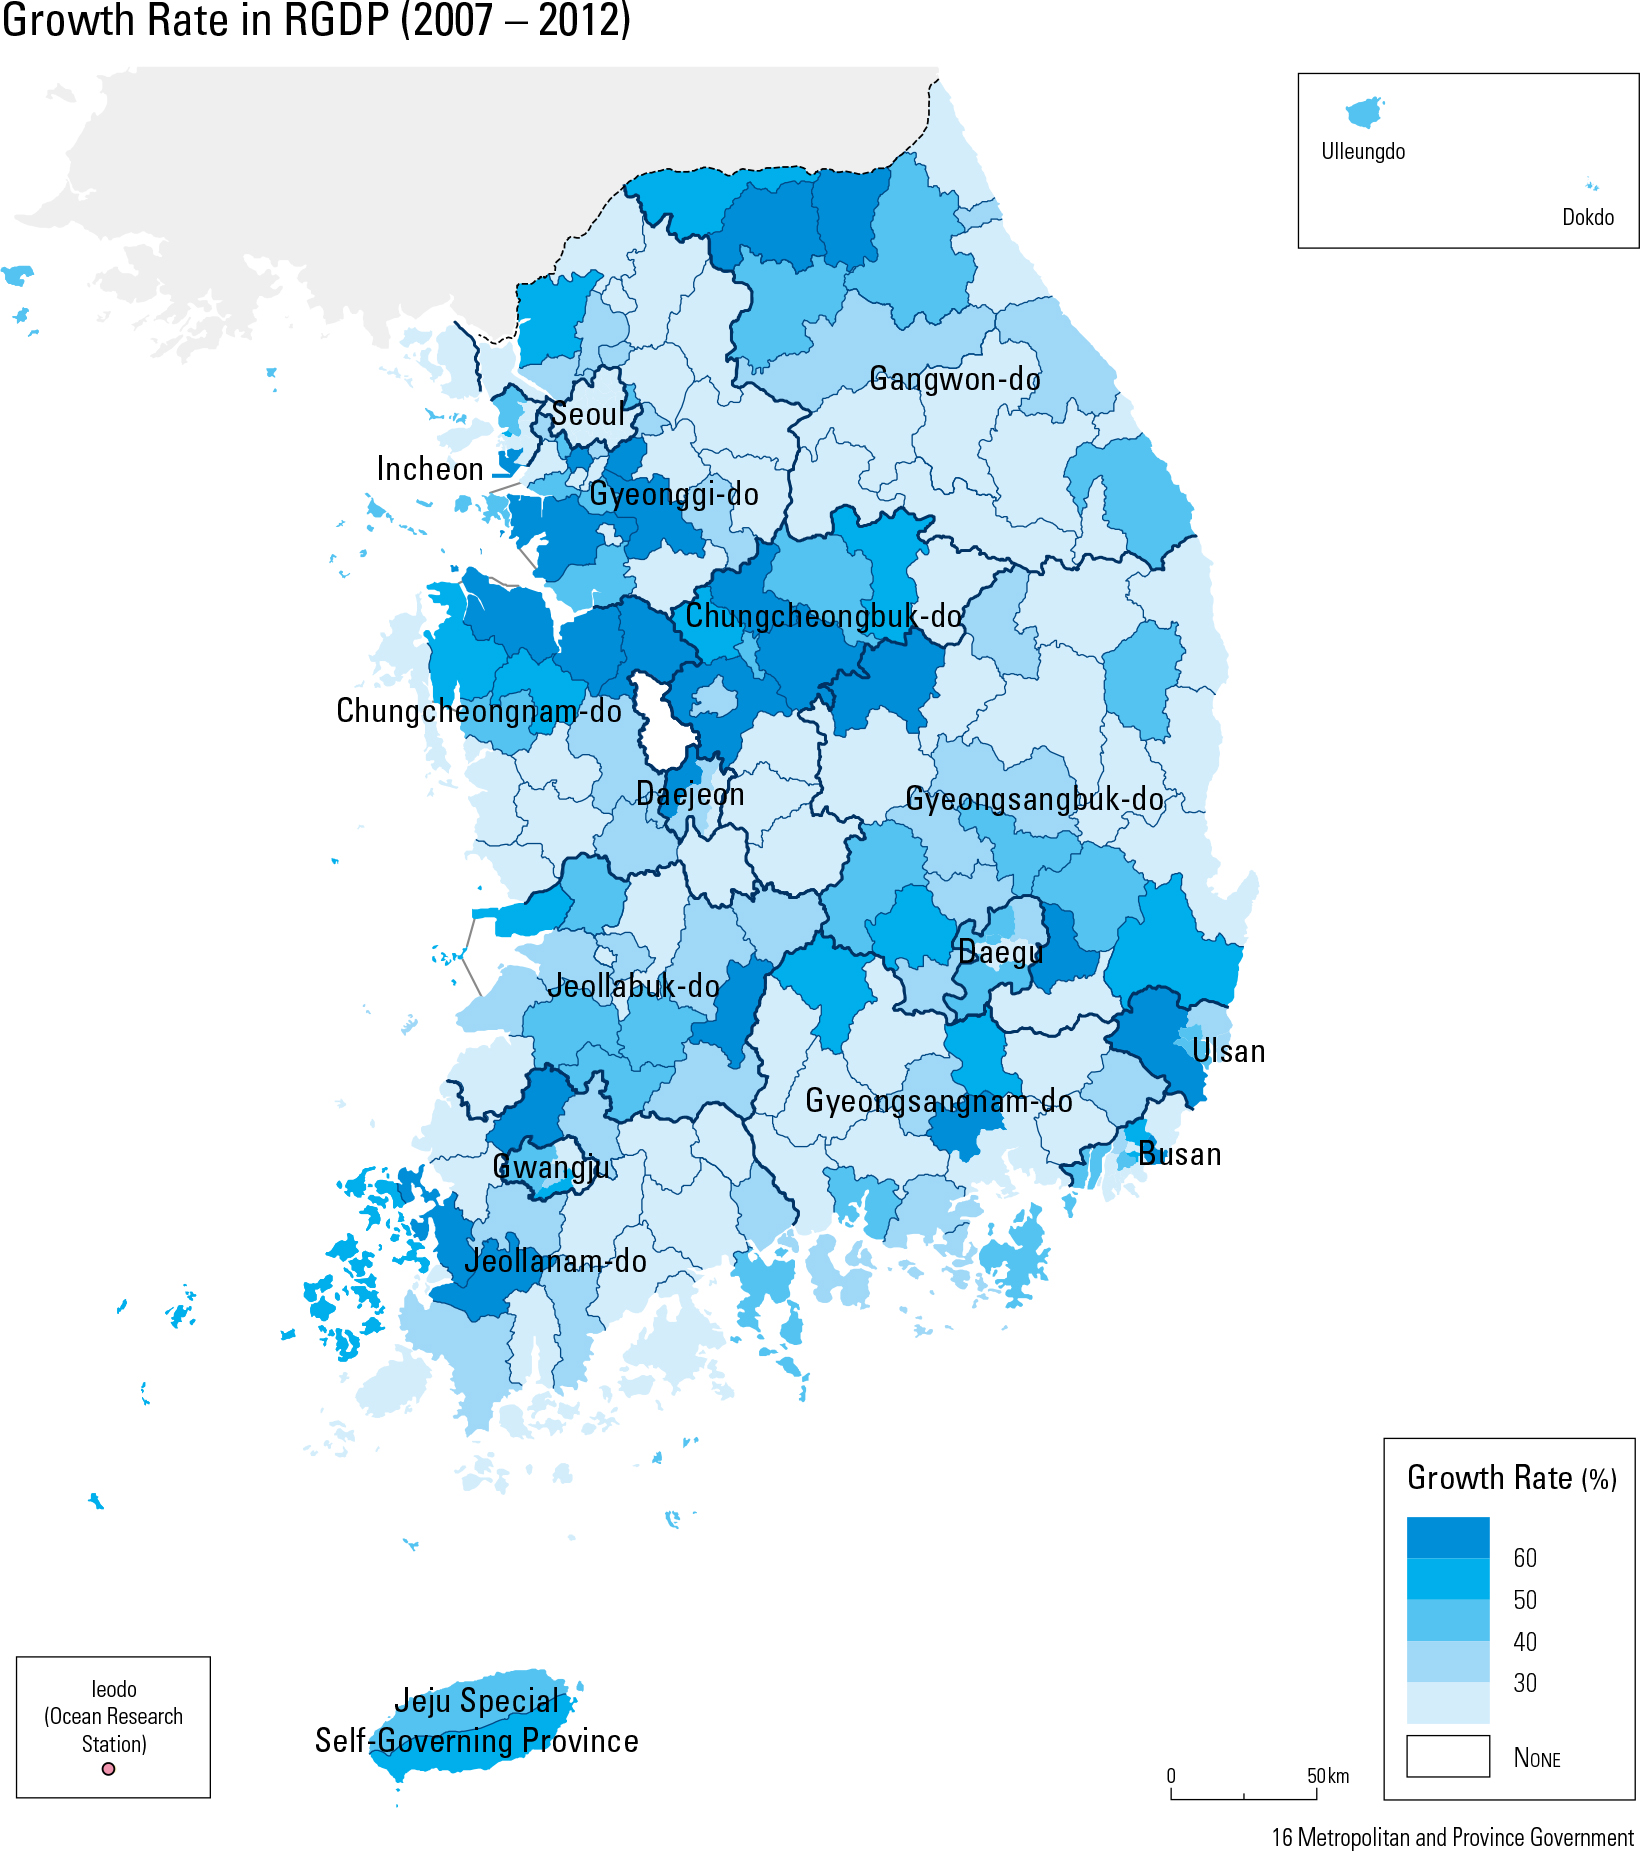
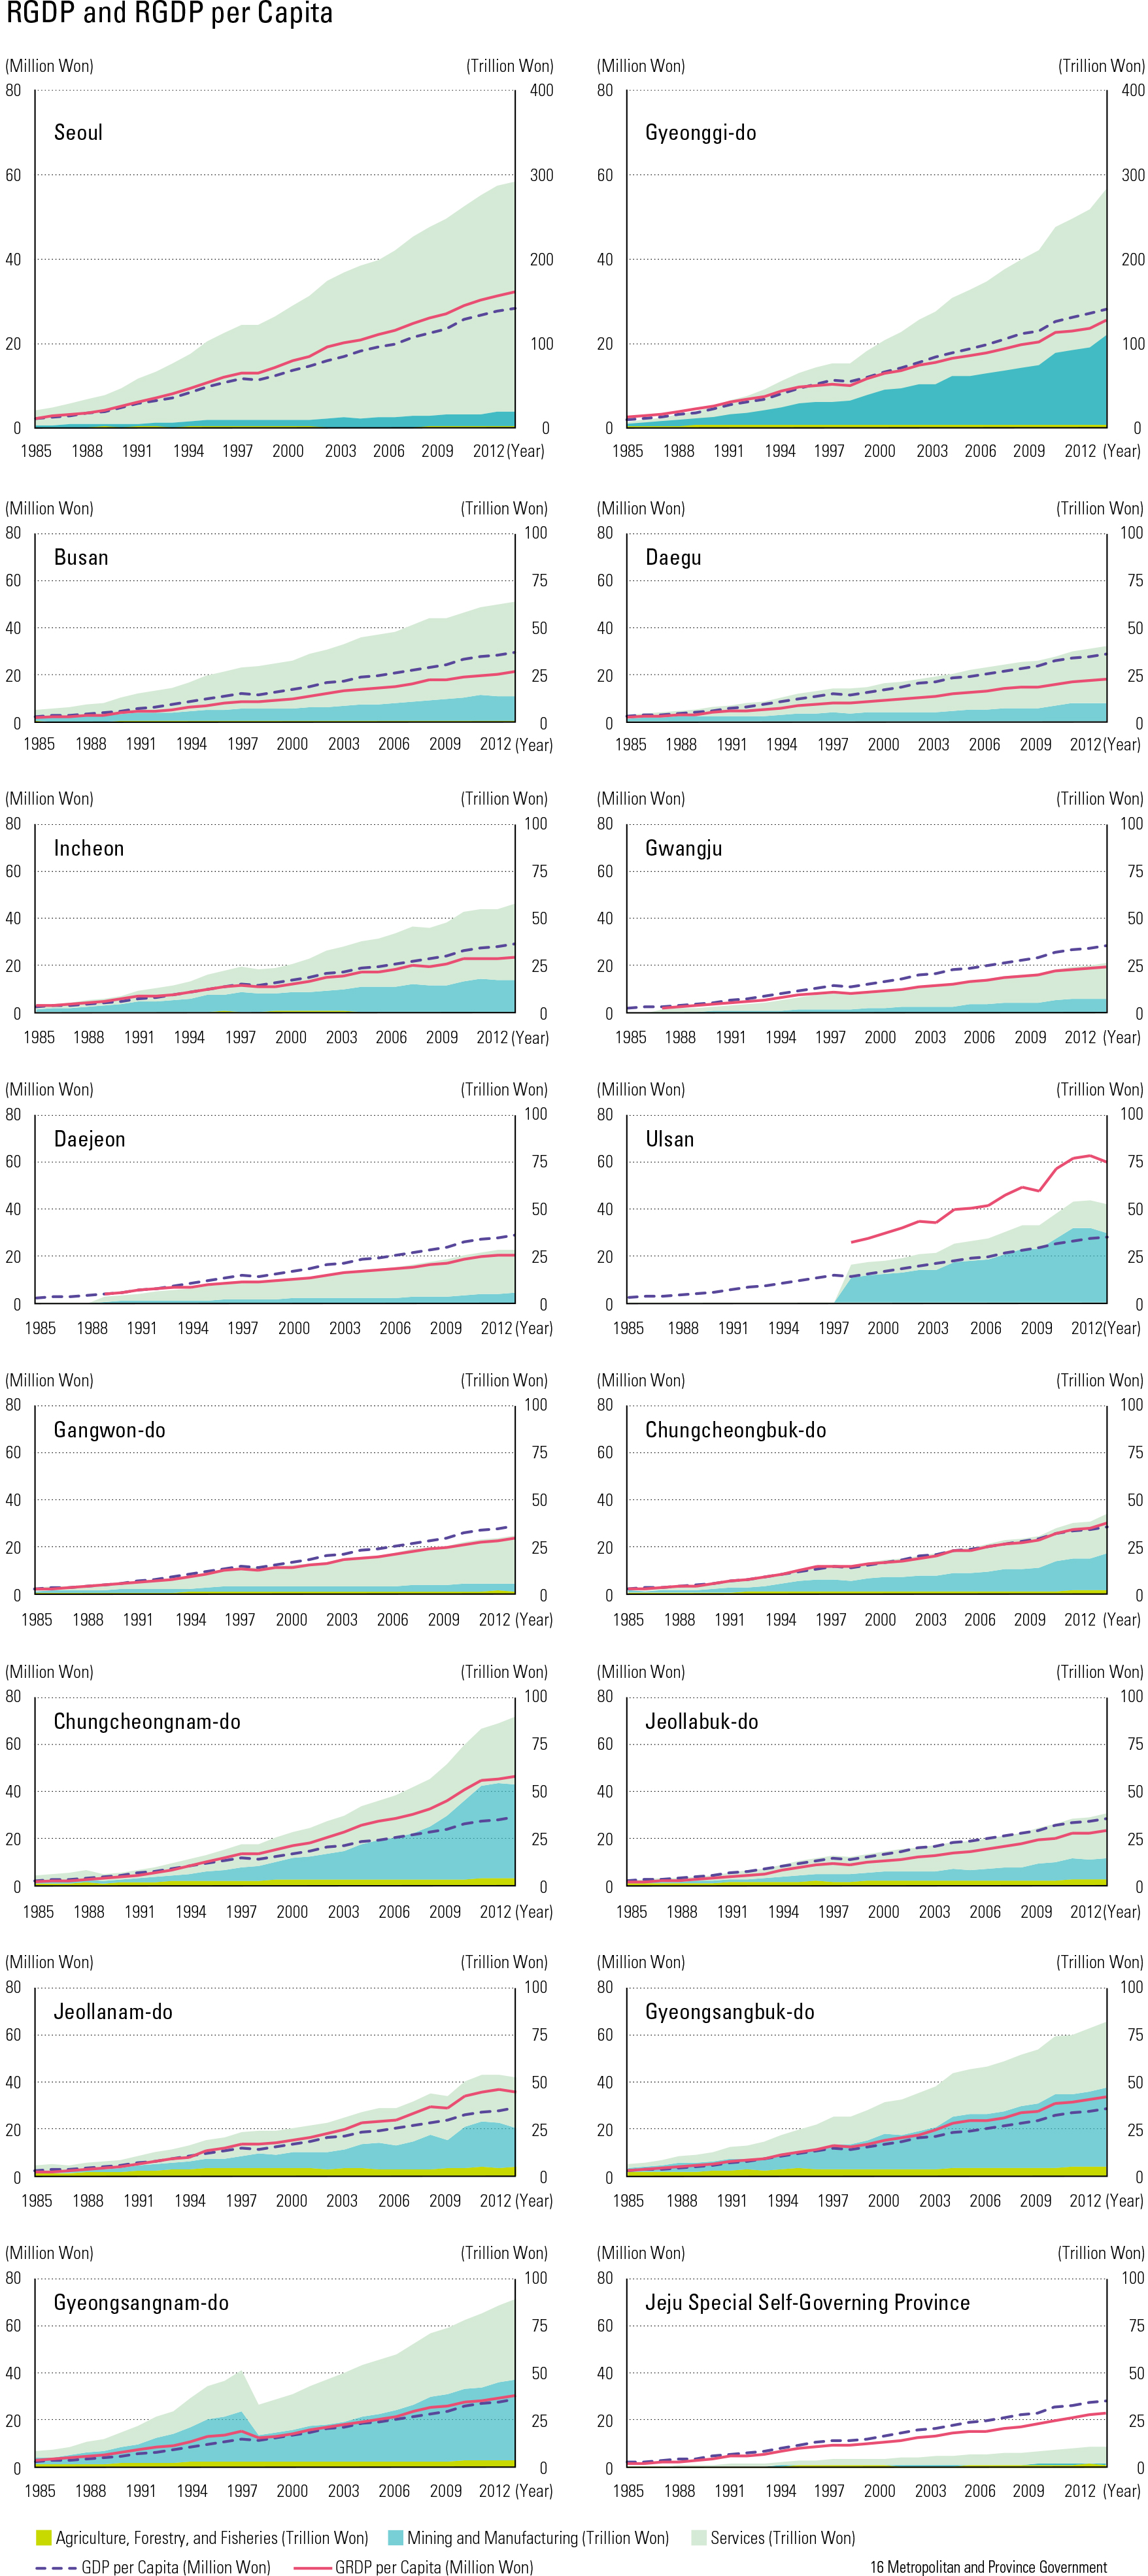
An analysis of the industrial structure of cities and provinces through the changes in regional GDP between 1985 and 2013 shows that all areas experienced growth in regional GDP. In particular, the rapid growth of Gyeonggi-do is noticeable; in 1985, Seoul had 22.9 trillion won, while Gyeonggi-do had 12.5 trillion won, not even 55% of Seoul. However, in 2013, Gyeonggi-do improved its regional GDP to 313.6 trillion won, almost the same level as Seoul with 318.6 trillion won. The agriculture, forestry, and fishery industries showed proportionate losses in all areas, while service sectors gained proportionately in all regions. In particular, Seoul gained the mostly in service and related sectors, increasing sharply from 87.9% in 1985 to 93.2% in 2013, which re ects the service-oriented industrial restructuring process. The manufacturing sector showed proportionate losses in the greater metropolitan areas, while other areas gained proportionately in the manufacturing sector. Gyeonggi-do, Chungcheongbuk-do, and Chungcheongnam-do showed pronounced increases in manufacturing growth, indicating a new growth trend in the region south of the Greater Seoul Metropolitan area, Chungcheongnam-do, and Chungcheongbuk-do.The regional per capita GDP by city (-si) and county (-gun) in 2012 was as follows: Asan- si (89.69 million won), Yeongam-gun (80.59 million won), Dangjin-si (72.97 million won), Yeosu-si (71.68 million won), Gwangyang- si (69.68 million won), Gumi-si (63.45 million won), Ulsan (63.42 million won), and Seosan-si (60.77 million won).
page_2 |