English III
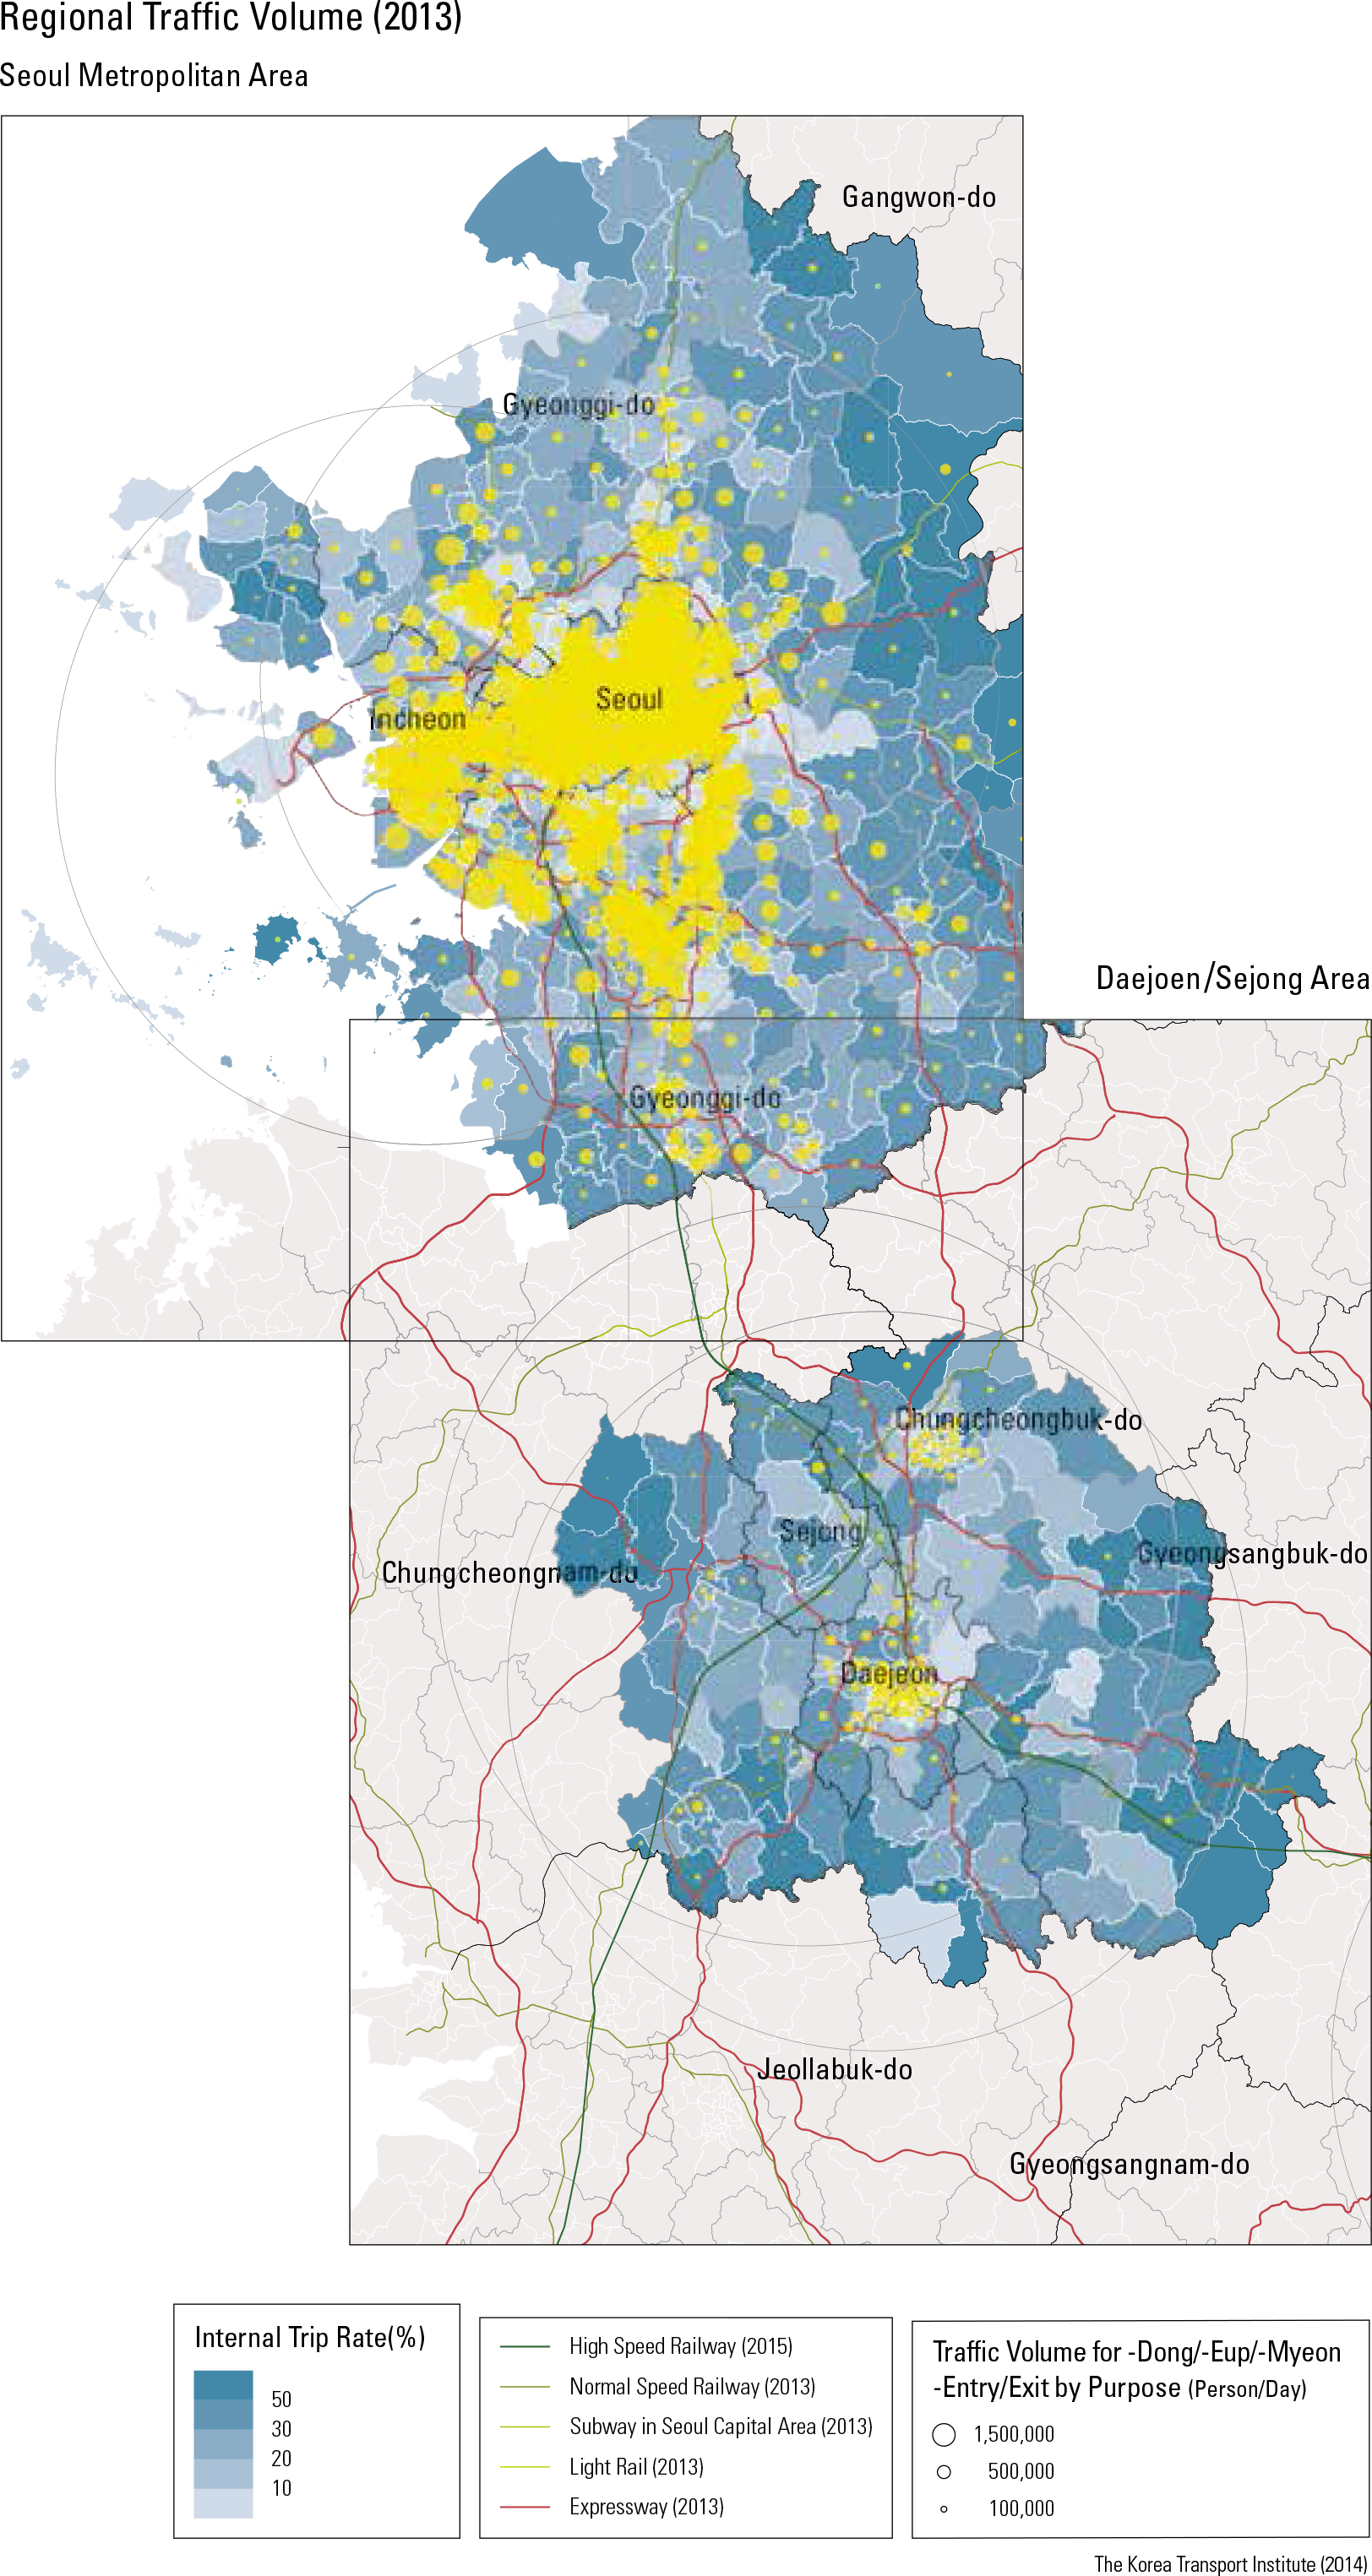
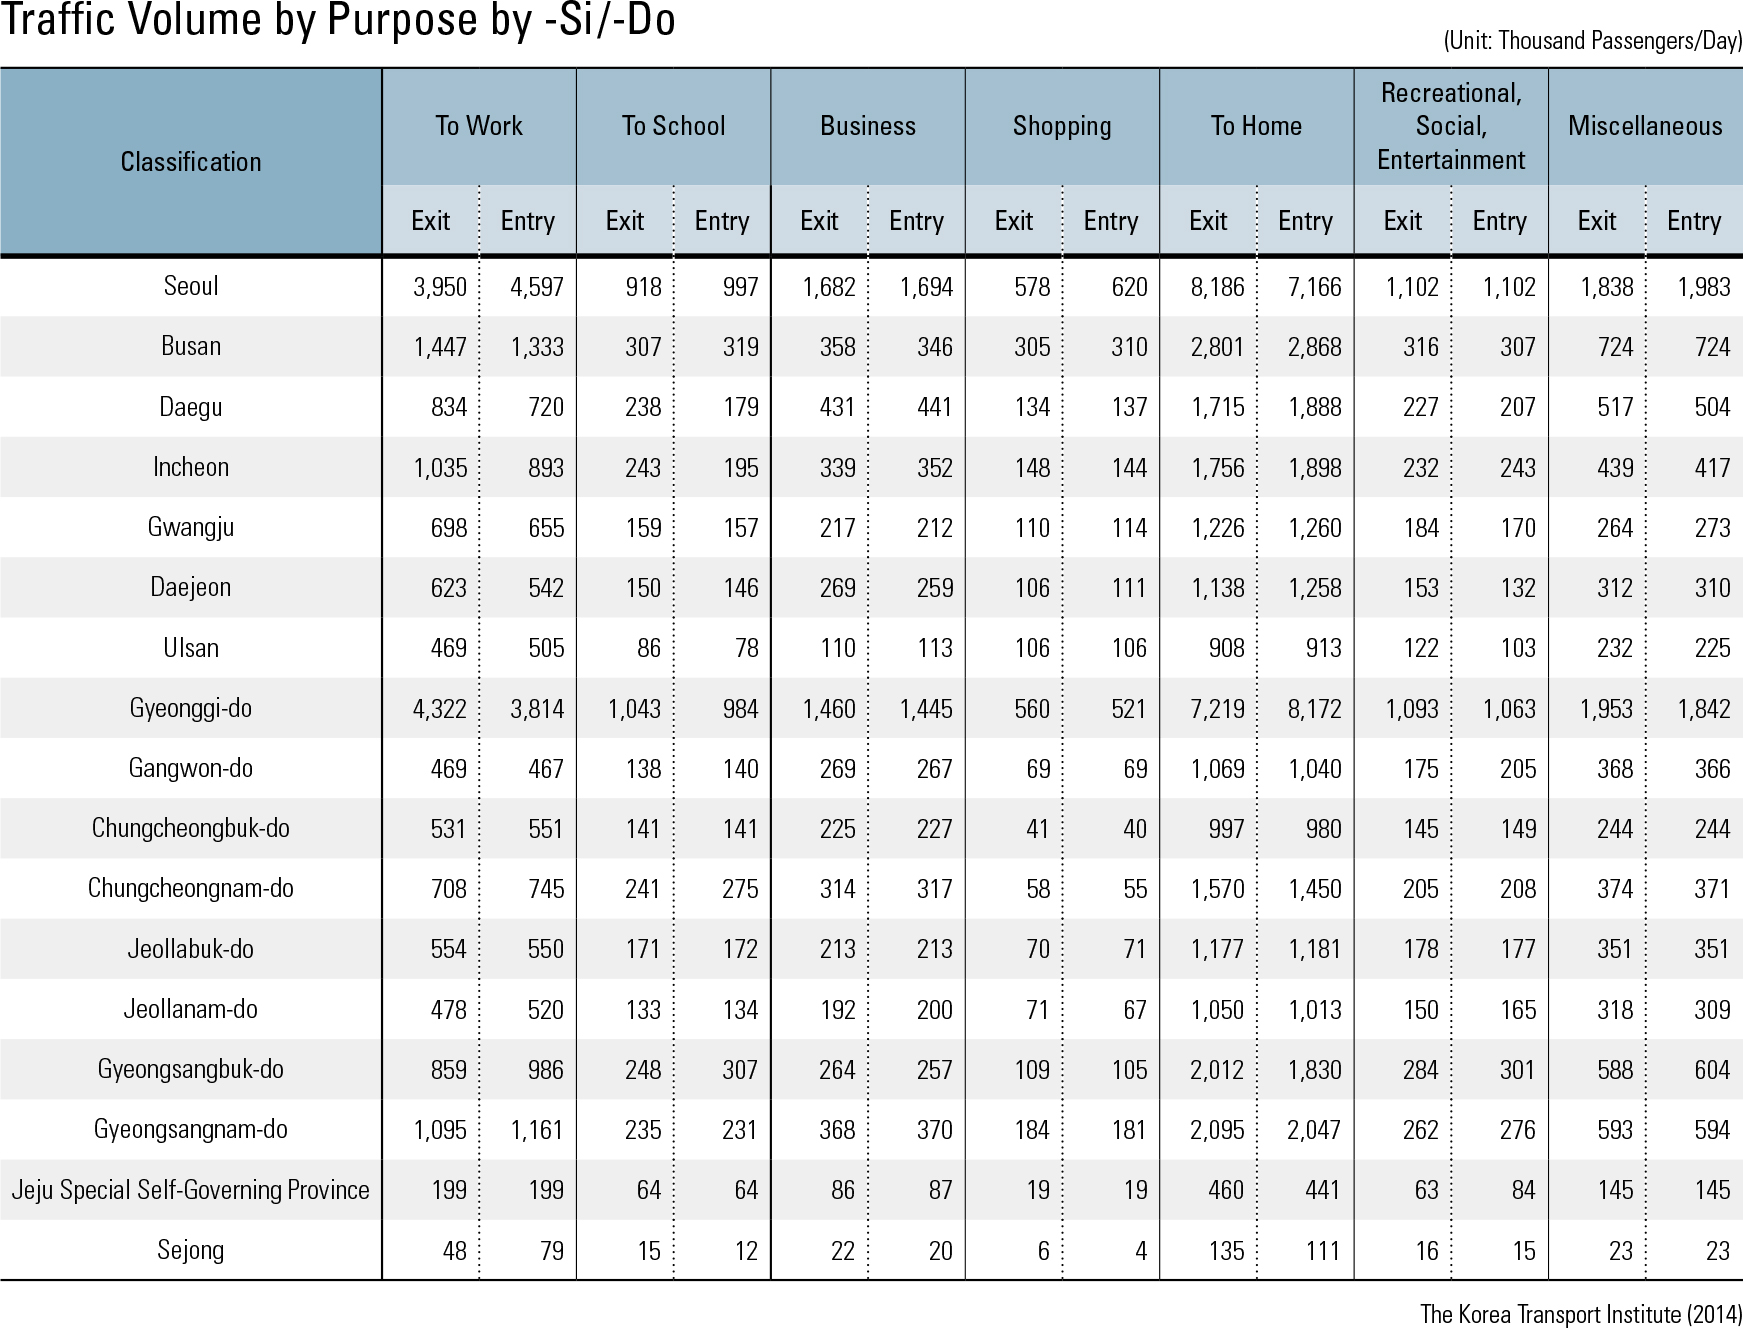
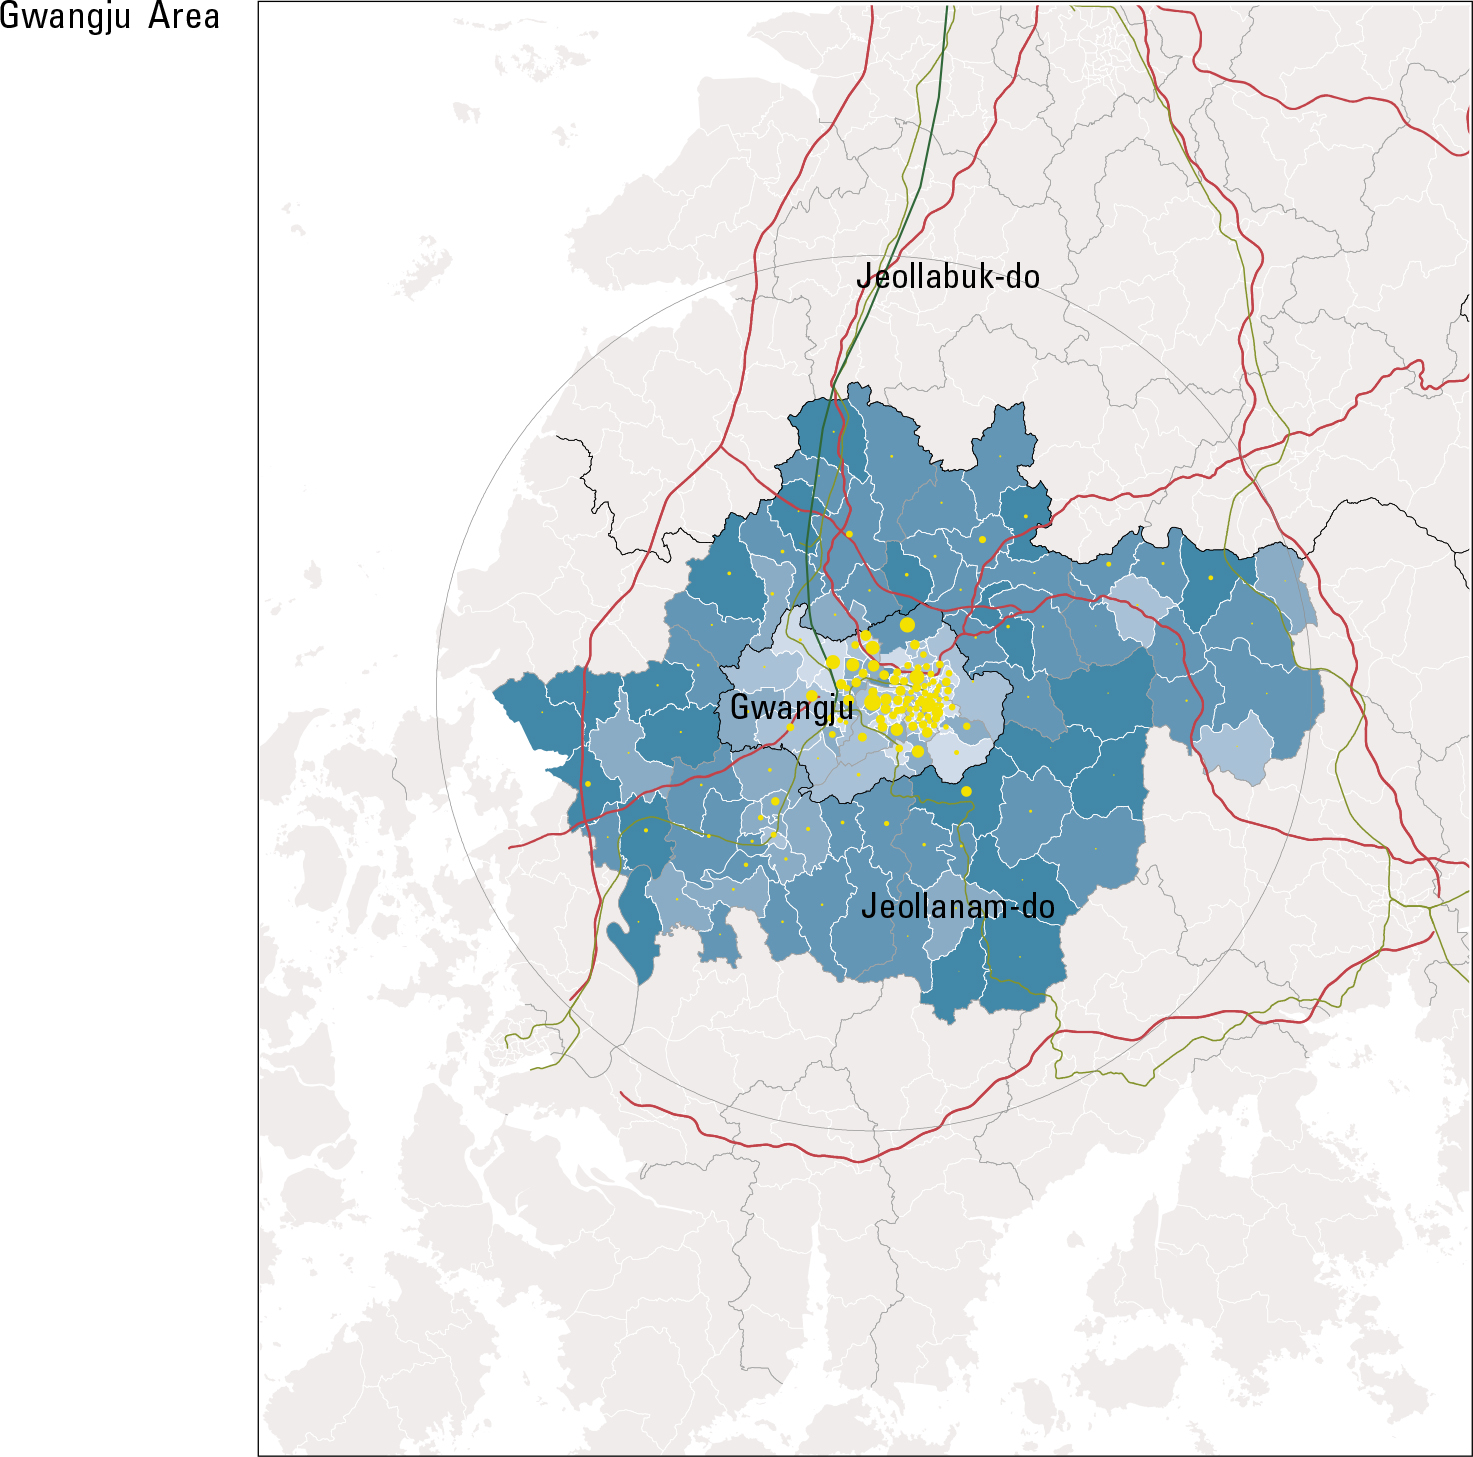
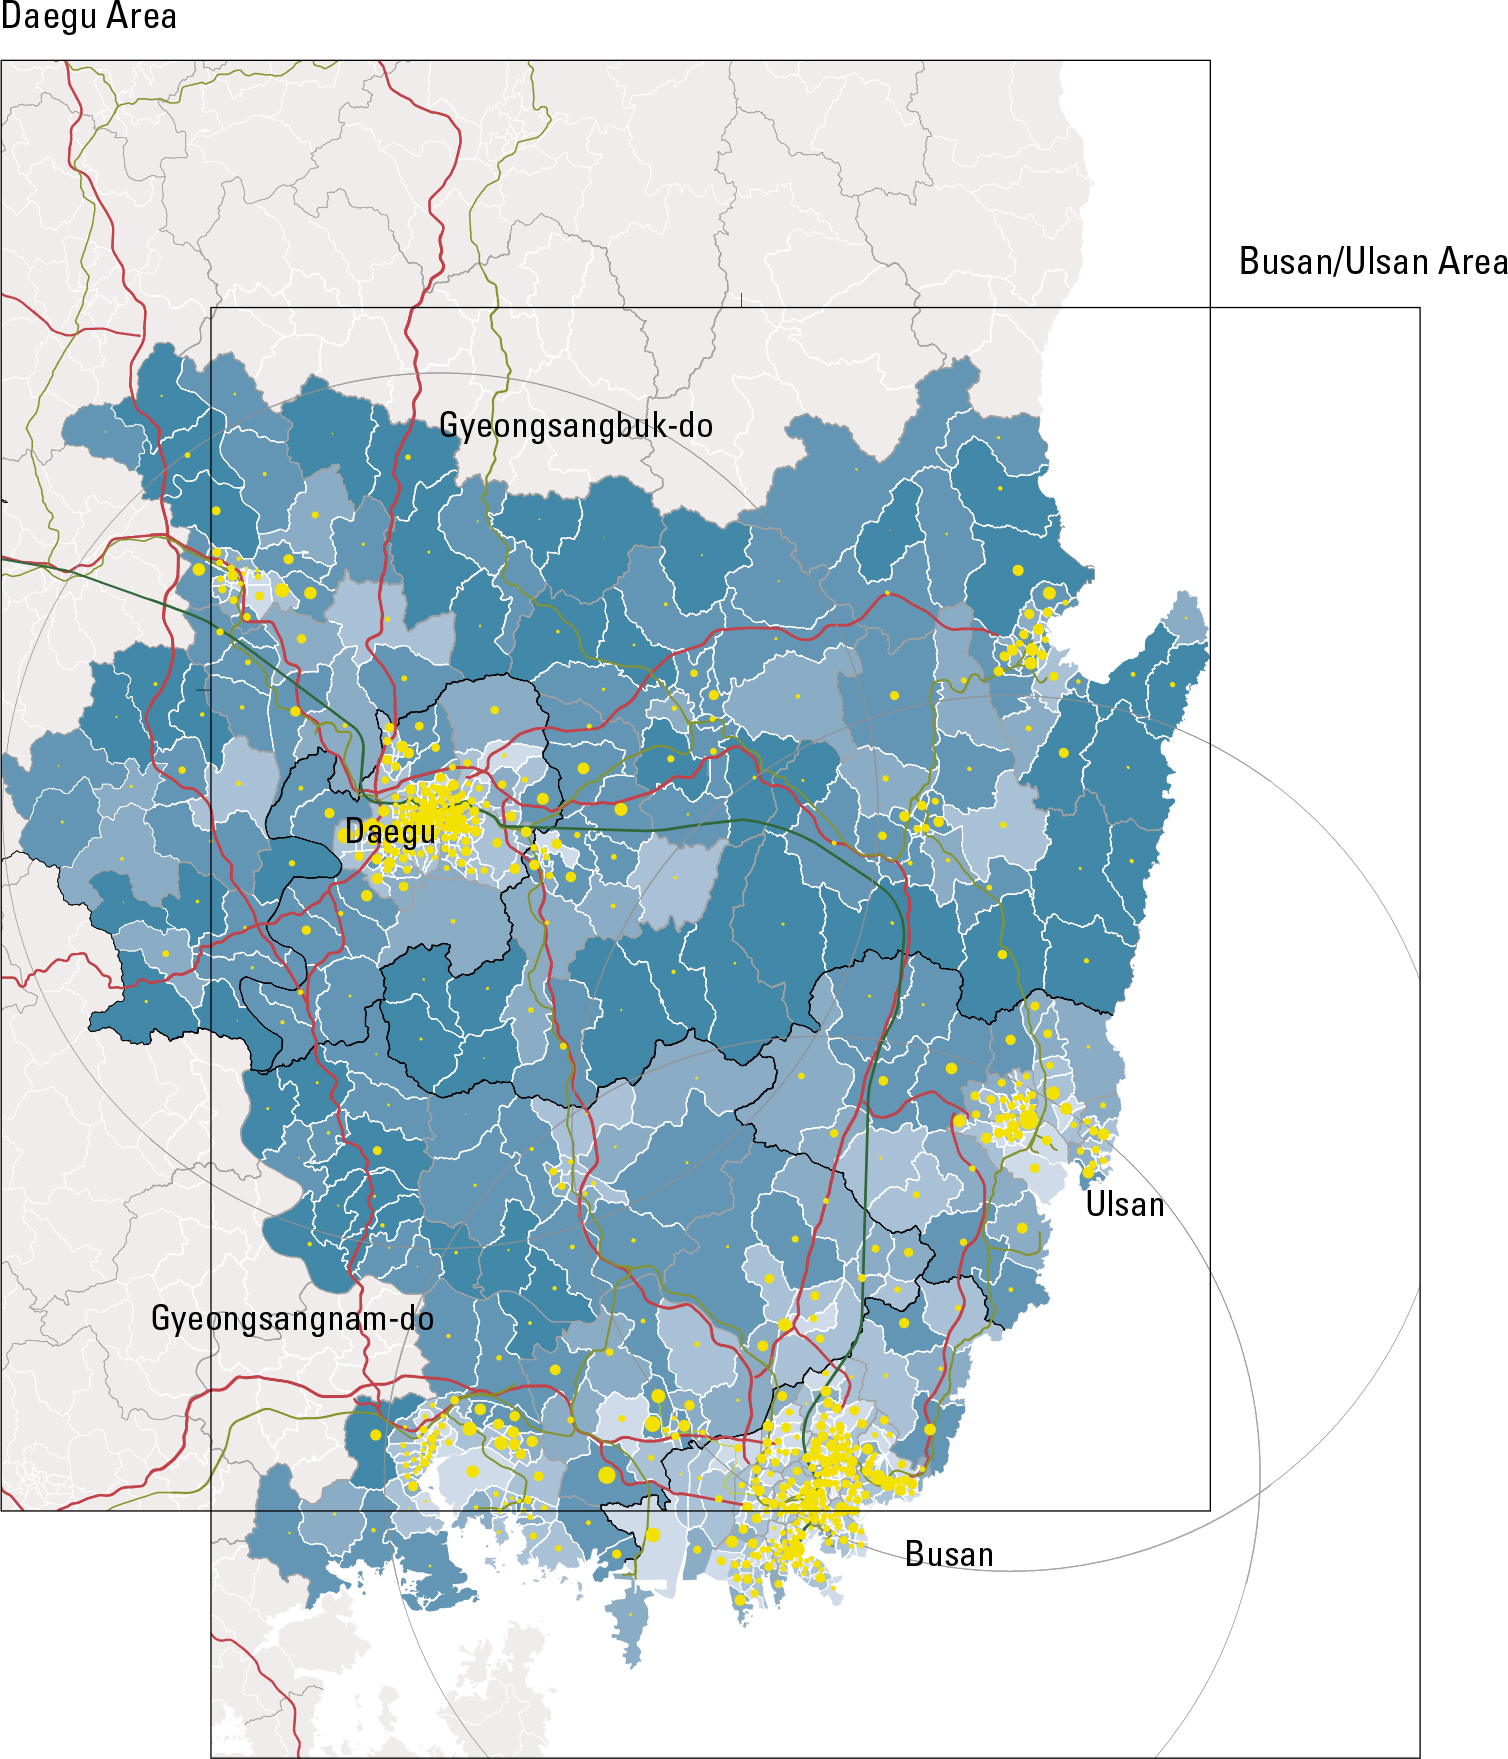
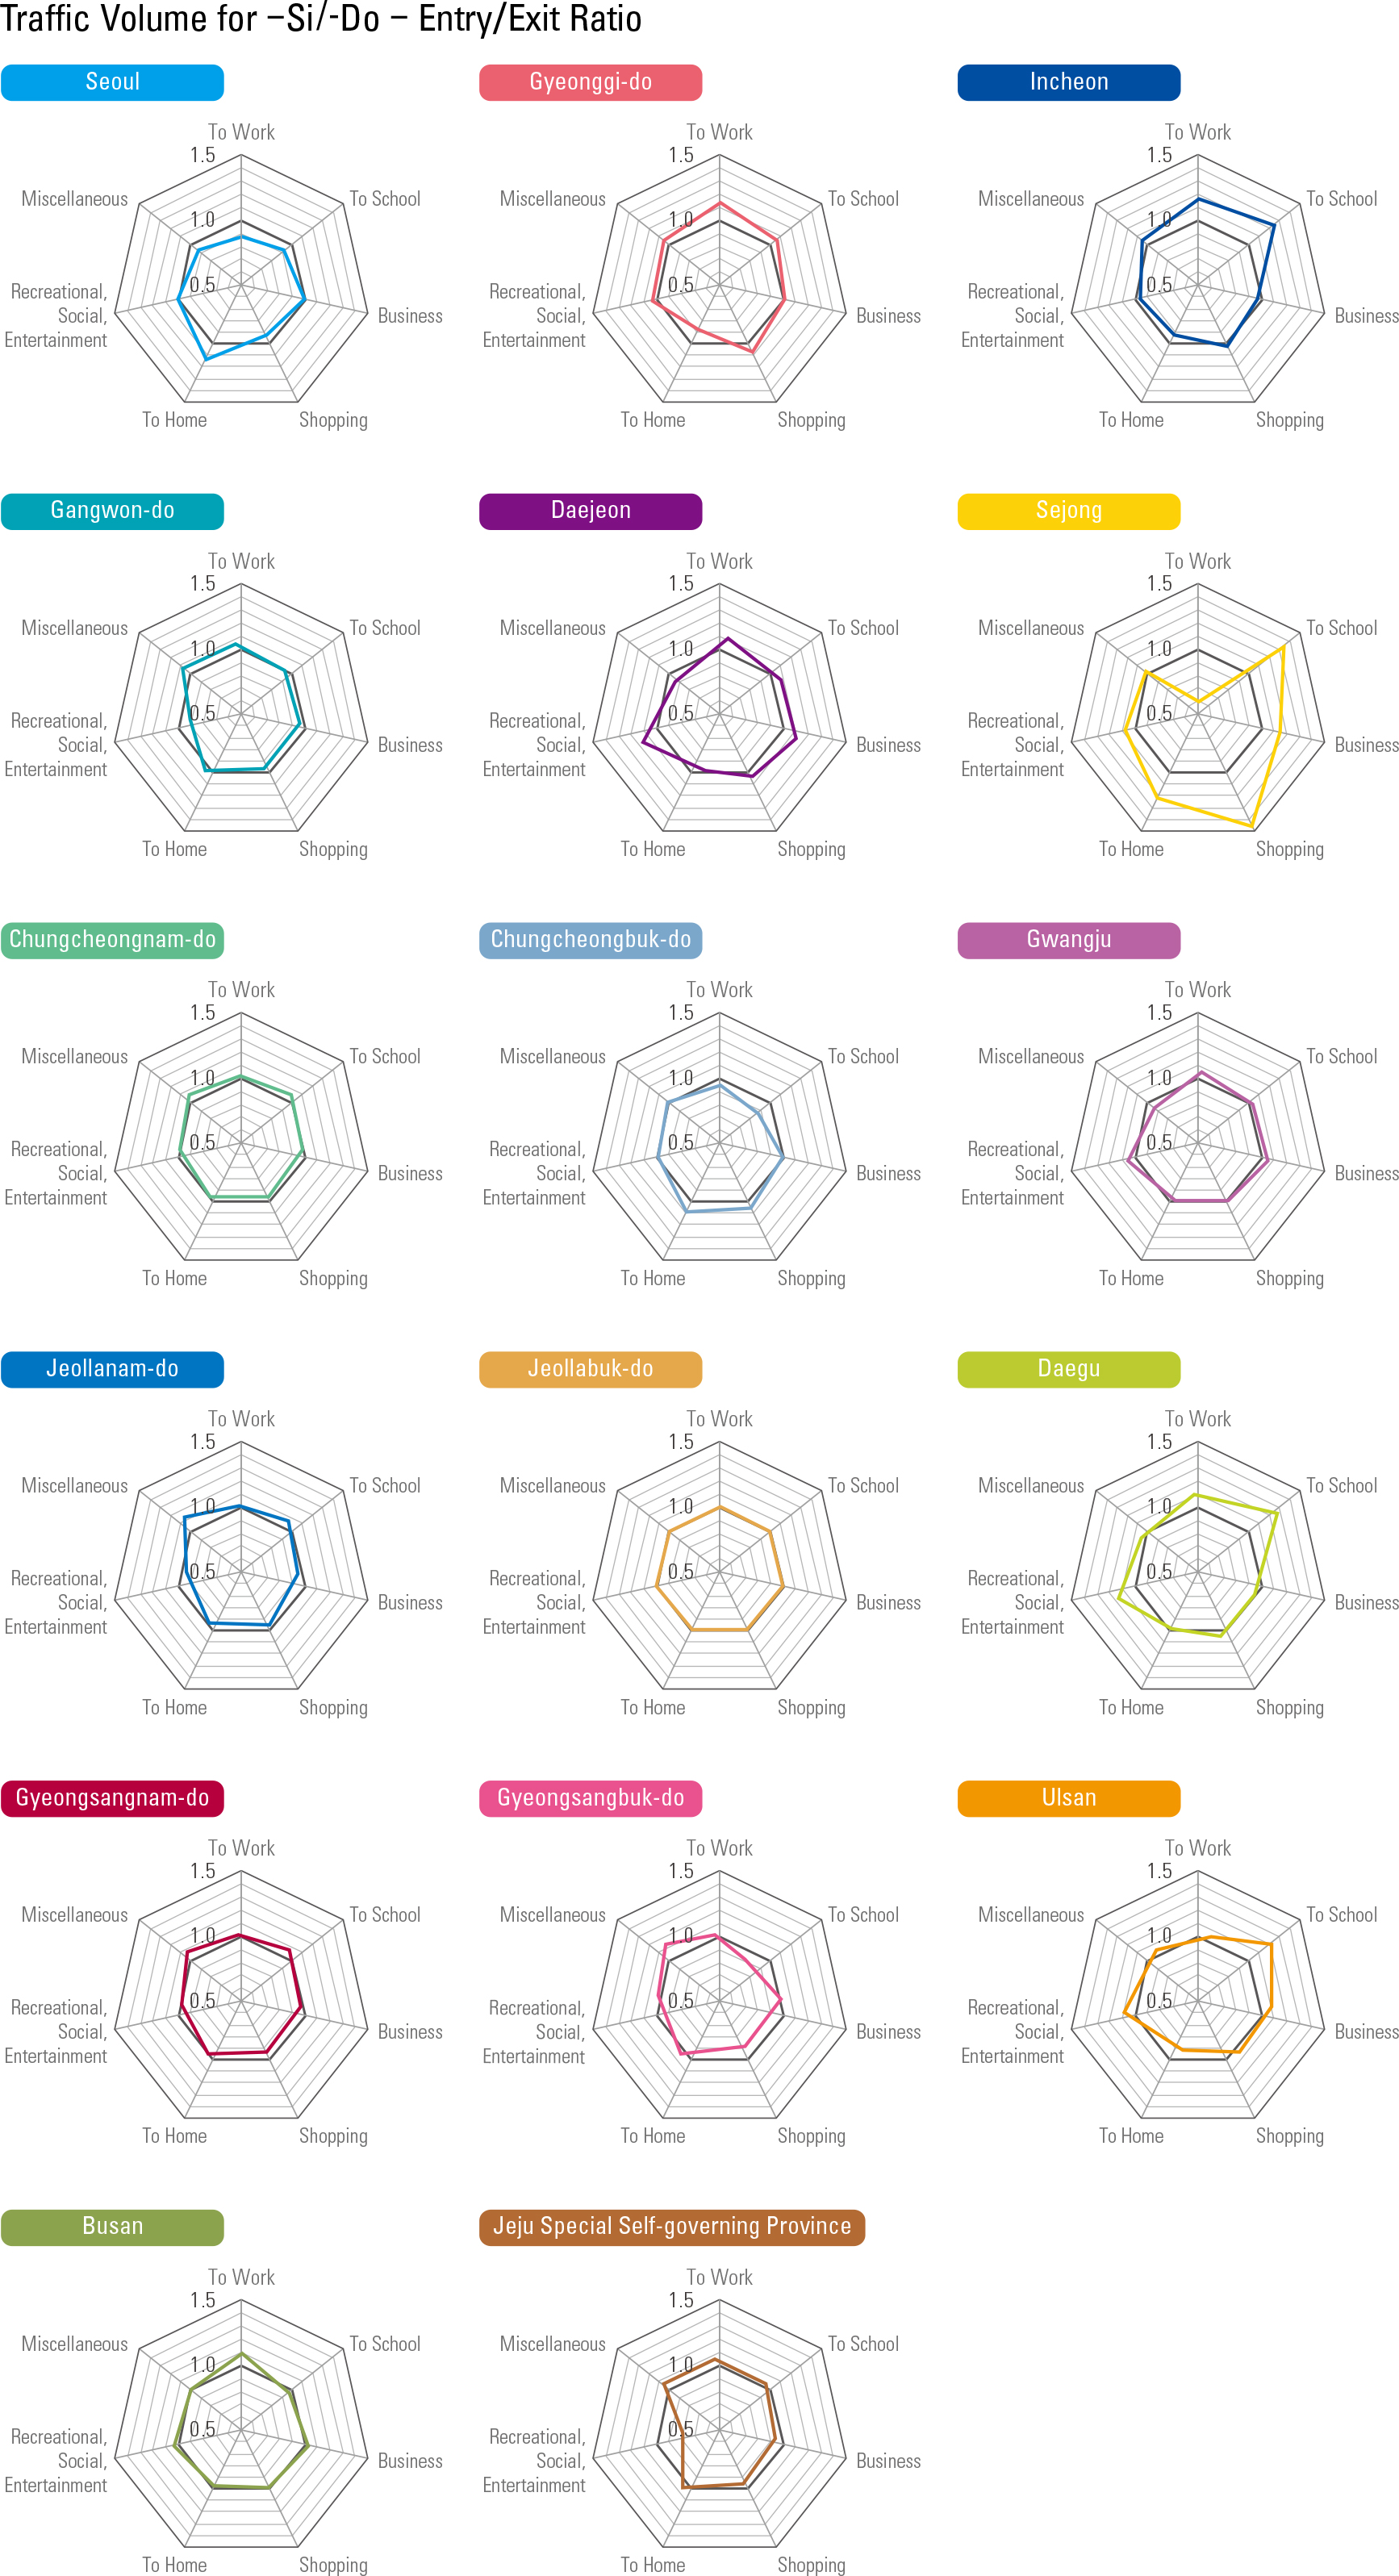
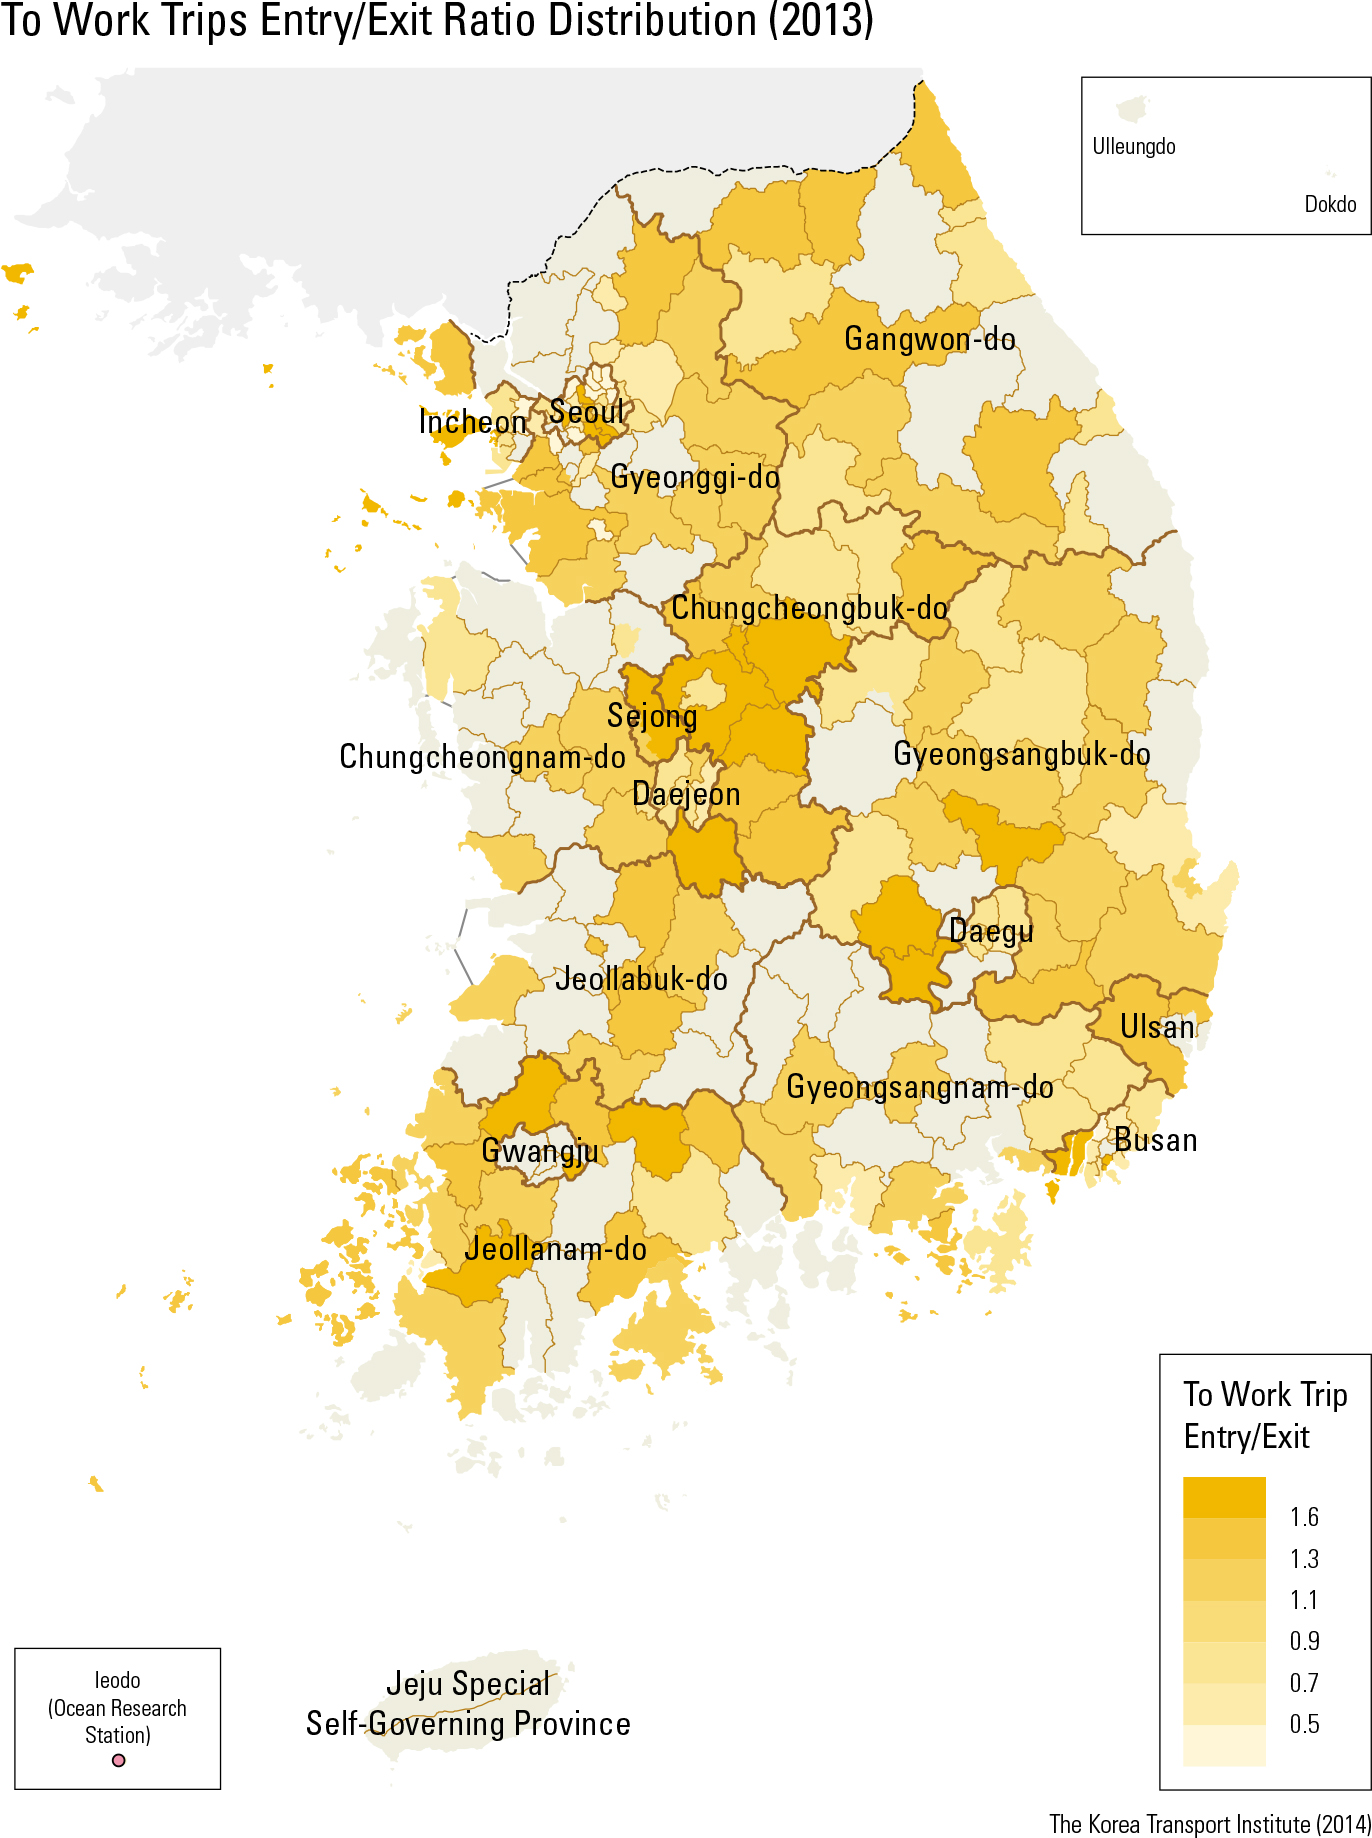
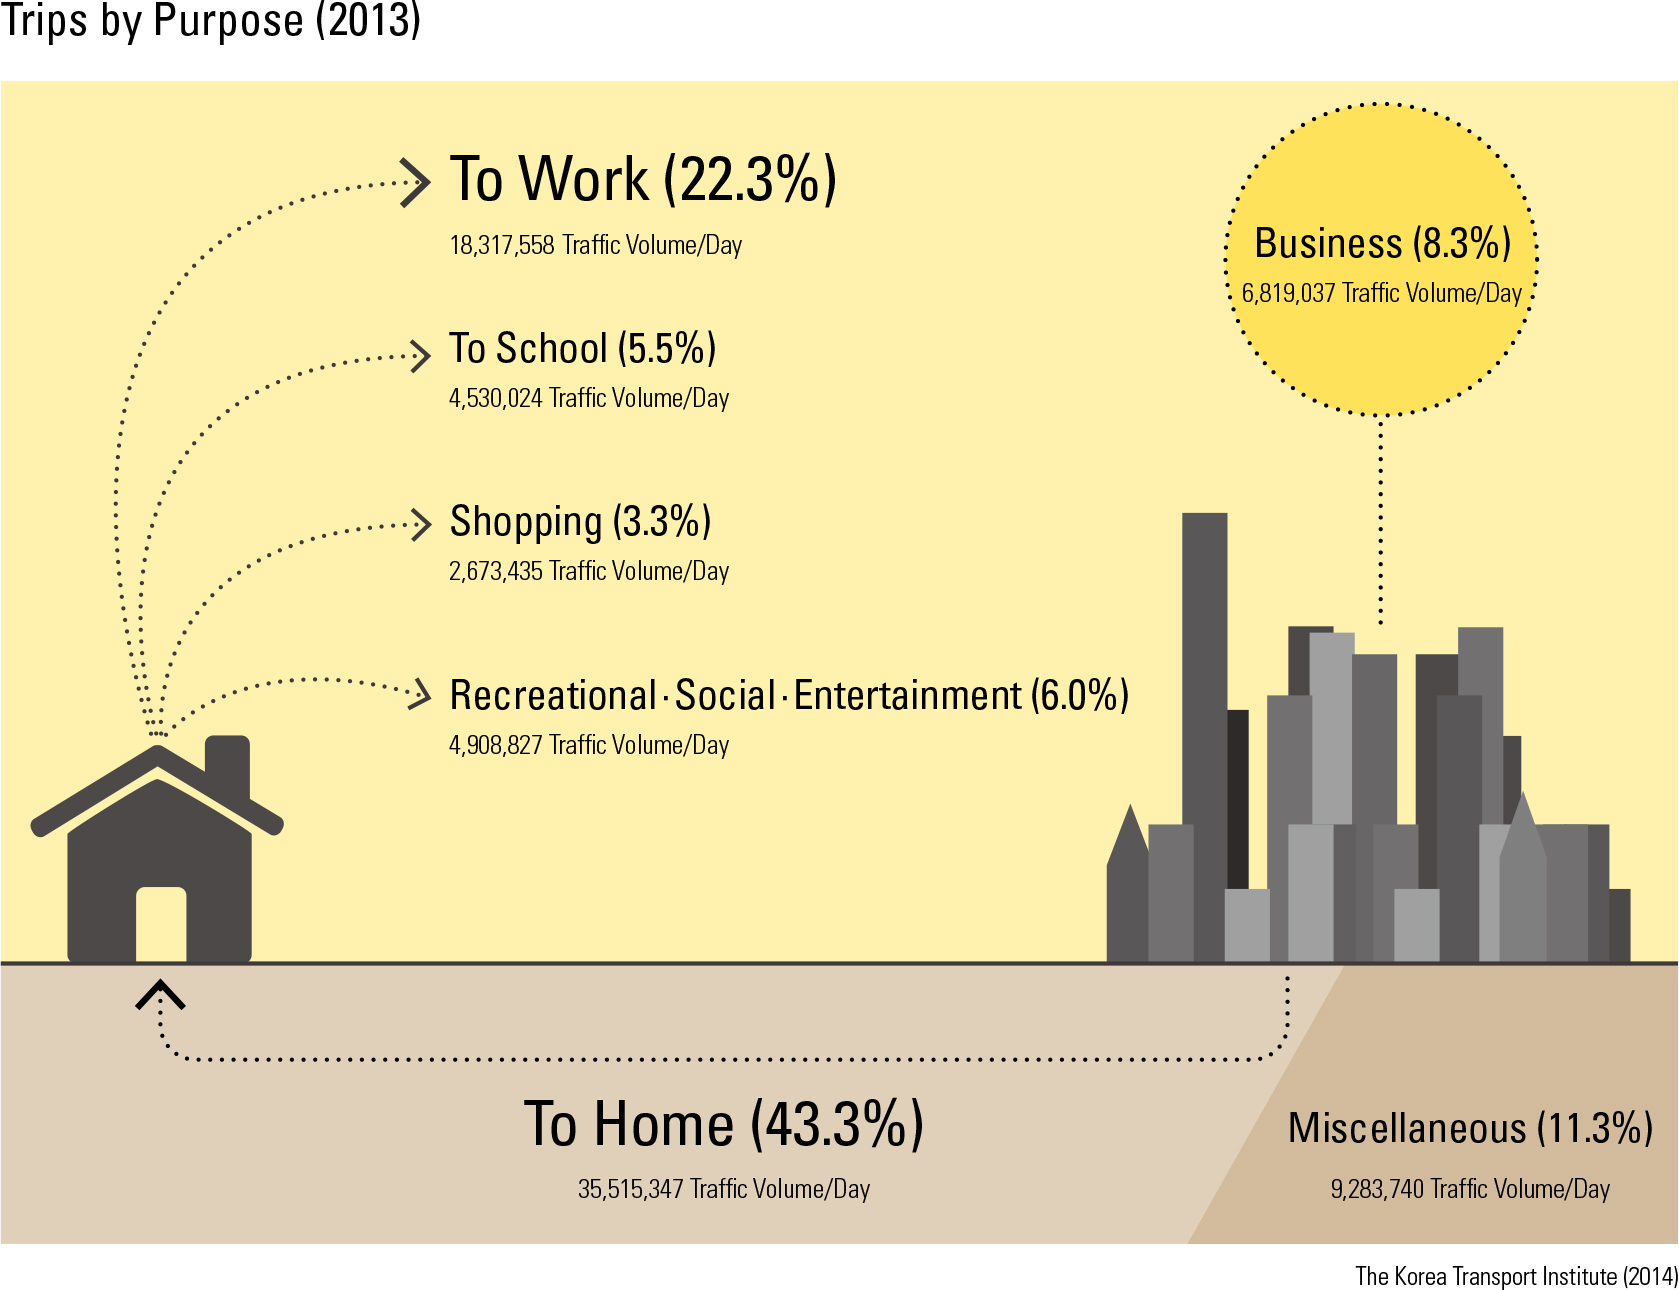
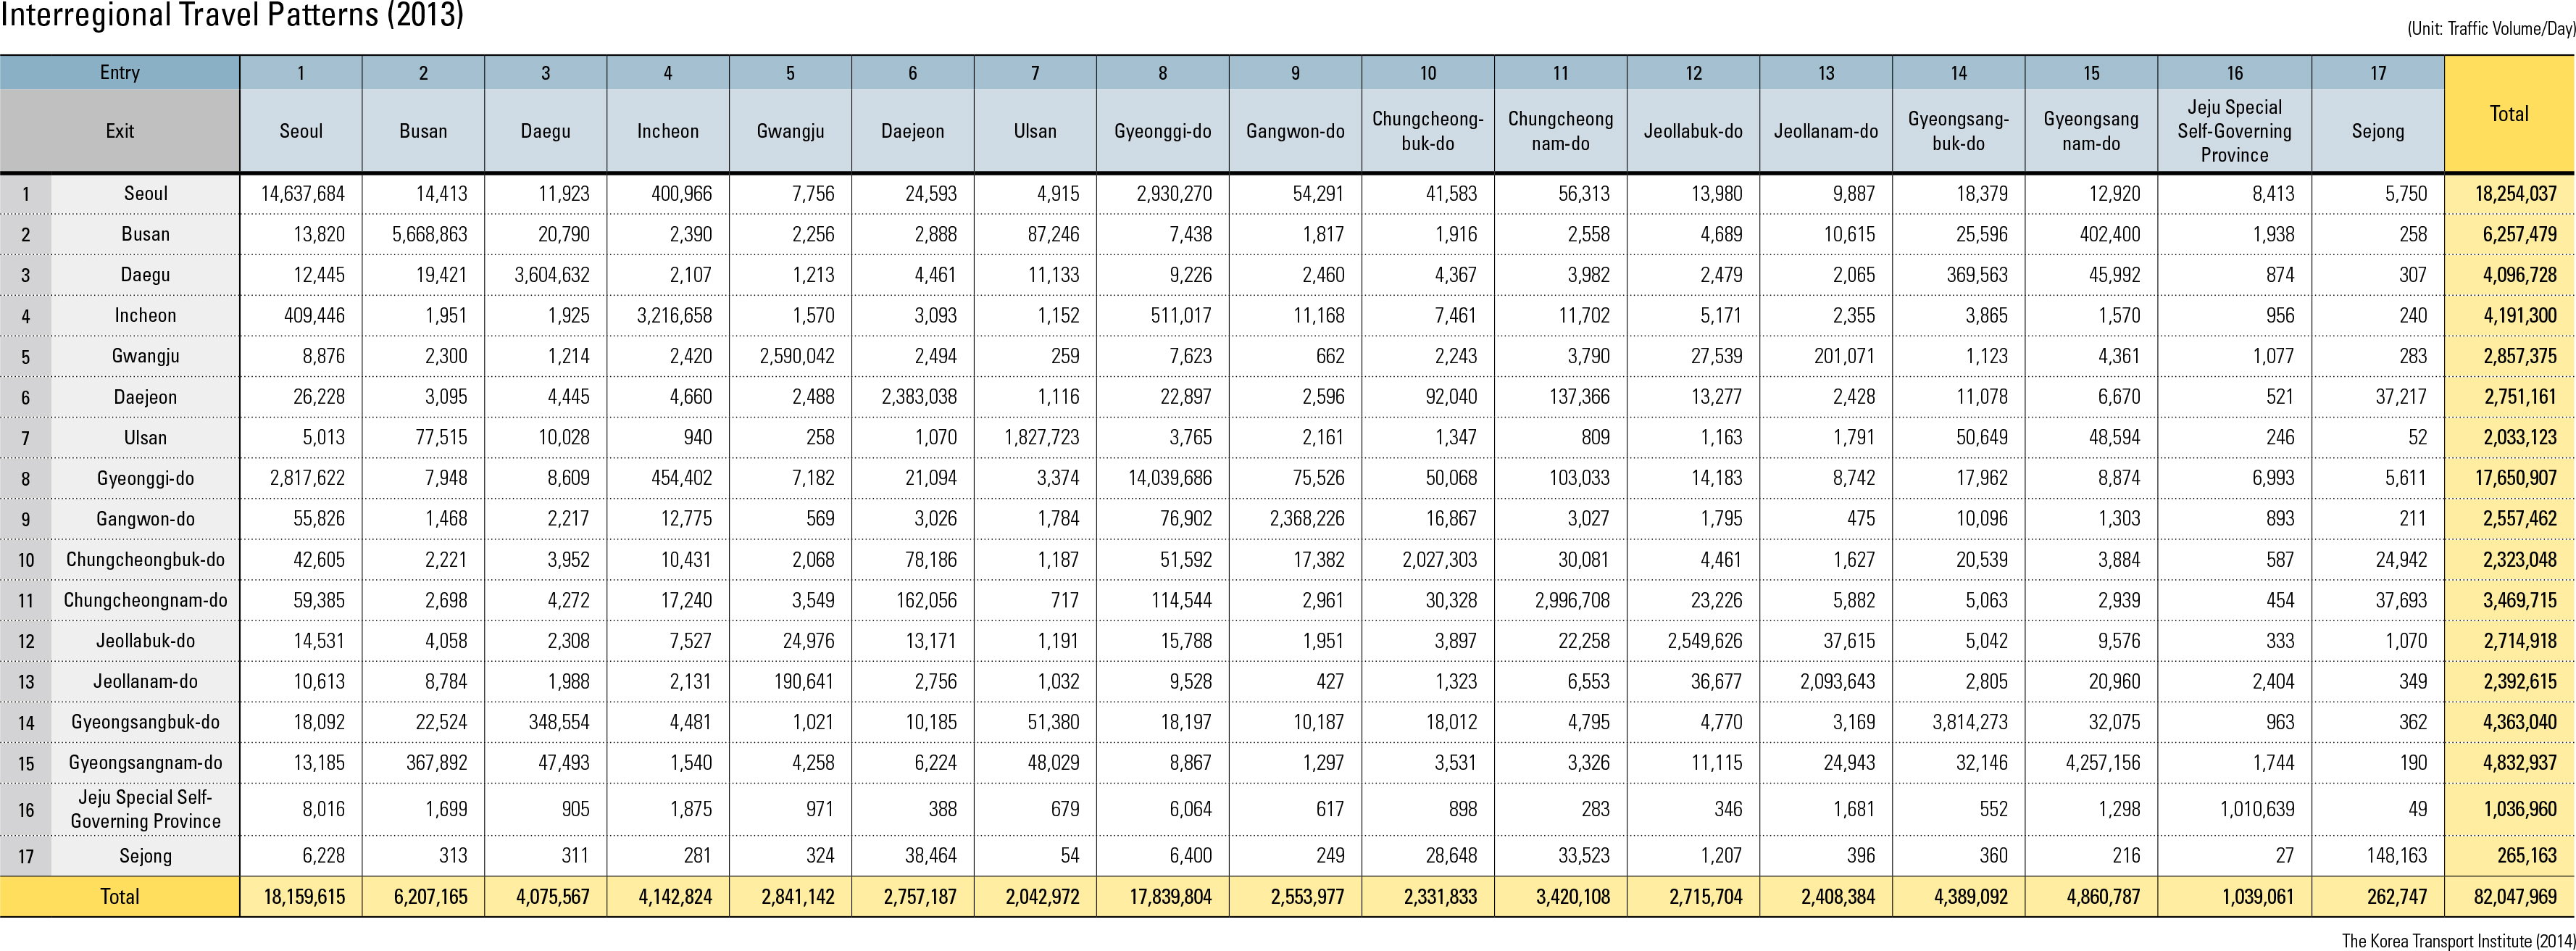
By trip purpose, “to work” accounted for 22.3% of all trips, followed by “business” (8.3%), “so- cial/recreational/entertainment” (6.3%), “school” (5.5%), and “shopping” (3.3%) . This generation of trips leads to traffic heading home after late afternoon, and “from work” trips accounted for 43.3% of all trips. The traffic volume in the Seoul Capital Area is approximately 50%, about the same as the traffic volume in the metropolitan cities. When the trips are examined by purpose (“commute,” “business,” “school,” etc.), slight- ly different patterns emerge. The number of “to work” and “business” trips in metropolitan cities accounted for approximately 50%, whereas for “school,” the proportion is 45% and for “shop- ping,” the proportion reaches 58%. On the other hand, the number of “shopping” trips does not stand out in the Seoul Capital Area. As metropolitan areas expanded, the numbe of trips crossing administrative boundaries in- creased. Particularly in the Seoul Capital Area, due to improved regional public transportation and construction of the Seoul Ring Expressway, approximately 28% of all “to work” trips orig- inate from outside Seoul (3.7% from Incheon, 24.1% from Gyeonggi-do). About 22% of “to work” trips in Incheon Metropolitan City also originate from outside the city limits, including 9% from Seoul. On the other hand, more than 95% of all “to work” trips originate internally in Daejeon, Gwangju, and Daegu metropolitan cit- ies. In Ulsan and Busan metropolitan cities, inter- nal “to work” trips accounted for 82% and 93% of the total, respectively. An examination of trips entering and leaving Seoul confirms the increase in travel volume outside Seoul as the entire Capi- tal Area was developed.
page_2 |