English I
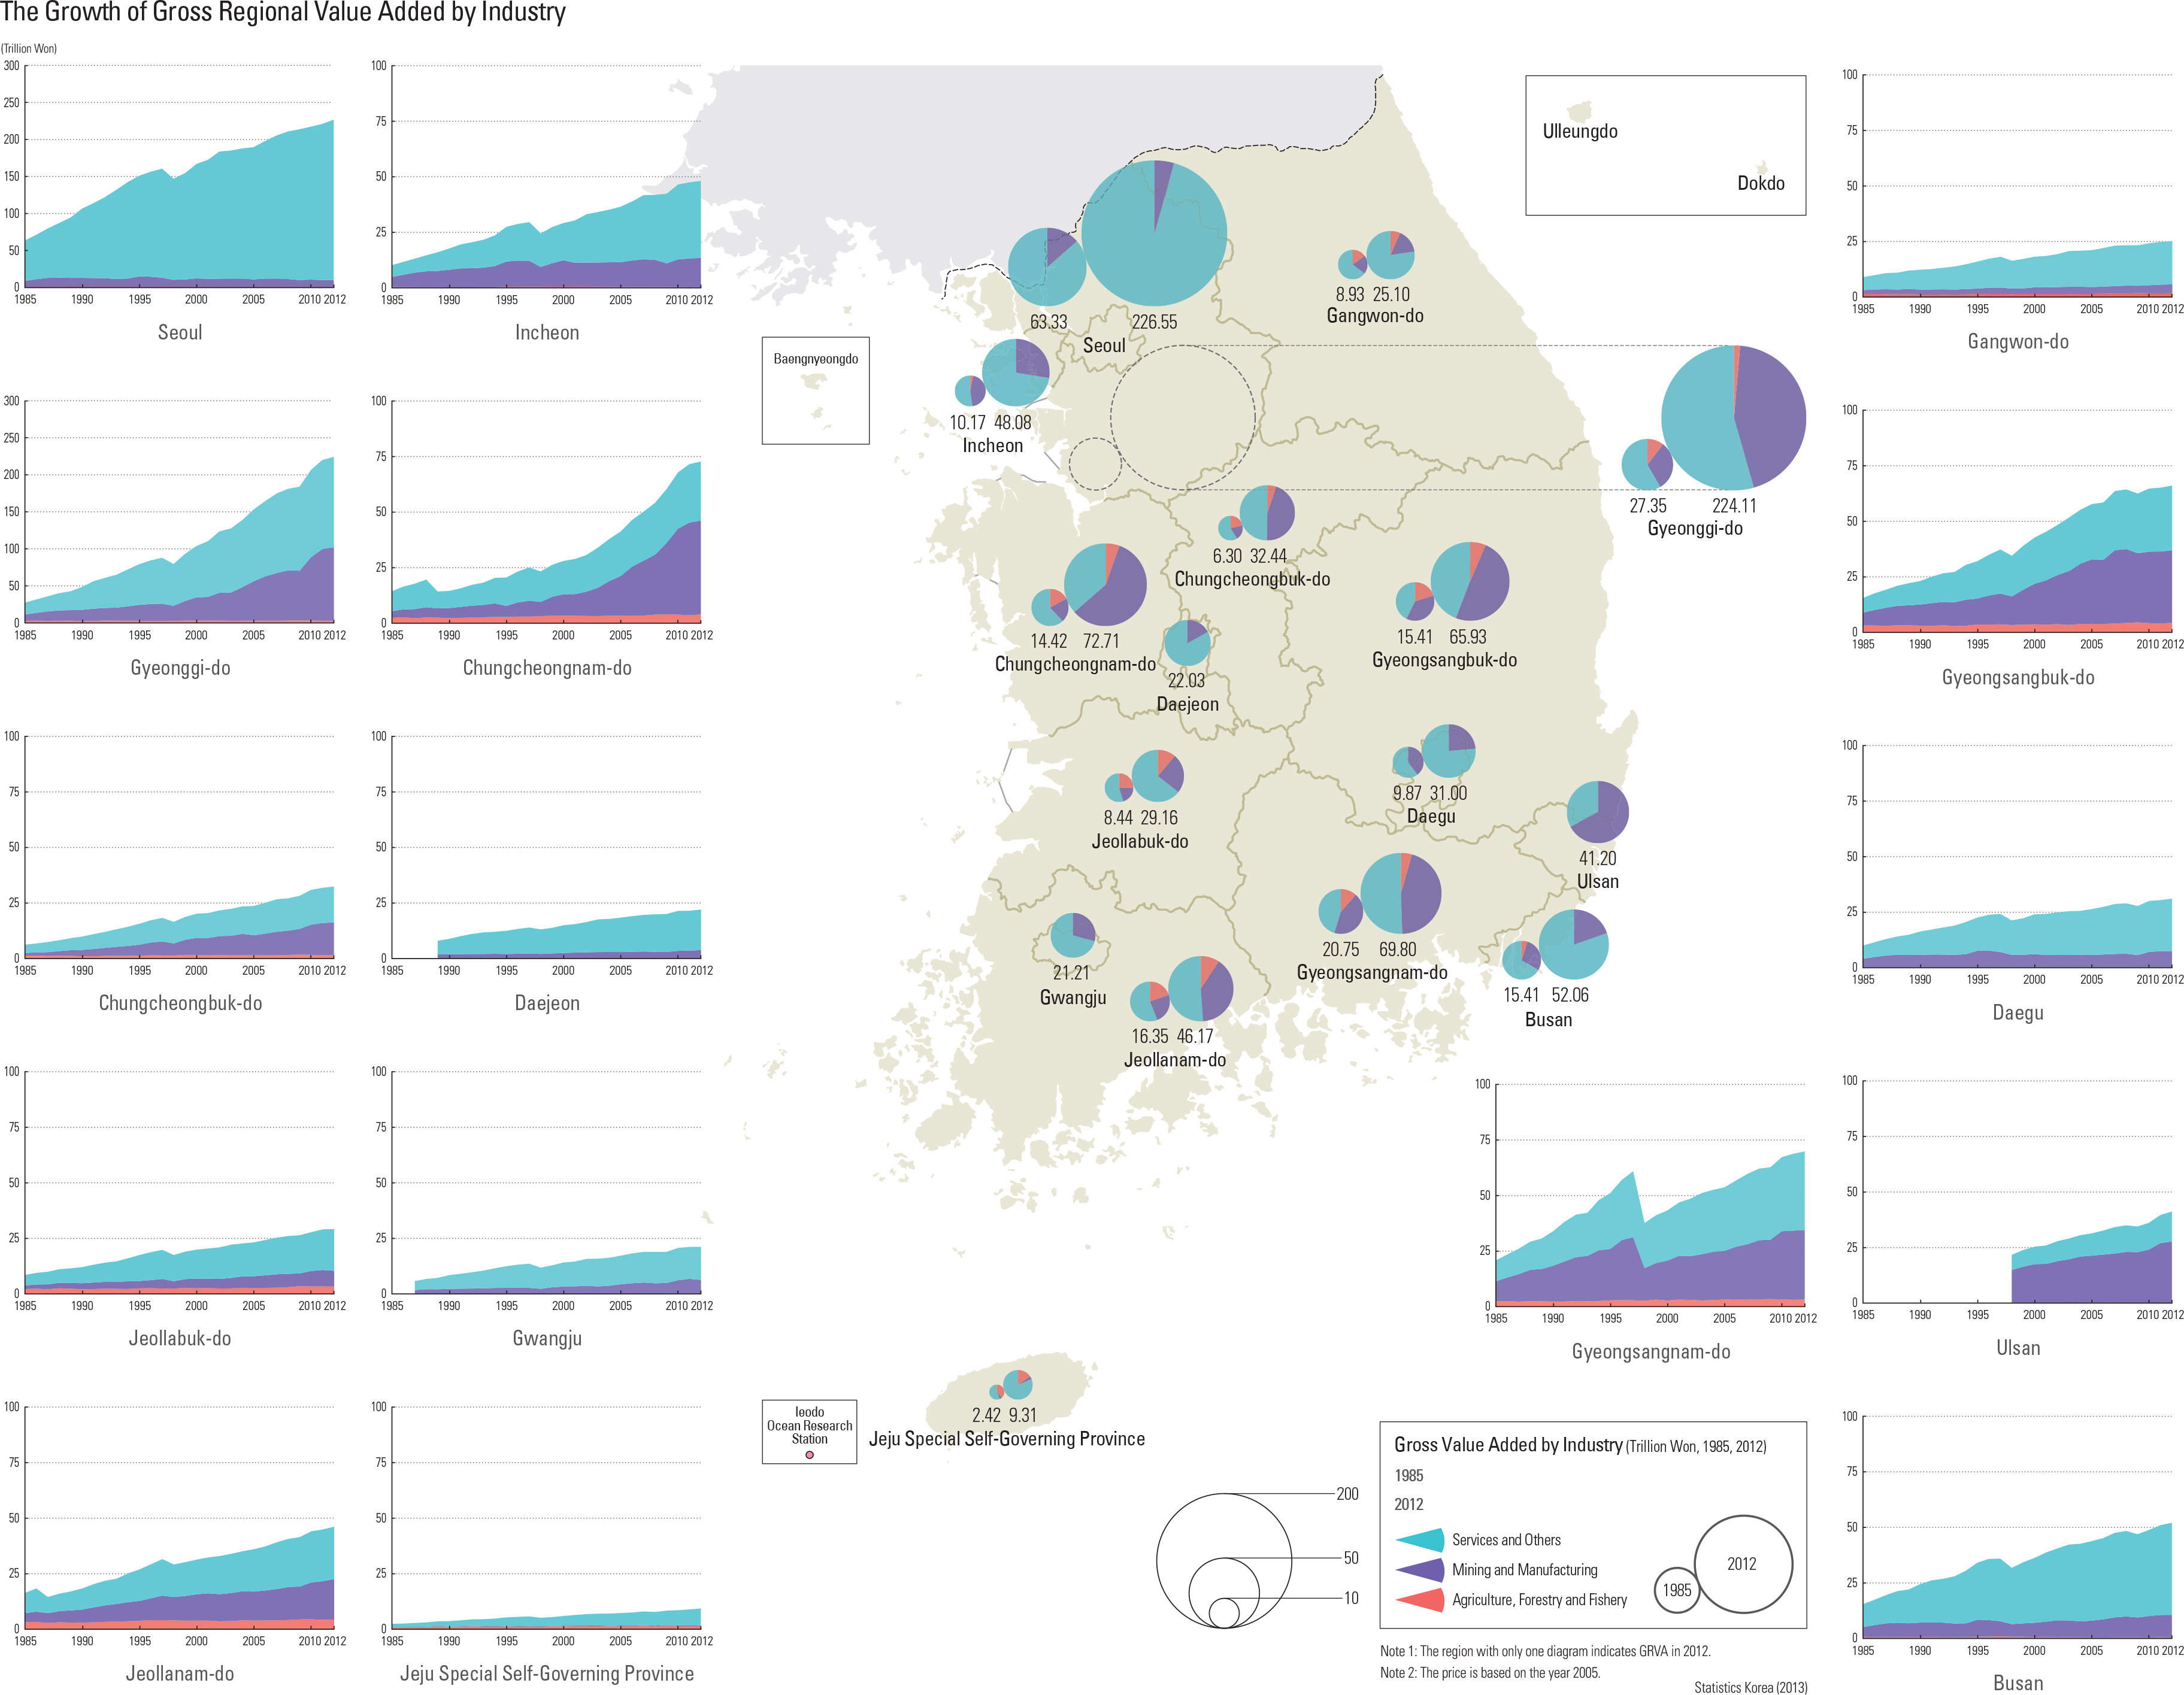
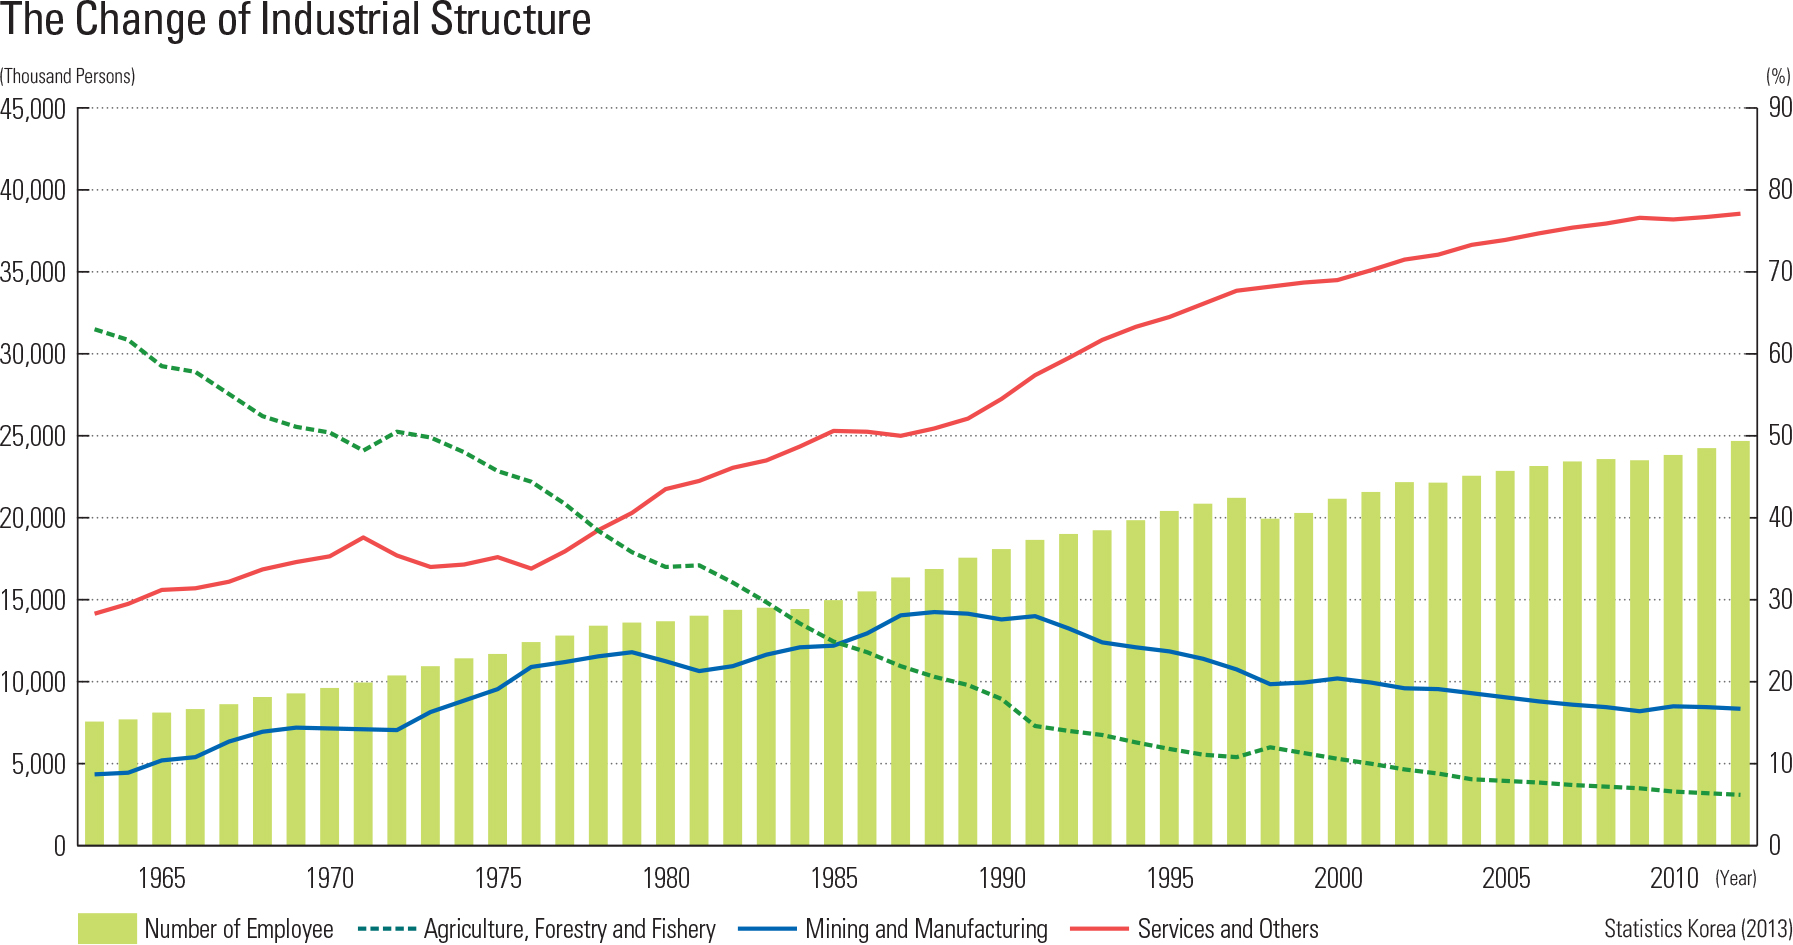
The change in industrial structure is usually assessed by reviewing changes in the share of agriculture, forestry, fishery, mining, manufacturing, service, and other industries. Many indicators can be used. However, the number of employees in each industry proves to be an excellent indicator. Since the 1960s, the agriculture, forestry, fishery, and mining industries in Korea have suffered a steady decrease in employment while manufacturing, service, and other industries increased. Similar patterns of decrease in agriculture along with a concordant increase in manufacturing have also occurred in other countries, but what is unique about Korea’s changing employment pattern is that it happened very rapidly. Even advanced countries went through such changes, but saw their transformation unfold over hundreds of years. Korea, on the other hand, underwent this dramatic shift in about 30 years. As such, Korea’s industrialization can truly be characterized as rapid and compressed economic growth. page_2 |