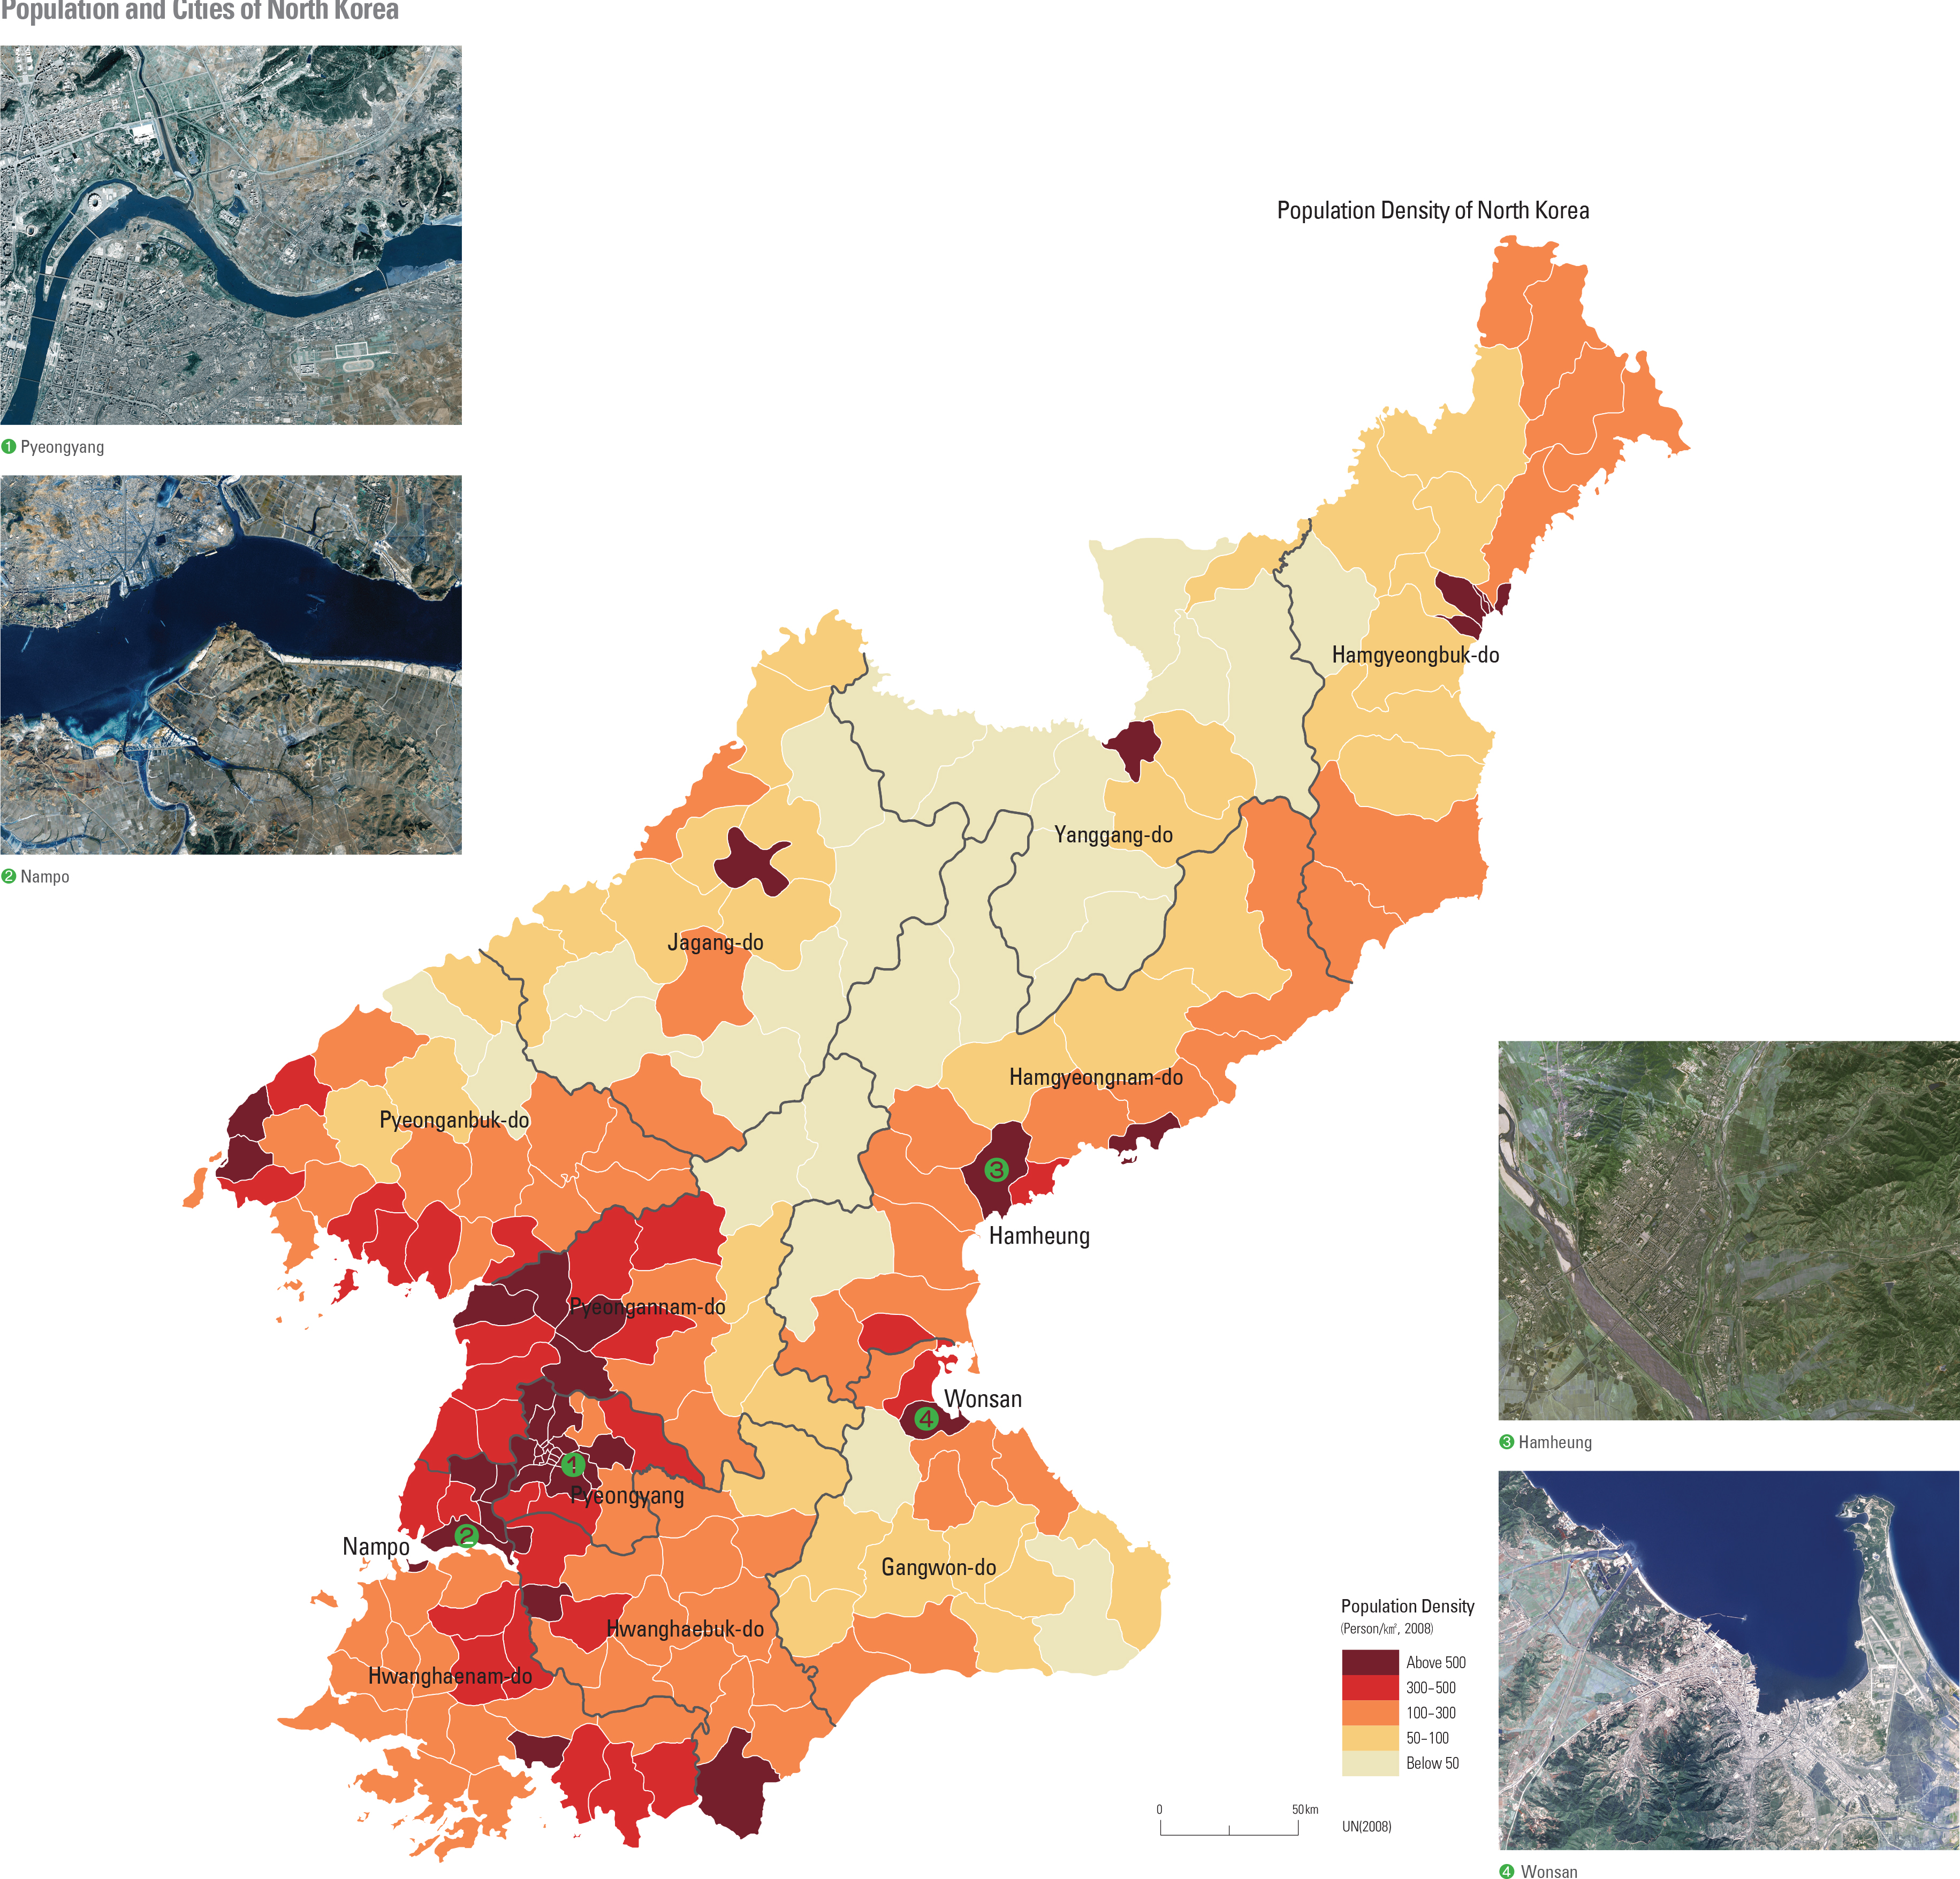
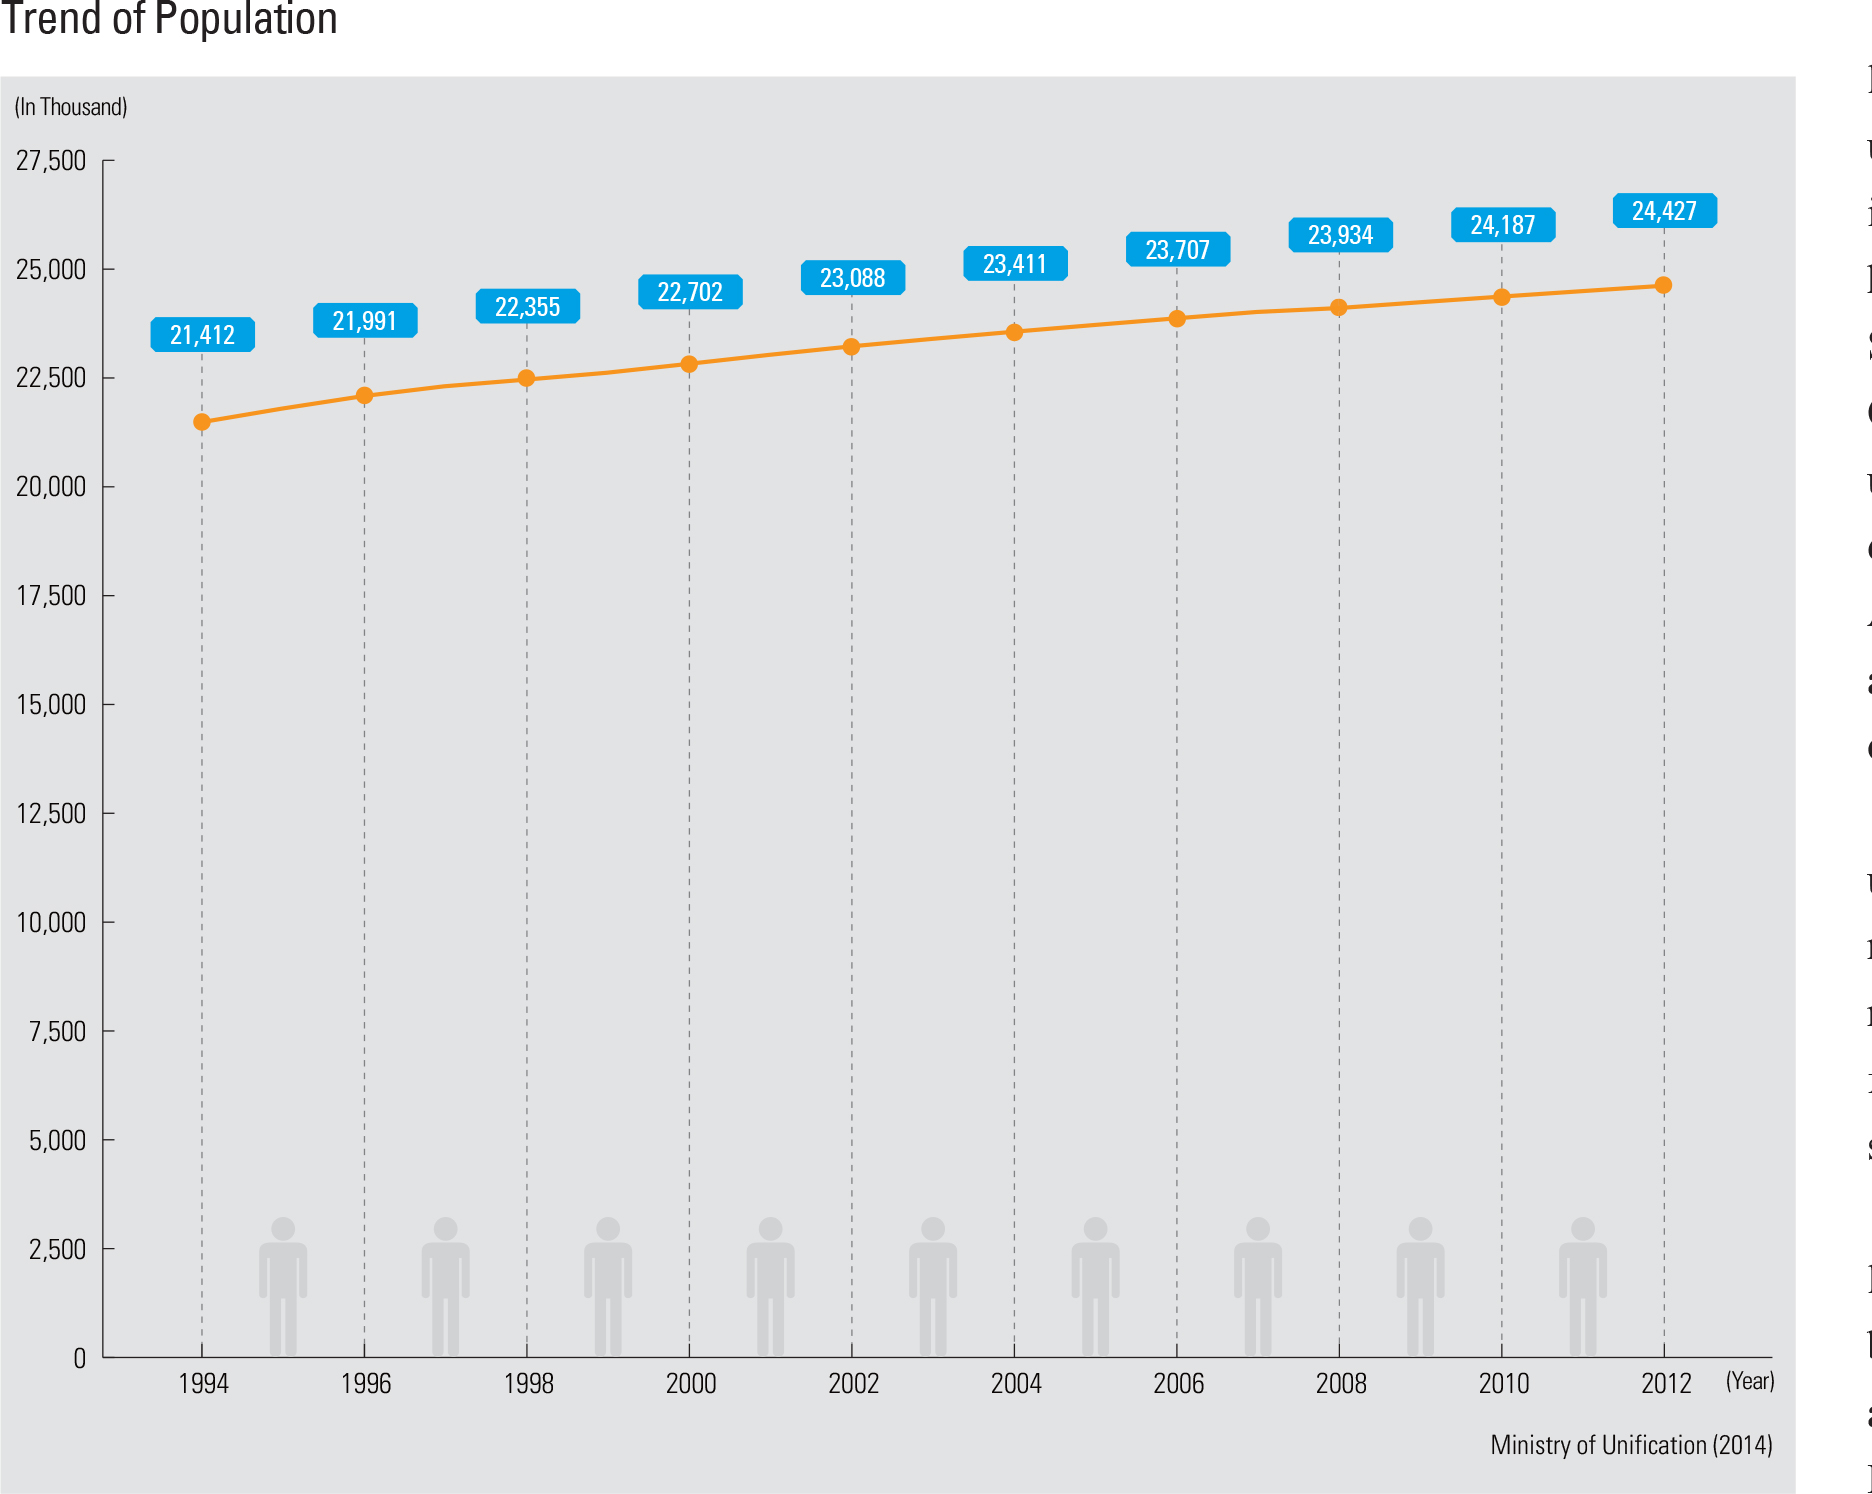
In 1946, a year after Korea’s liberation from Japan, the total population of North Korea reached 9.26 million. However, when North Korea and South Korea fought the Korean War, the North’s population dropped to its lowest level at 8.49 million. By 1958, the population had grown continuously to surpass the ten million mark for the first time in history, and it reached 20 million by the late 1980s. According to North Korea’s central statistics office, however, the country’s population recorded a net loss in 1992 for the first time. Since 1993, North Korea has shown an average annual population growth of 1% and its population finally exceeded 24 million in 2004.
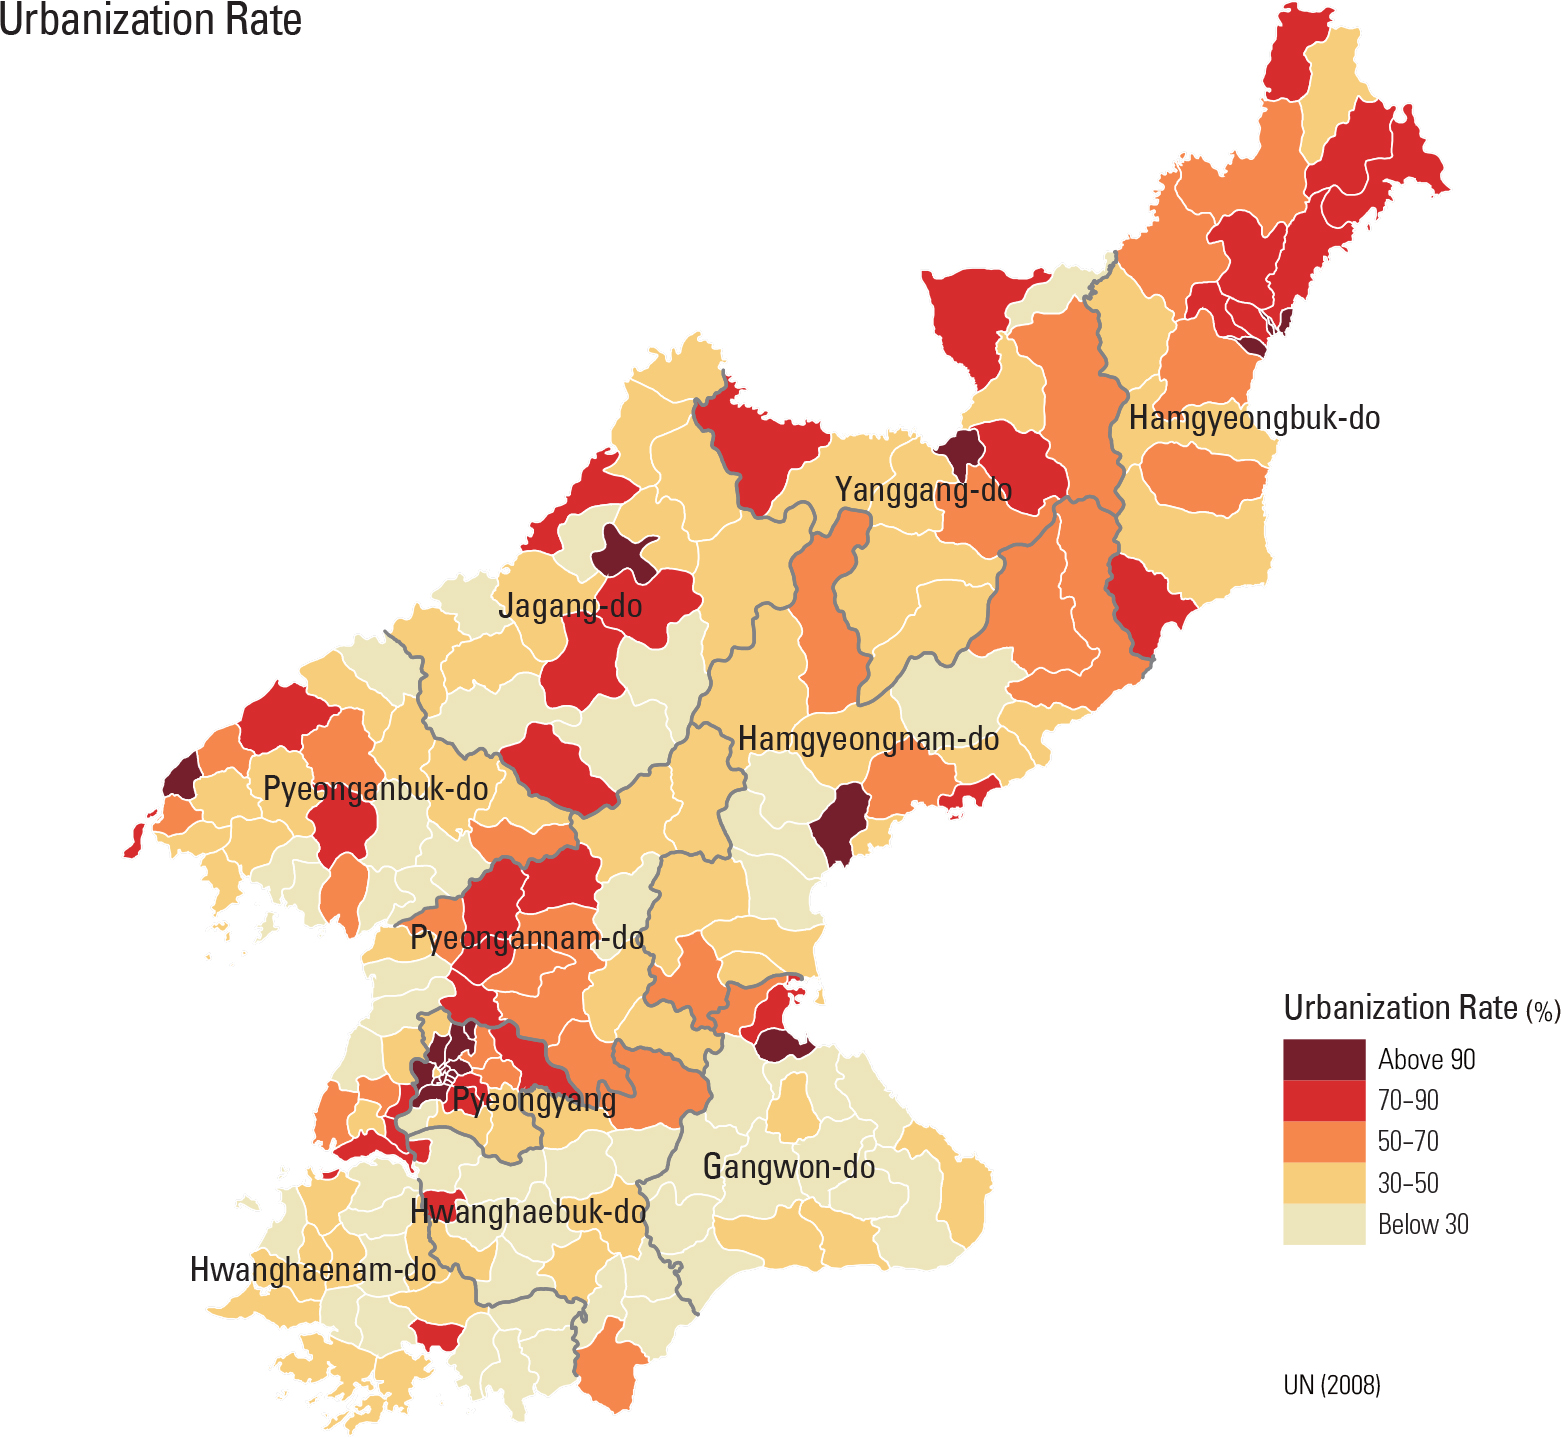
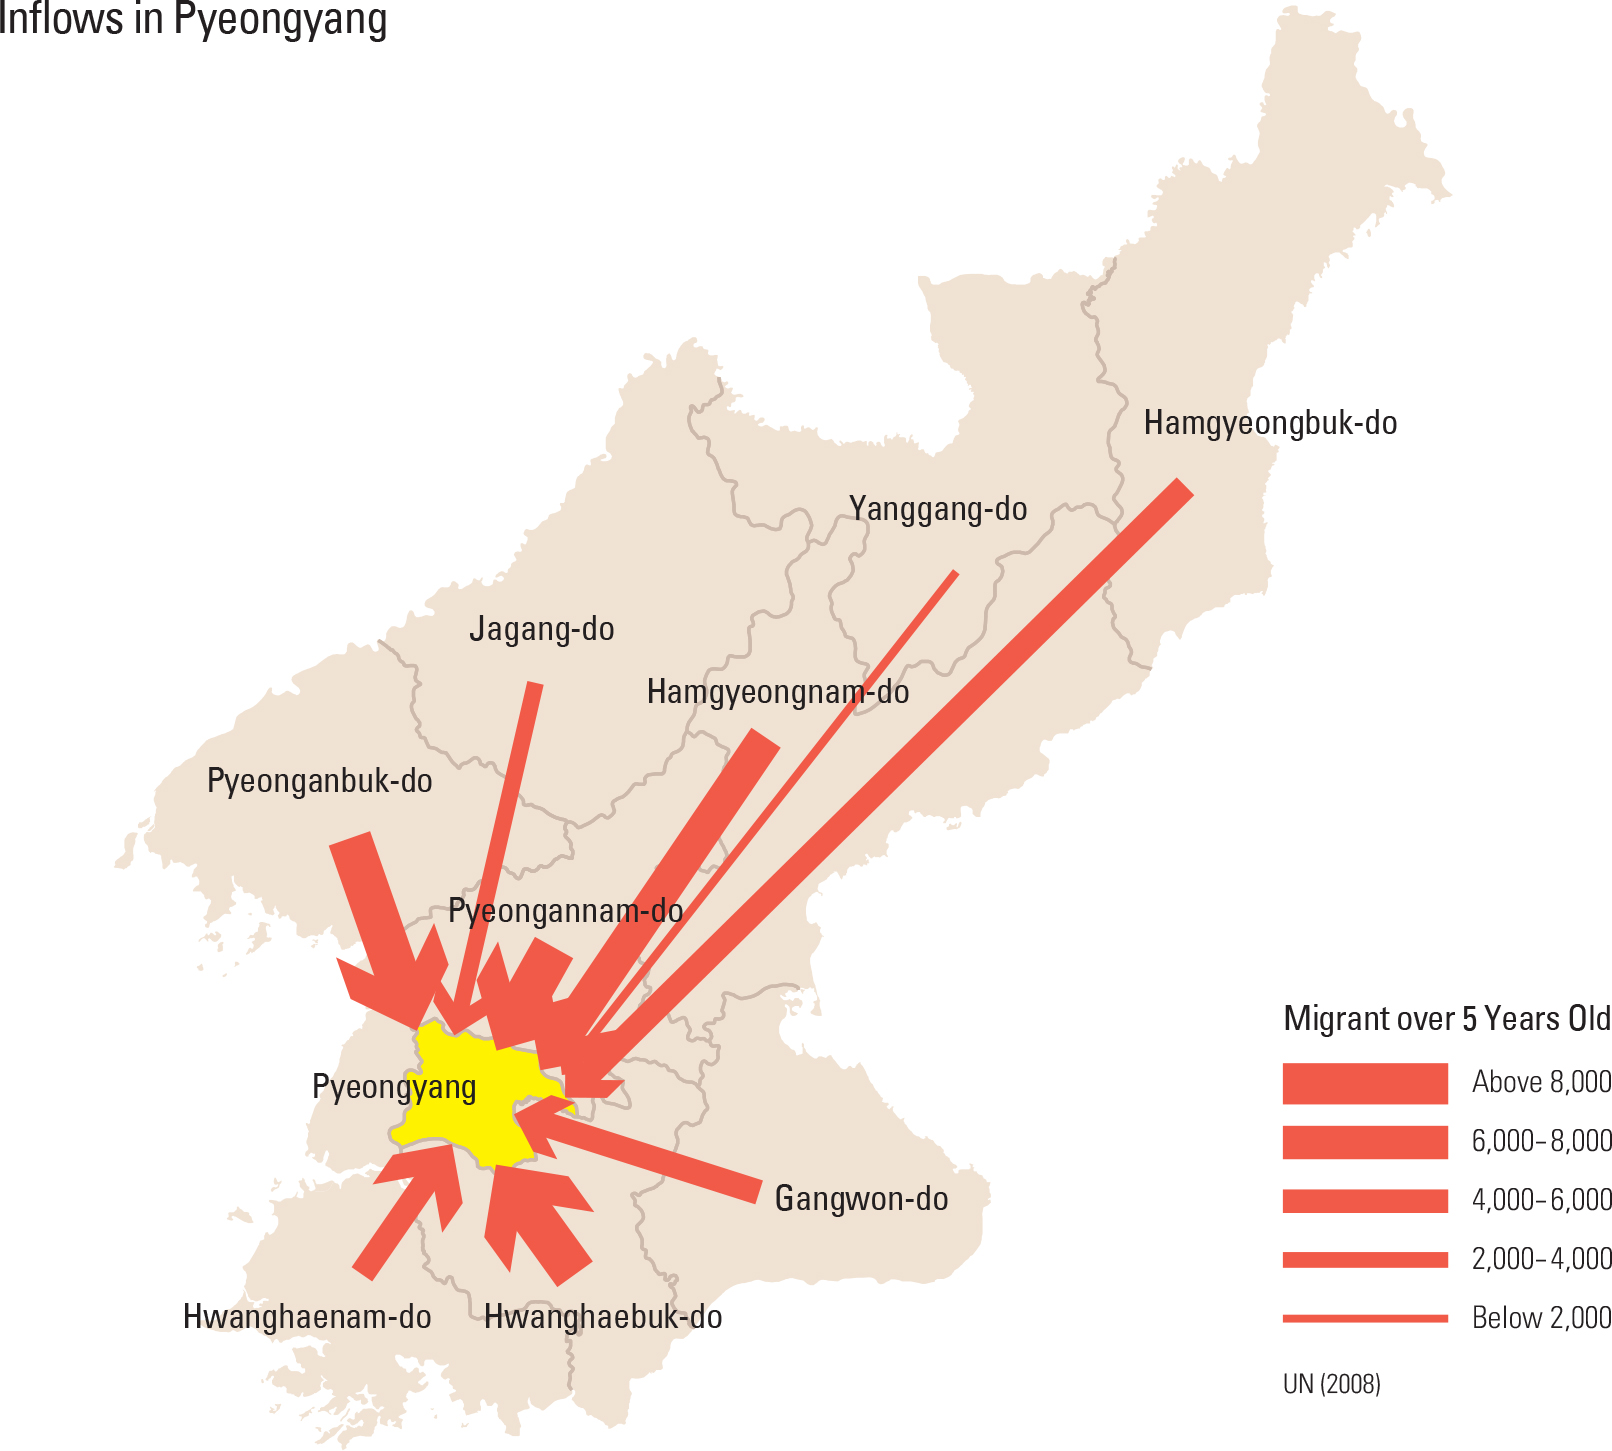
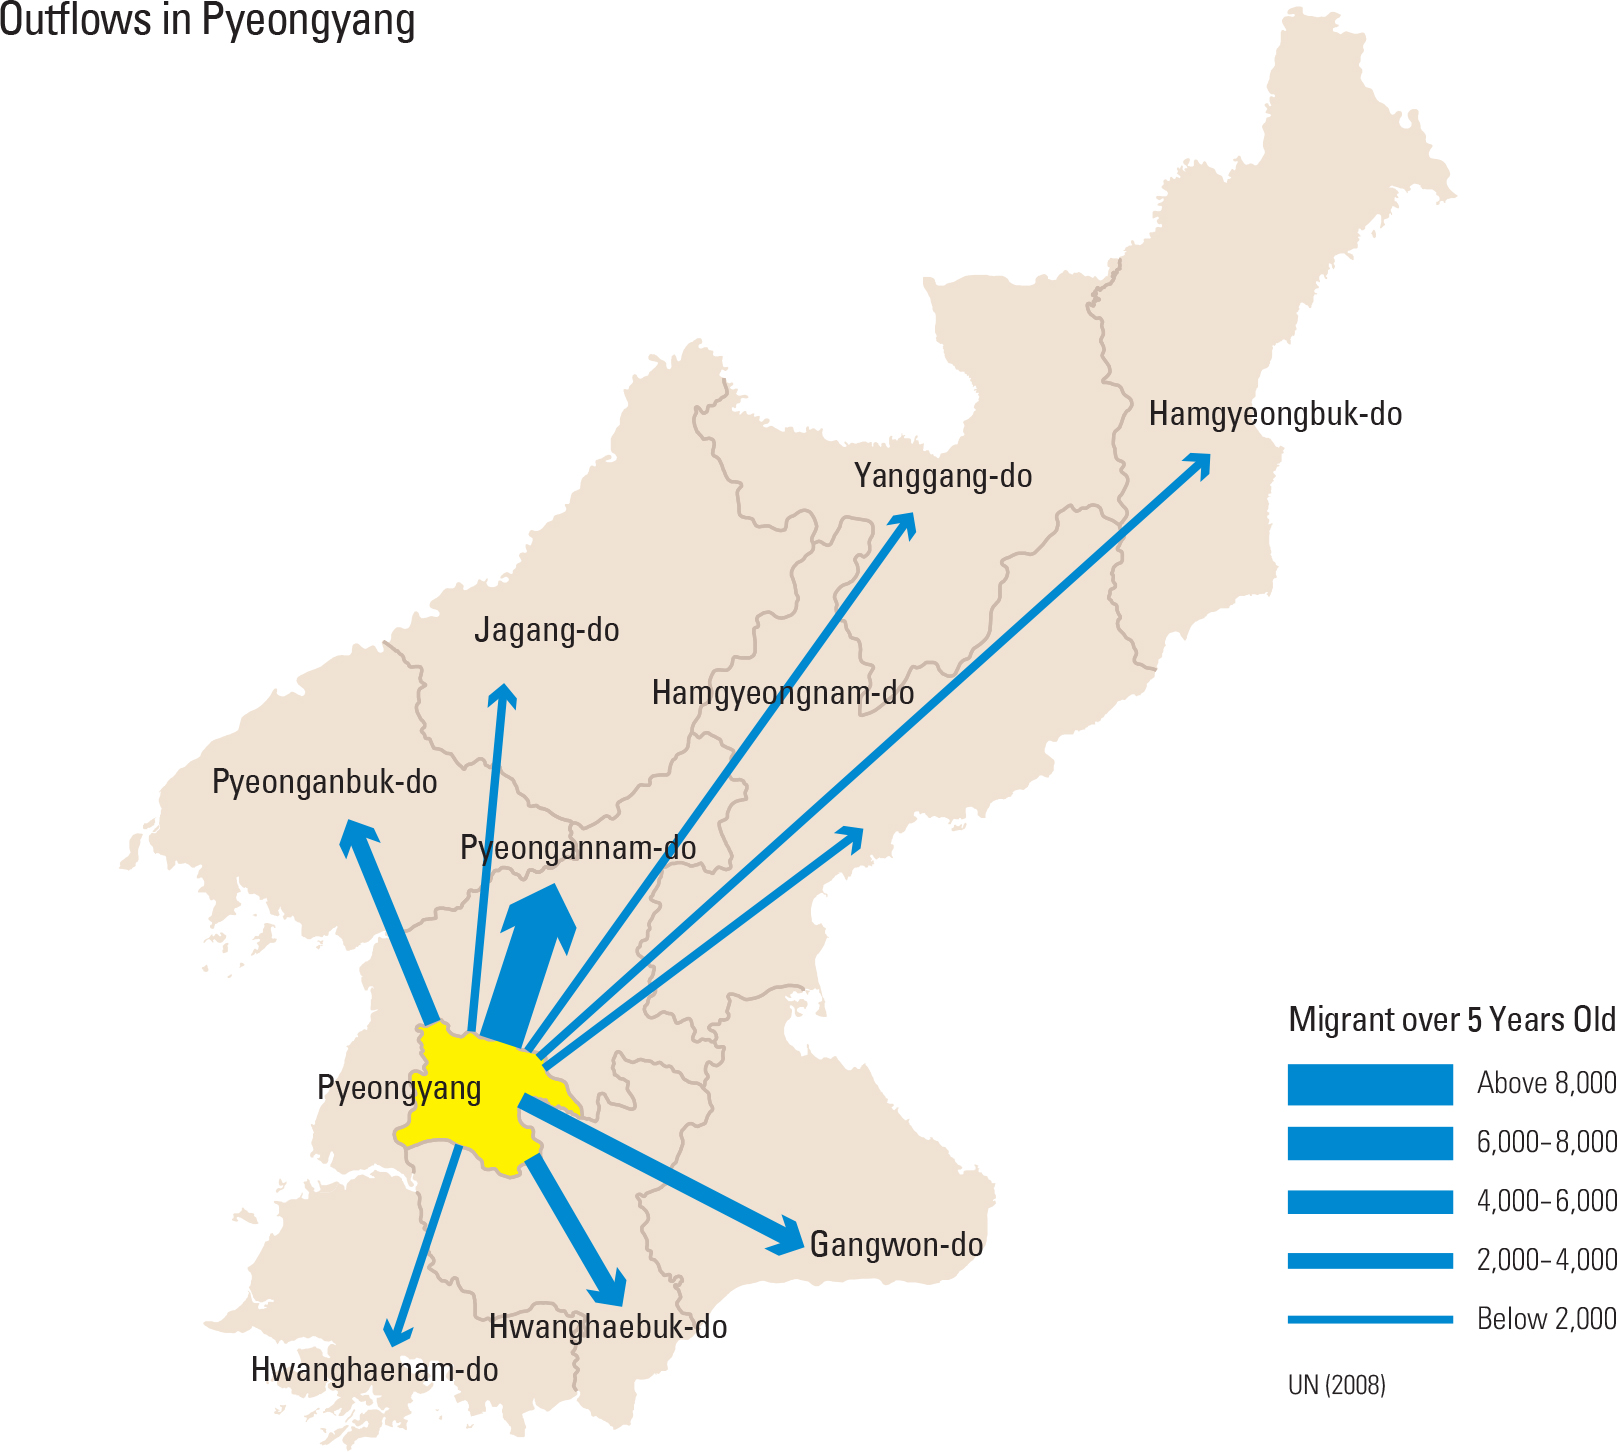
As shown on the map above, most North Koreans live in the southern and western parts of country where there are many plains and lowlands. Pyeongyang and its neighboring Pyeongannam-do show the highest population density. The population density is generally low in the mountainous northern and eastern parts (Jagang-do, Yanggang-do, Hamgyeongbukdo, Hamgyeongnam-do, and Gangwon-do), with the exception of scattered cities, such as Hyesan-si, Cheongjin (Chongjin)-si, Hamheung (Hamhung)-si, and Ganggye-si, and the eastern coastal area. According to UN population census statistics, the migrant population above the age of five in 2008 reflected less than 1% of the total population, which demonstrates that interregional migration is not common. Exceptions are Pyeongyang and Pyeongannam-do where the largest volume of migrant population ultimately lives. The Direct-administered City of Pyeongyang, in particular, boasts the highest share and number of incoming population which is 28.3% of the total. The city’s population out-migration accounts for 10.2% of the total. Besides Pyeongyang, only Pyeongannam-do and Hamgyeongbuk-do have more people moving in than those moving out whereas all of the other regions are experiencing serious population out-migration. Hamgyeongnamdo, especially, has taken the biggest hit, with twice as many people leaving as those moving into the province.
As for Pyeongyang, 30.2% of its incoming population is from Pyeongannam-do, followed by Hwanghaebuk-do (13.6%) and Pyeonganbuk-do (13%). Among those who leave Pyeongyang, 40% choose to go to Pyeongannam-do. Pyeongyang’s population out-migration to other regions is generally evenly distributed. One of the interesting features of Pyeongyang’s population movement is that a significantly small number of people move to Yanggang-do (0.01%) or Jagang-do (0.03%) compared to all of the other provinces. Similarly, those people moving from Yanggang-do and Jagang-do to Pyeongyang stand only at 0.03% and 0.04%. This trend may be a result of the fact that the two provinces have smaller populations. However, given that the similar-sized Province of Gangwon-do that accounts for as much as 8.5% of Pyeongyang’s incoming population and 14.3% of its outgoing population, the low migration trend for Yanggang-do and Jagangdo appears to be related to their socioeconomic conditions, two of the most backward provinces in the country.