English I 2019
International trade and investment is the exchange of capital, goods, and services across international borders or territories. It includes the international flow of tangible and intangible commodities such as finance, insurance, transportation, distribution, and information technologies, as well as the international flow of key production elements such as capital, labor, and technology. Furthermore, it includes a series of international agreements such as the Free Trade Agreement (FTA) for international regulations or norms that have a significant influence on labor, technology, and competition in the international economic environment. Korea’s level of involvement in international trade and investment has strengthened significantly over the last five decades.
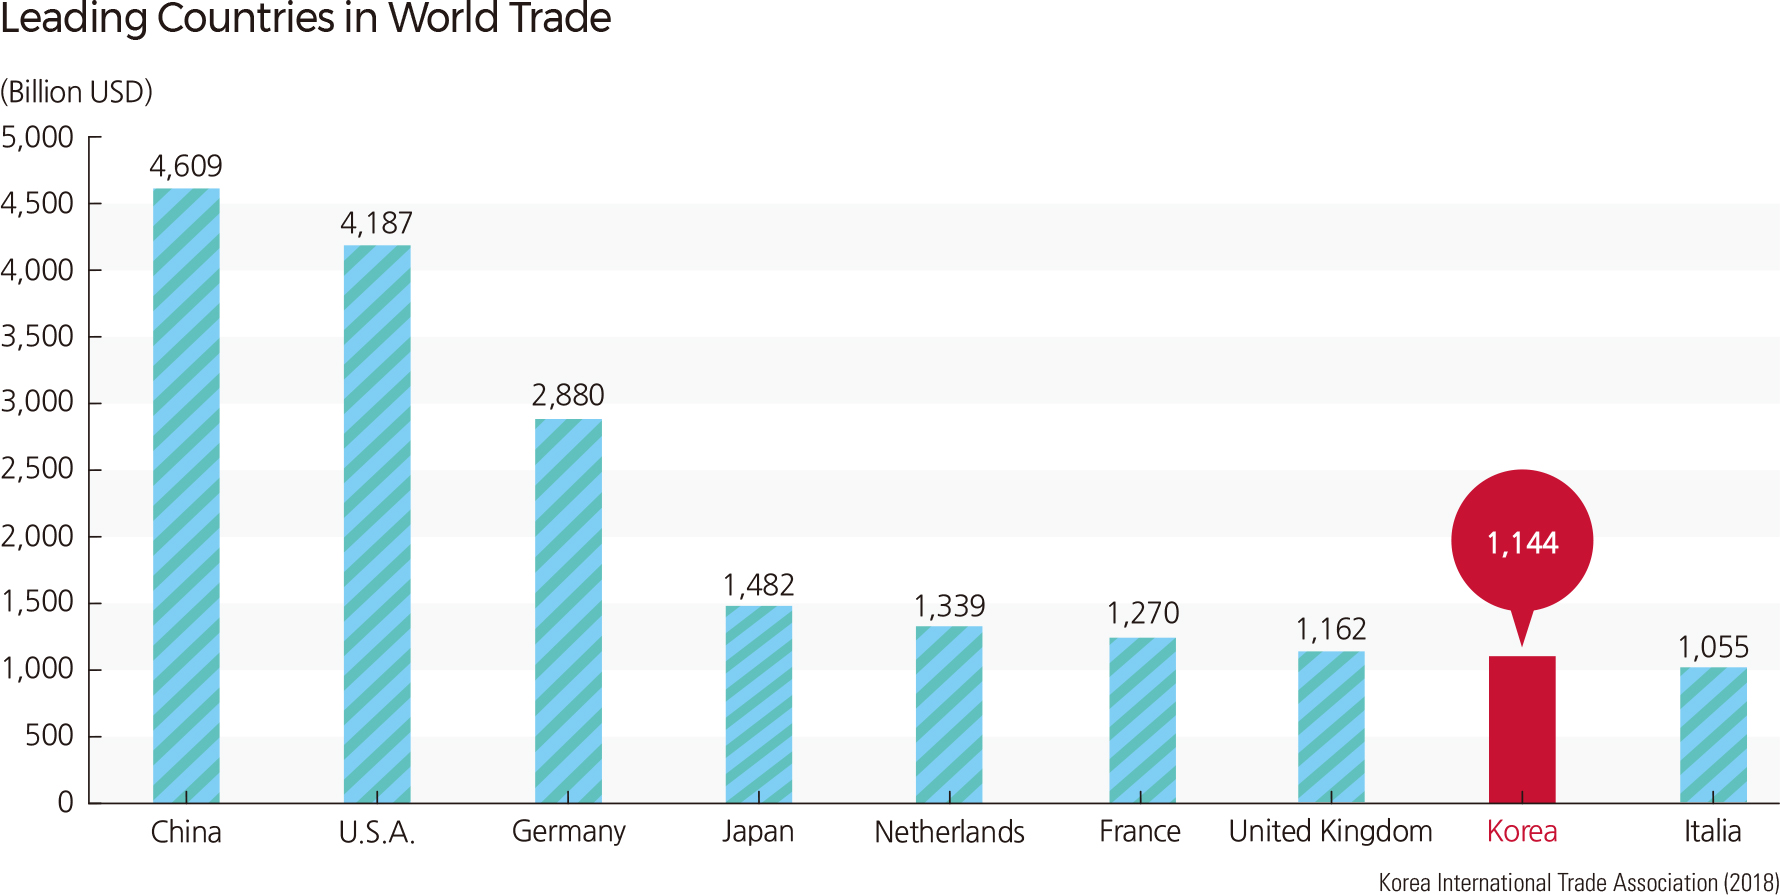
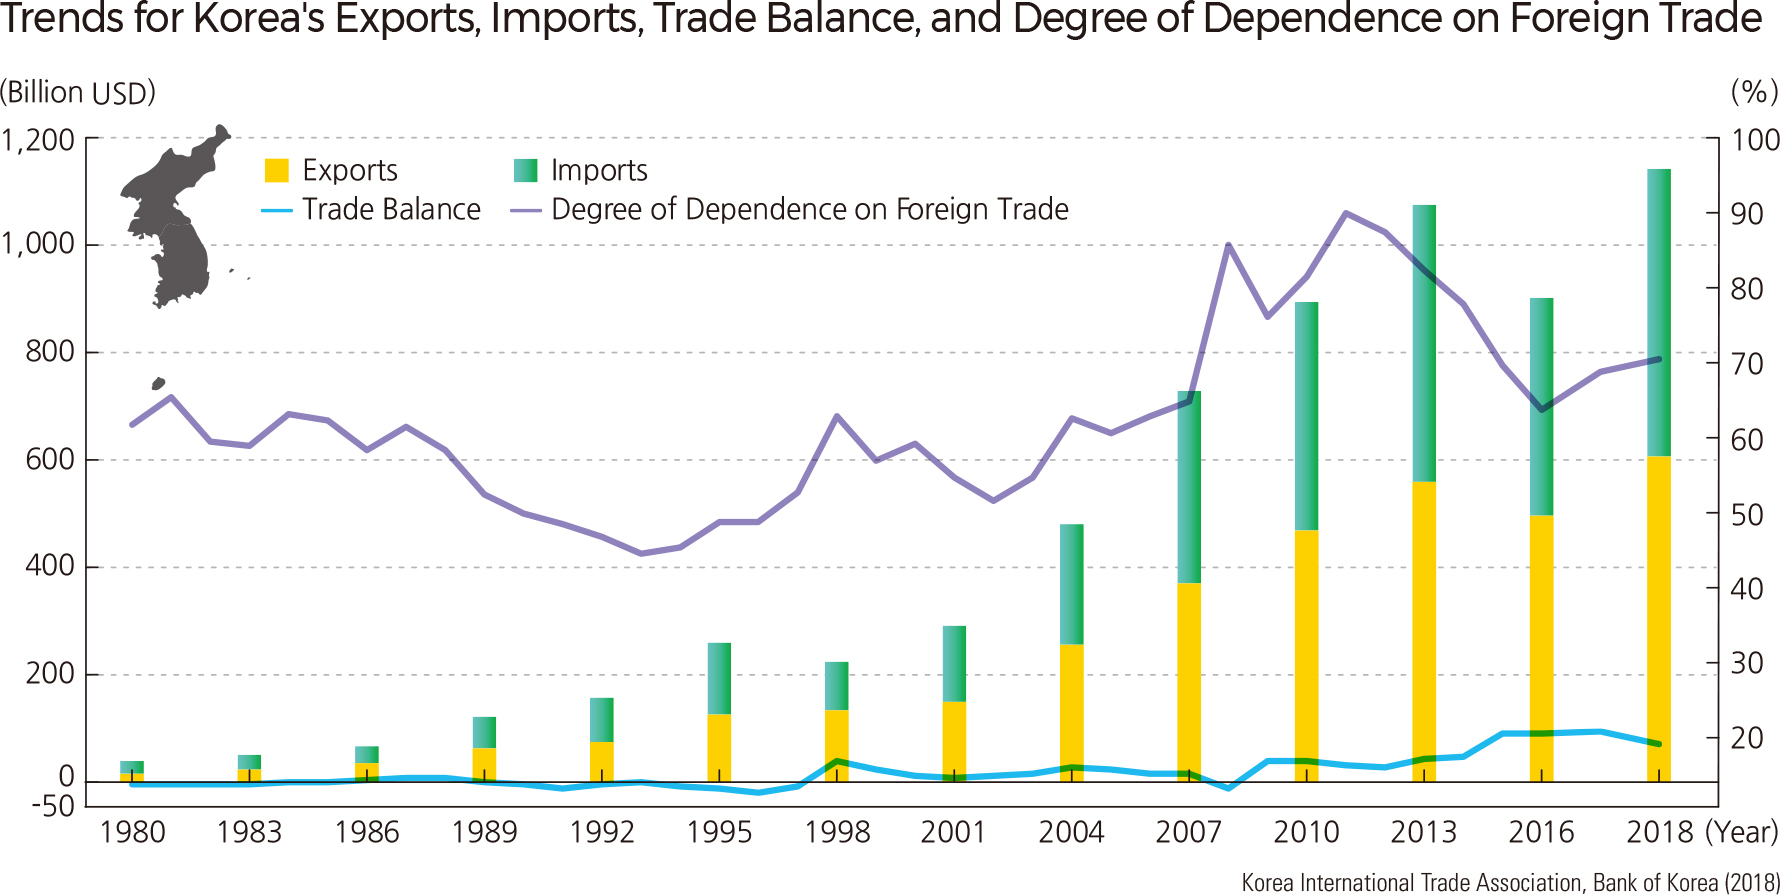
Korea’s rapid growth in trade stems directly from the government-sponsored export-oriented economic development strategies that were implemented with a series of five-year plans that began in 1962. For example, trading volumes have increased significantly from around USD 100 million in 1964 to USD 1.14 trillion (export: USD 605.5 billion, import: USD 535.0 billion in 2018. Korea is now ranked 9th in the world by trading volume. Along with the significant growth of trade, the Korean economy has become more and more dependent on international trade. A rapid increase in trade dependence dates to the early 2000s, accounting for 62.5% in 2004, 89.8% in 2011, and 70.4% in 2018.
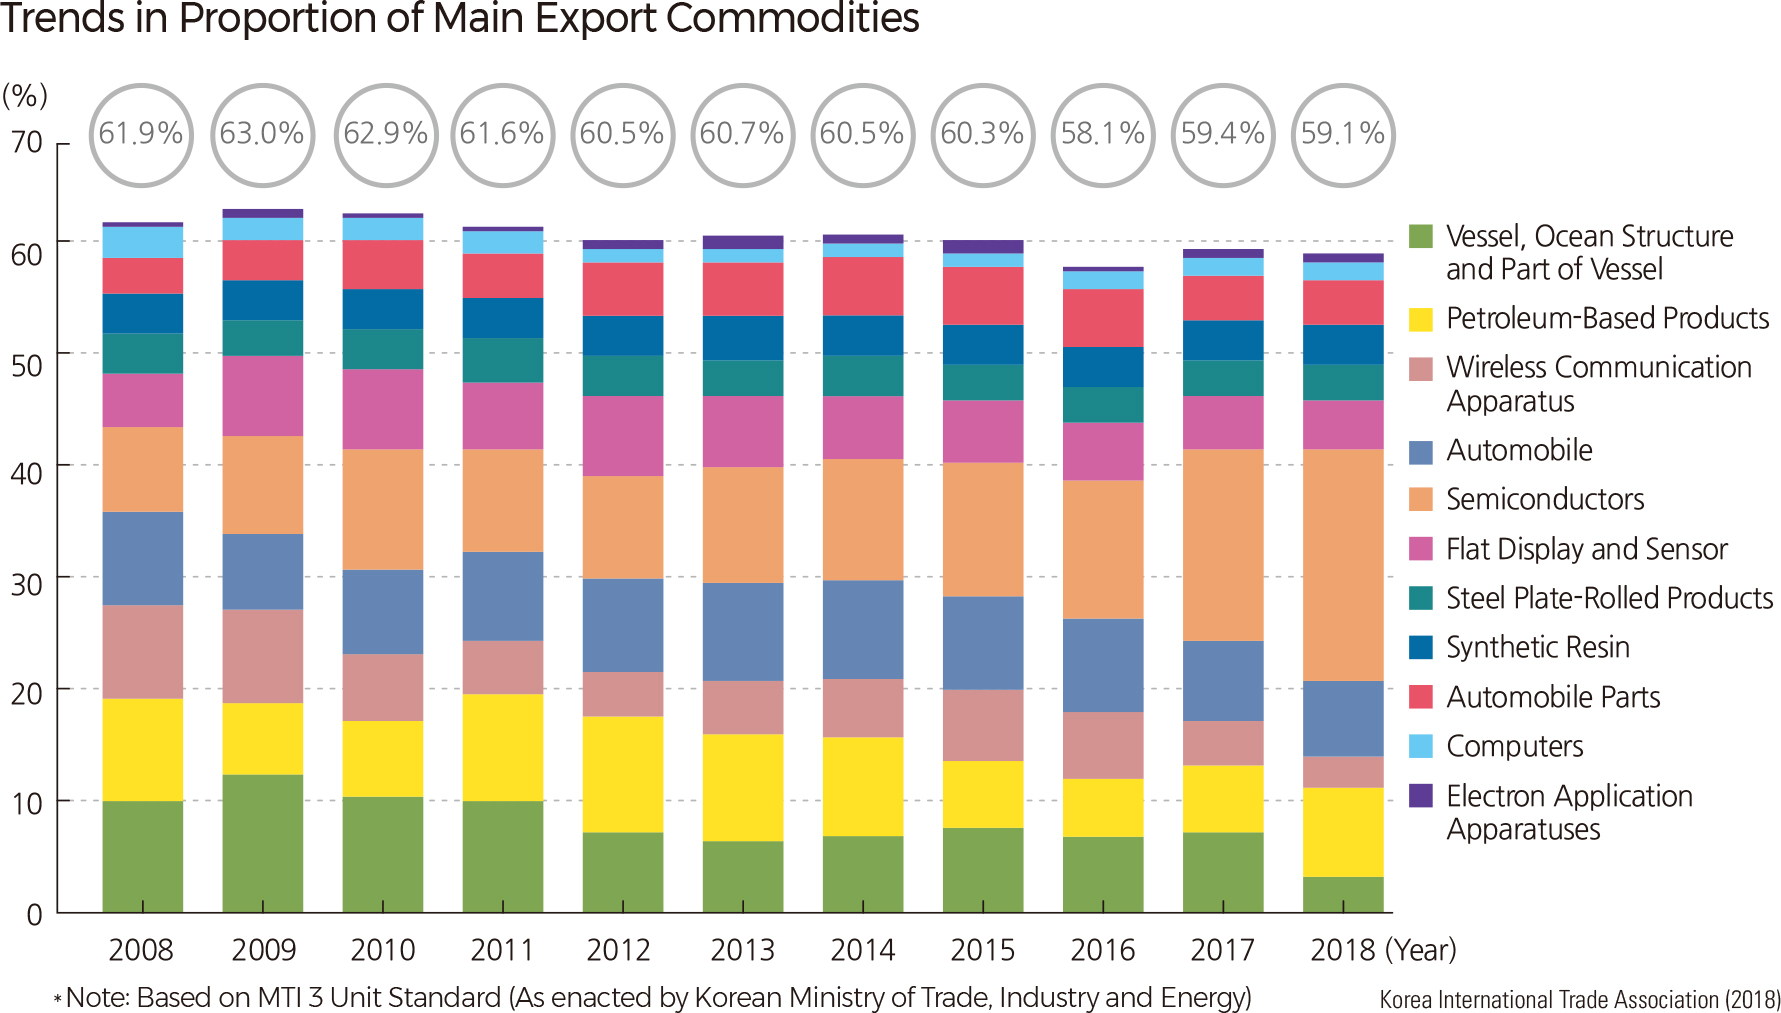
Since the early 2000s, there has also been remarkable growth in exports. For example, exports have increased from USD 150.4 billion in 2001 to USD 605.5 billion in 2018, making the trade balance grow from USD 9.3 billion in 2001 to USD 70.5 billion in 2018. The main commodities exported by Korea between 2008 and 2018 were semiconductors, automobiles, oil products, flat-screen displays, and sensors. The export of semiconductors has also increased significantly since 2008. By 2018 semiconductors had become the largest export commodity despite a dip in market prices in 2011. In 2018, the percentage of semiconductors accounted for 20.9% of all exports. Automobile exports have also increased significantly since 2010; the recent FTA with the United States and growing demand from other advanced economies boosted Korean exports. Also, the ratio of oil products has increased from 5.3% in 2016 to 7.7% in 2018 due to the increase in oil products’ export prices.
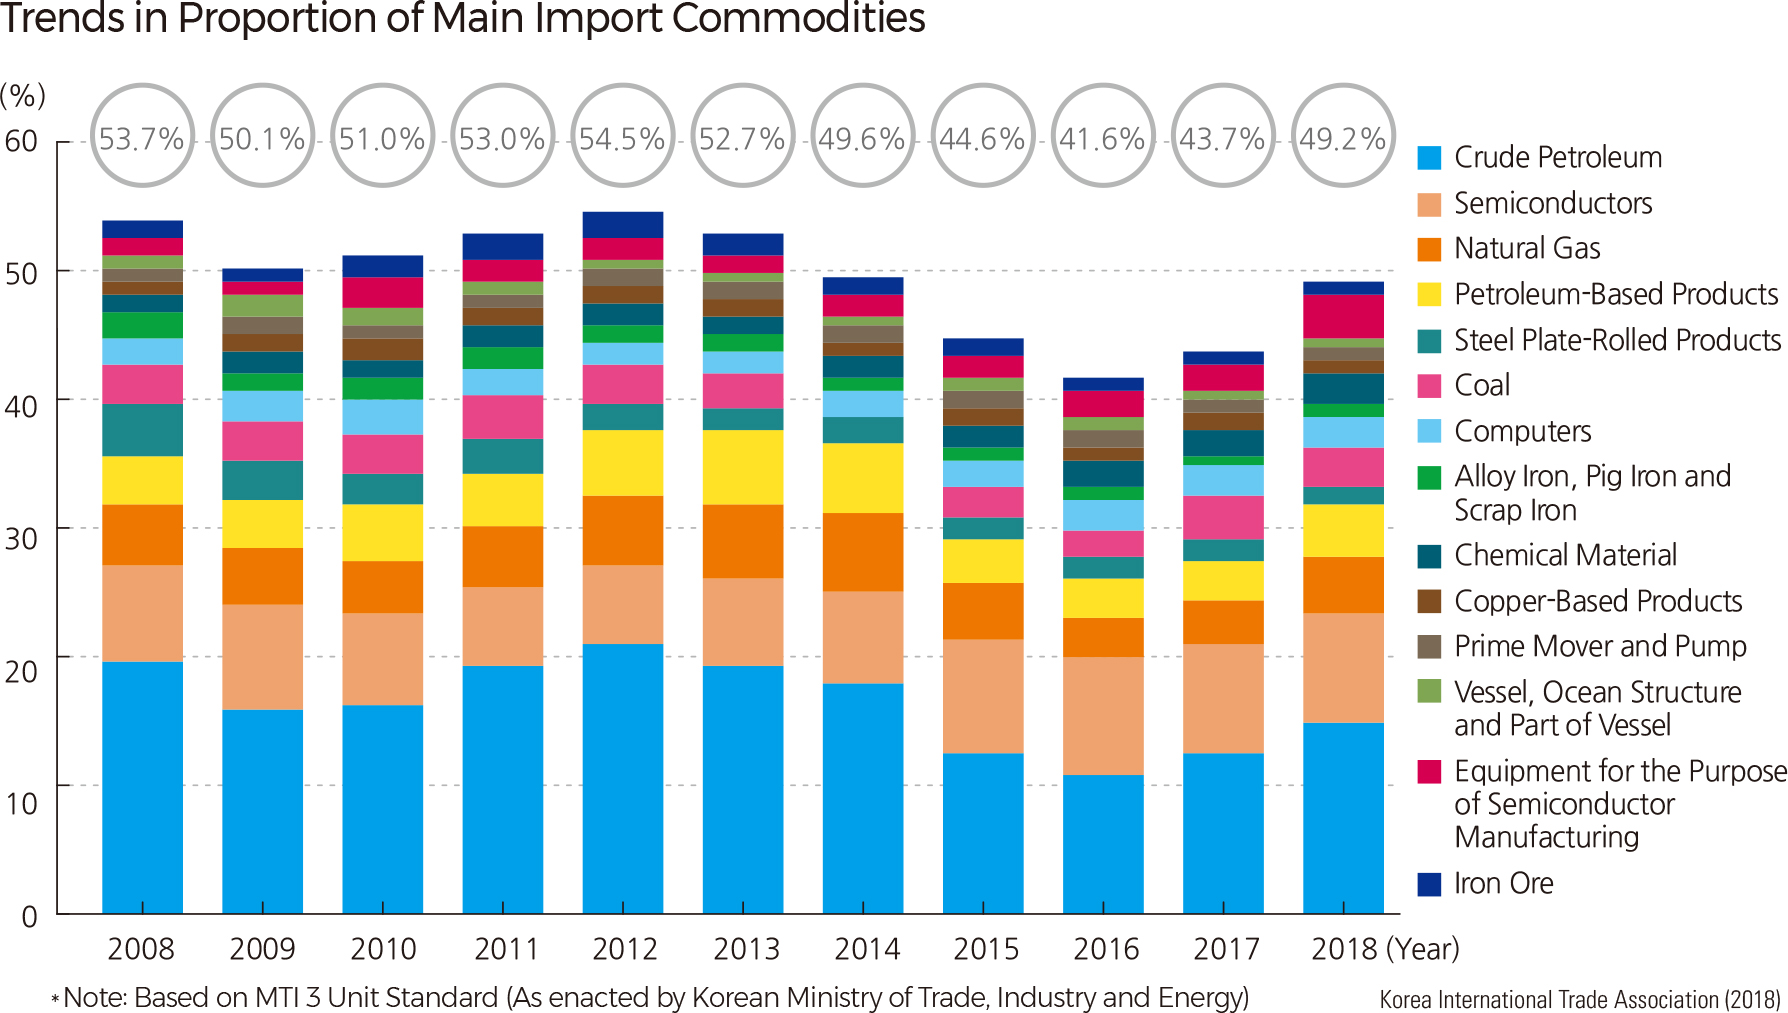
Korea has also experienced significant growth in trade despite a moderate downturn during the world economic crisis in 2008 and declining oil prices in 2009. Rebounding oil prices and the importation of equipment have stimulated rising imports once again. Crude petroleum has been the most significant imported good, accounting for over 30% of total imports. Korean crude petroleum imports in 2011 surpassed USD 100 billion for the first time. Since the early 2000s, fluctuating oil prices have led energy imports into Korea to have corresponding fluctuations. Decreases in oil prices in 2015 resulted in rapid declines in energy imports from 34.4% in 2012 to 22.7% in 2015. However, as oil prices increased once again in 2017, the proportion of energy imports increased again to 26.4% in 2018. Korean crude petroleum imports increased significantly from 10.9% in 2016 to 15.0% in 2018.
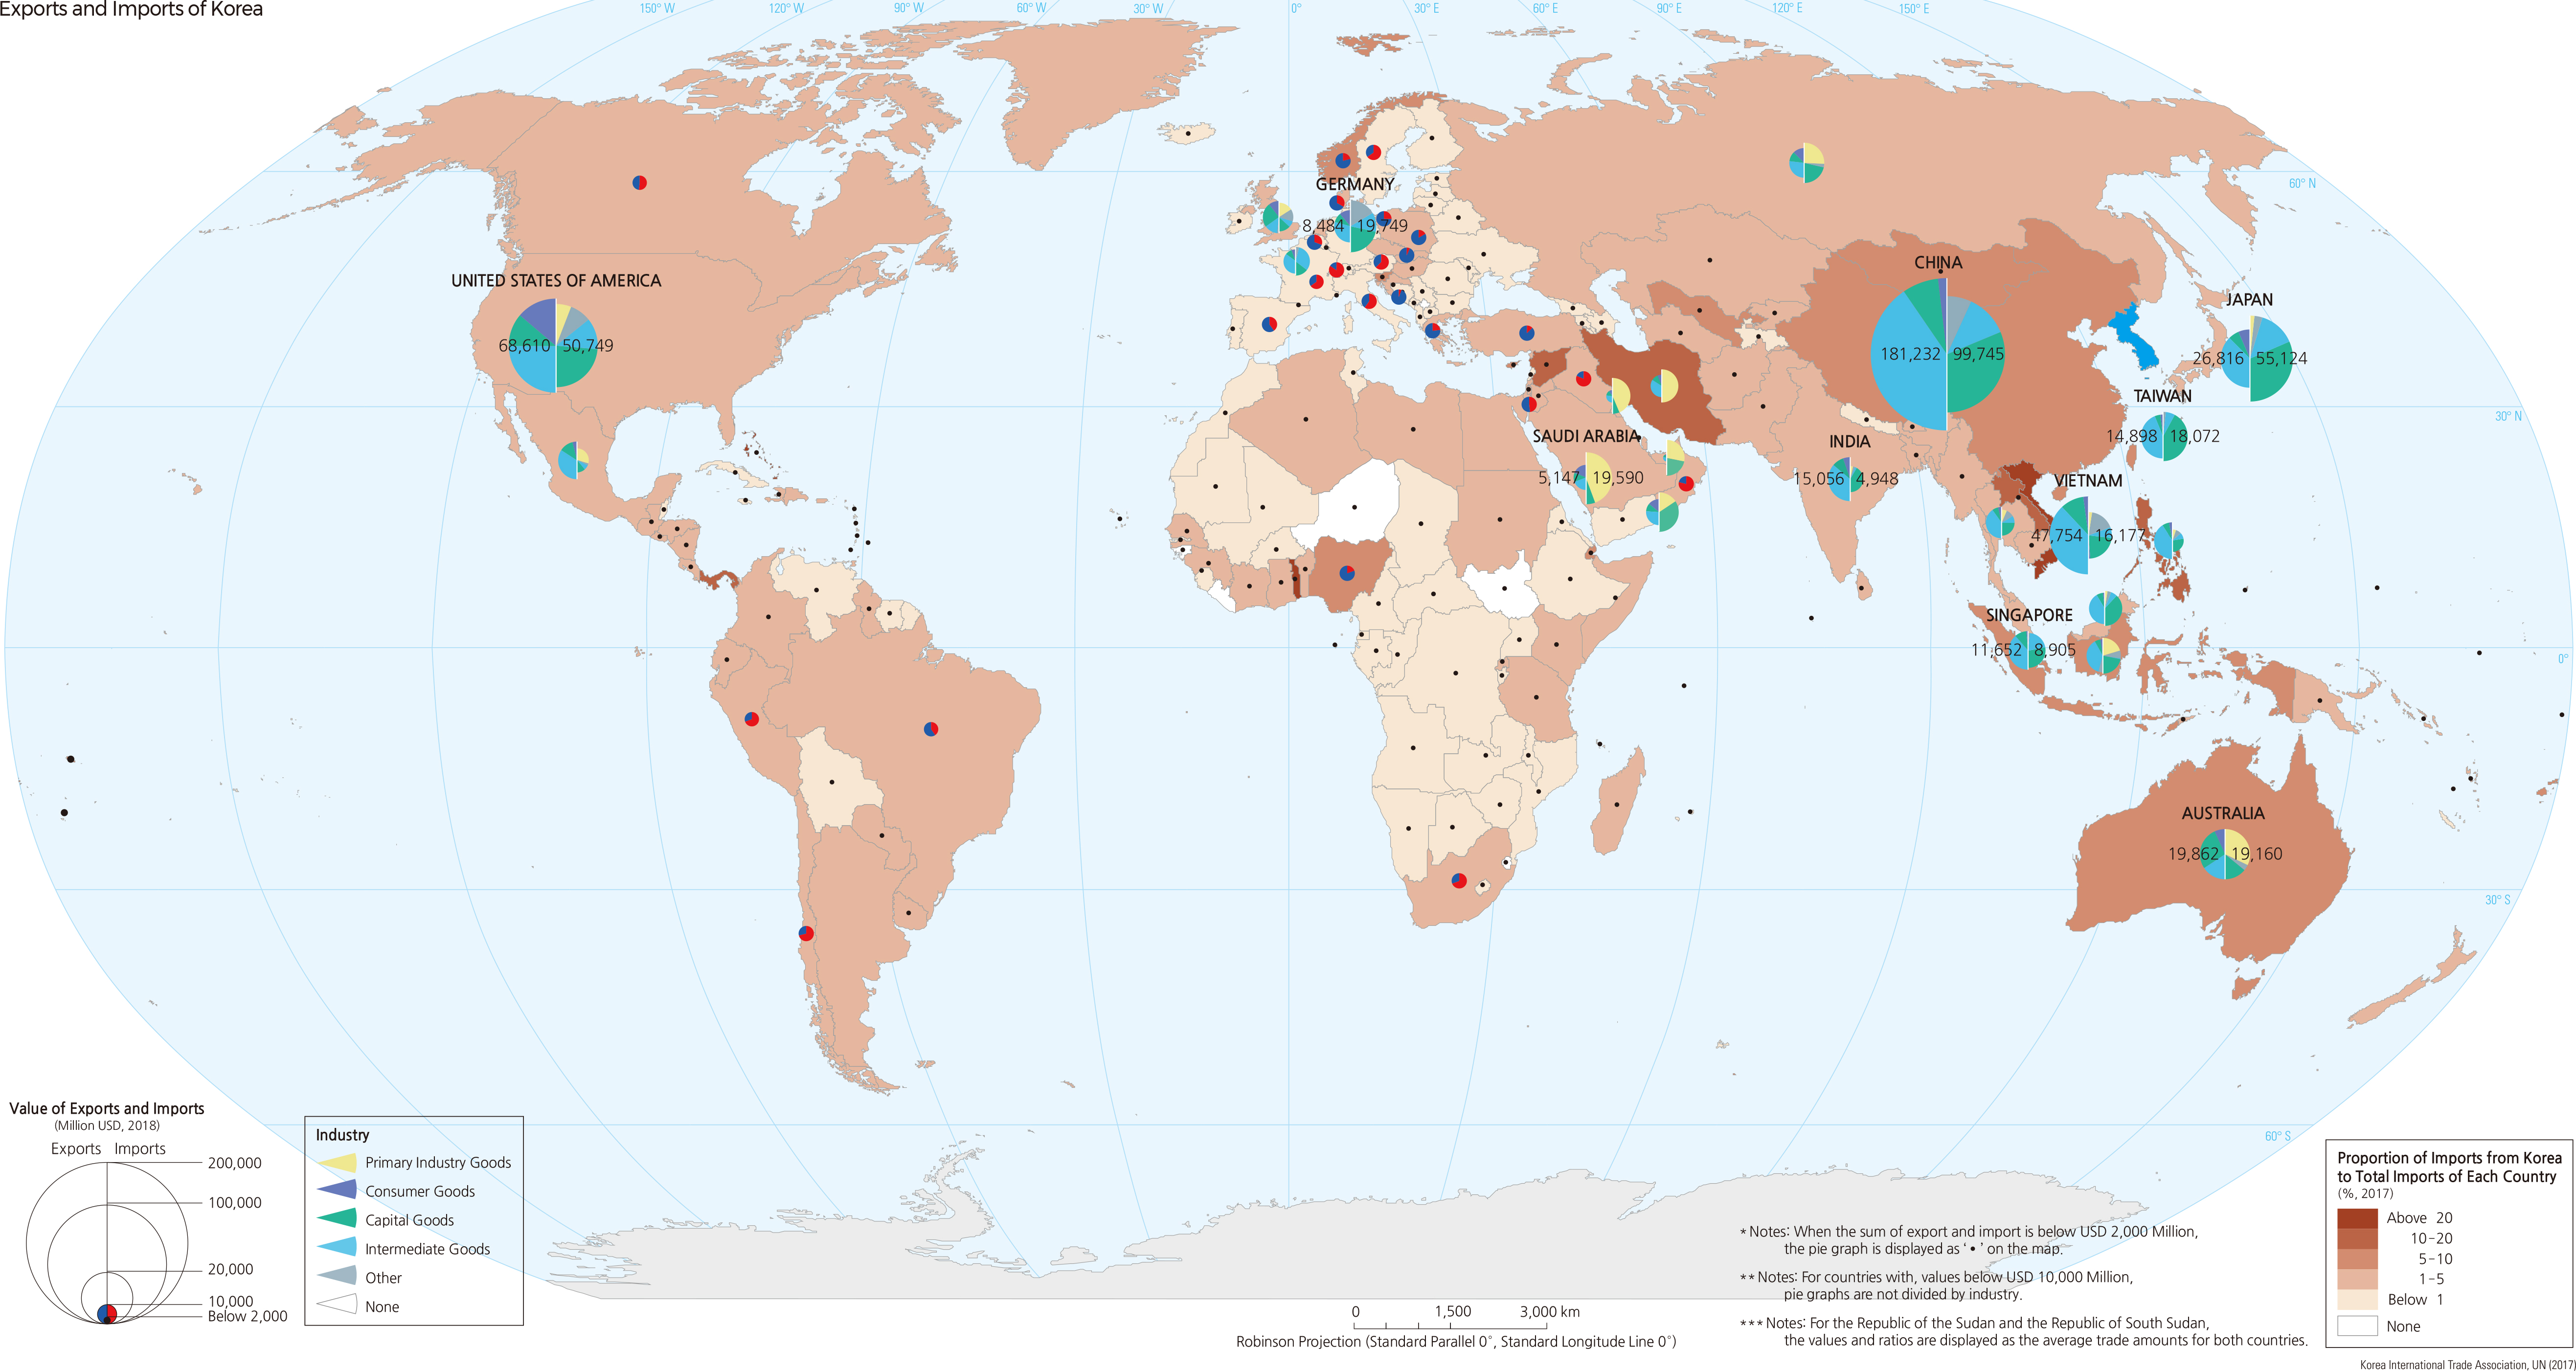
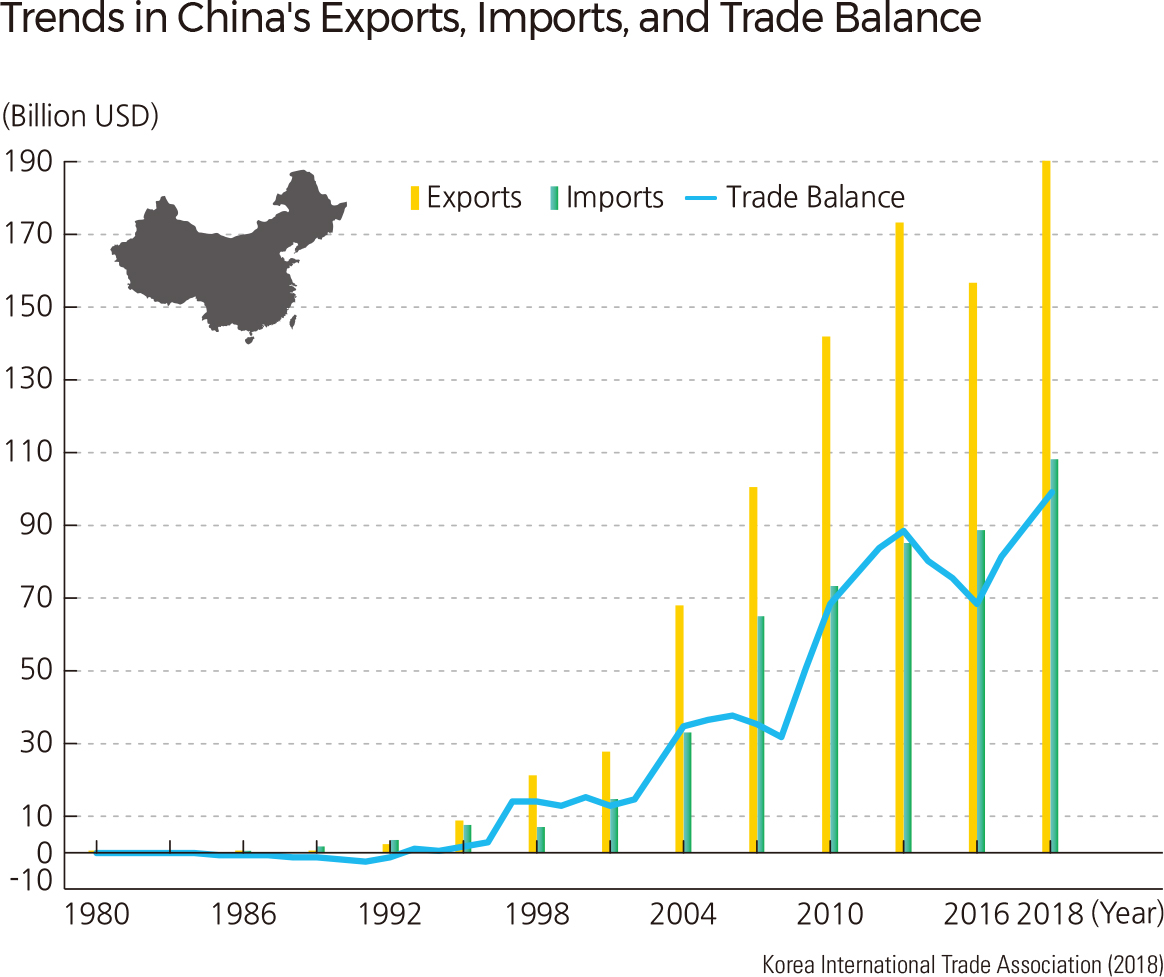
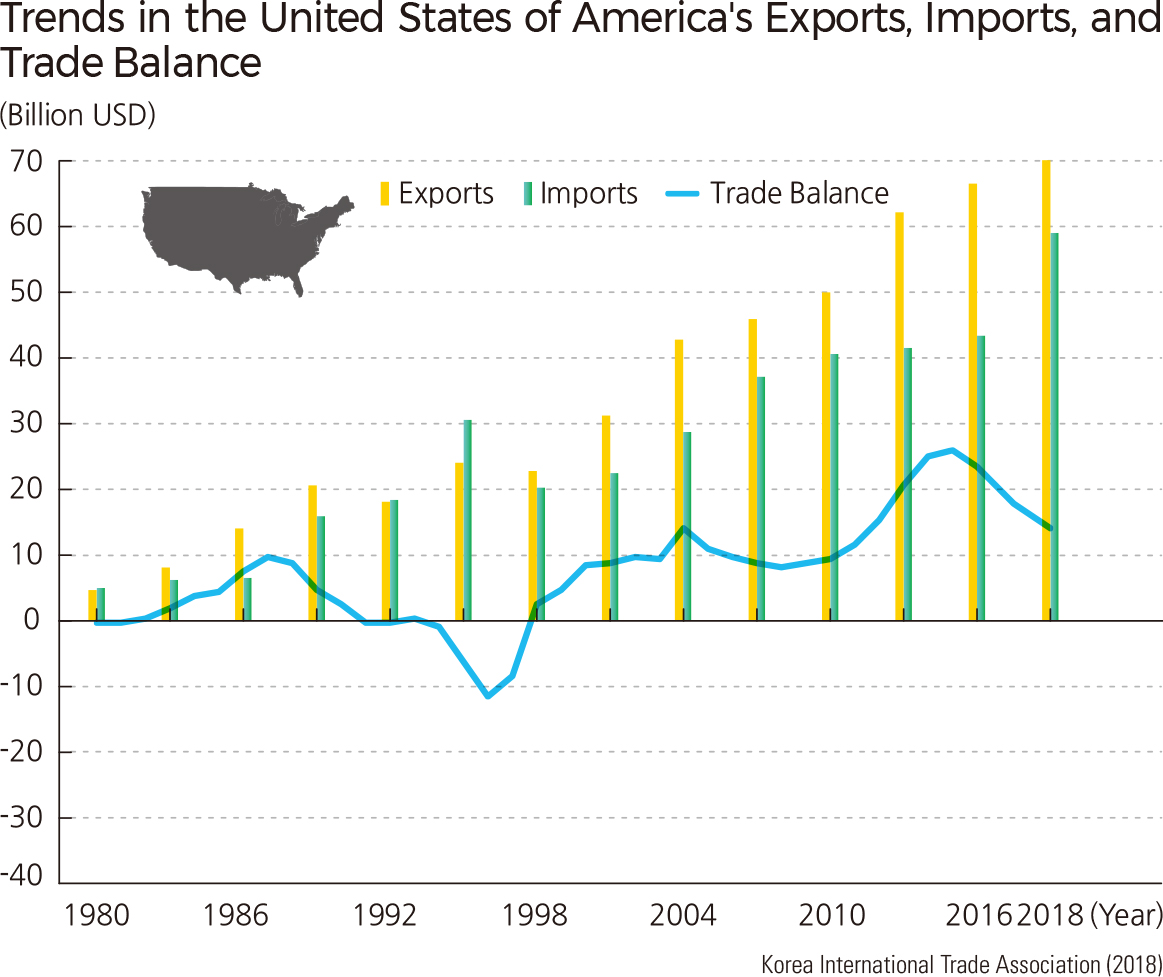
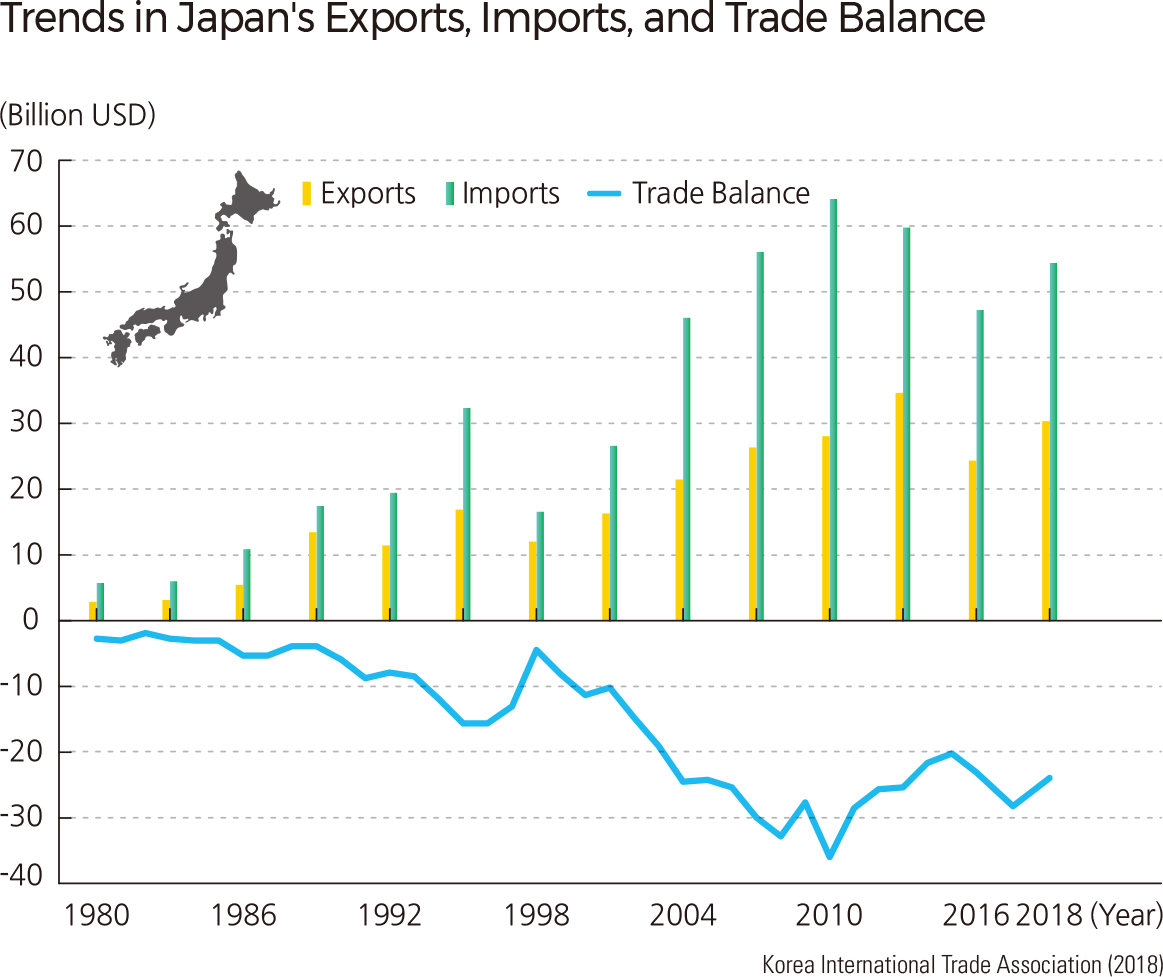
The main export partners for Korea are China, the US, Japan, Singapore, Vietnam, and the European Union (EU). Exports to China have increased from USD 3.8 billion (6.1% of total exports) in 1989 to USD 208.1 billion (34.3% of total exports) in 2018. Since the late 1990s, exports to Vietnam have also increased rapidly due to the rapid growth of Korean foreign direct investments in Vietnam. Exports to advanced economies such as the US, Japan, Singapore, and the EU have decreased. Along with this pattern of exports, imports have followed a similar trend. Korea’s major import partners are China, Japan, the United States, and Saudi Arabia, with China being the top importer of Korean goods since 2007.
In the 1980s, the trade balance showed deficits that continued until the mid-1990s. Beginning in the late 1990s, Korea experienced rapid increases in trade surplus, with the largest surplus of USD 95 billion in 2017, and the lowest deficit of USD 20.6 billion in 1996. Since the mid-1990s, Korea has posted mostly surpluses in large part due to the dramatic growth in exports. For example, exports had increased dramatically from USD 132 billion in 1998 to USD 605 billion in 2018. Since 2003, the largest surpluses came from trading with China. For example, a record surplus USD 99.6 billion was posted from trading with China in 2018, accounting for 142.3% of total trade surplus, whereas the trade deficit with Japan increased from USD 2.8 billion in 1980 to USD 36.1 billion in 2010. Since 2011, after diversifying import sources, the trade deficit with Japan has decreased. |