English I 2019
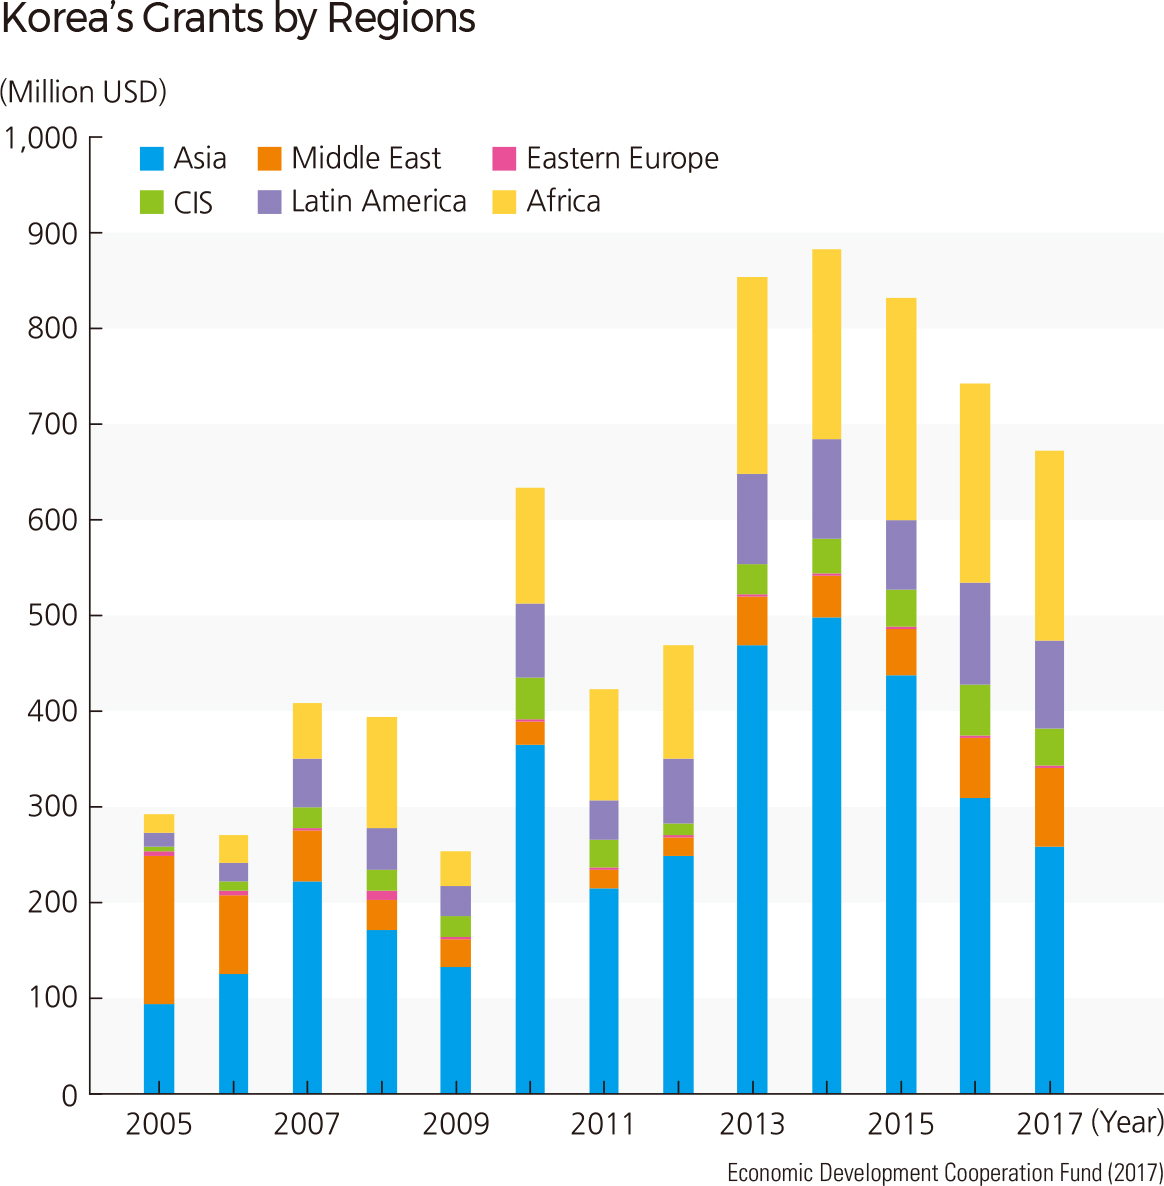
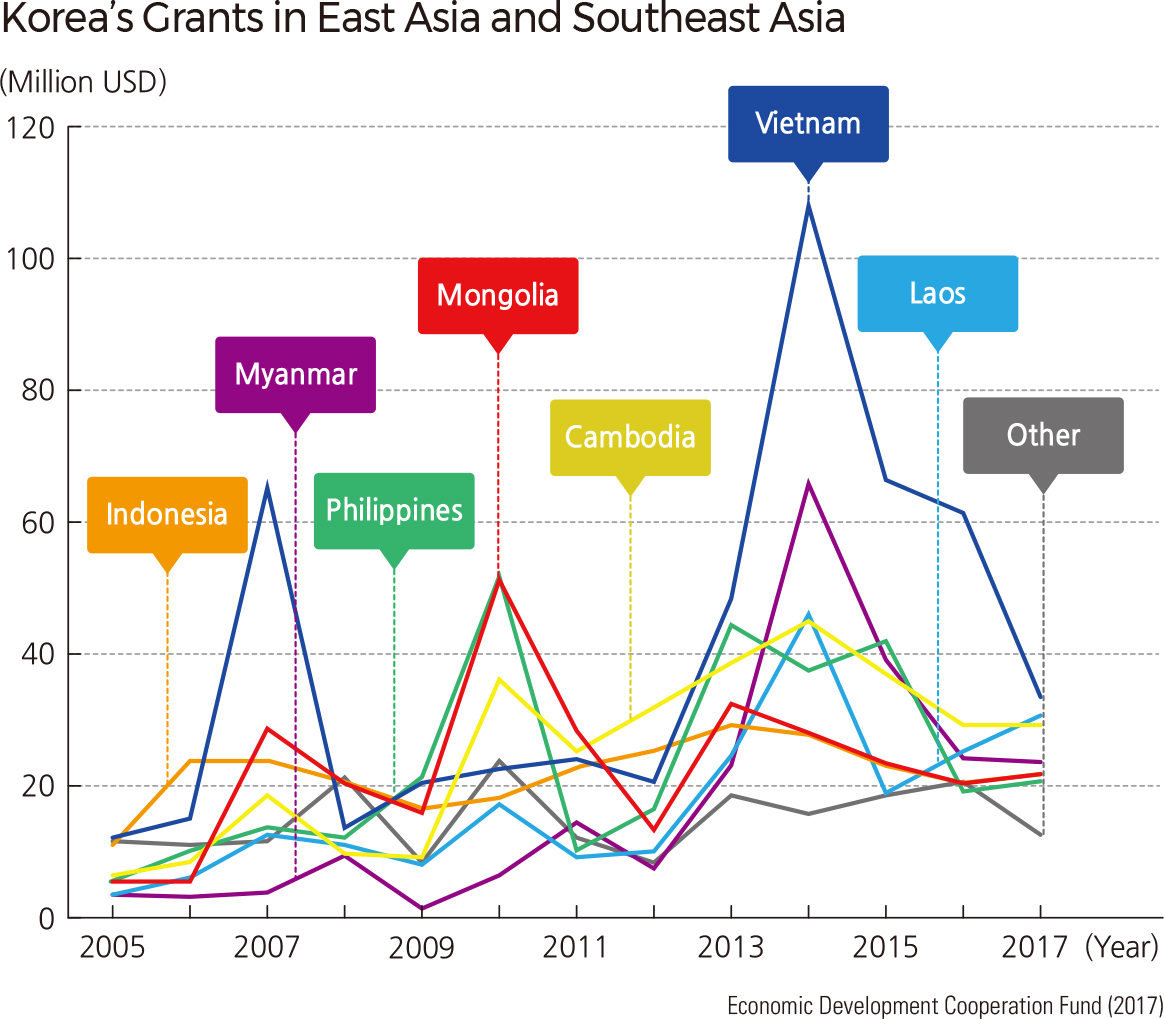
The graph shows the trend of Korea’s bilateral grants to Asia, the Middle East, Eastern Europe, the Commonwealth of Independent States (CIS), Latin America, and Africa. The total amounts of grant monies awarded have increased dramatically since 2010. In the mid-2000’s, the aid mostly targeted the Middle East, but the regions receiving the aid have now expanded to include Asia, Africa, and Latin America.
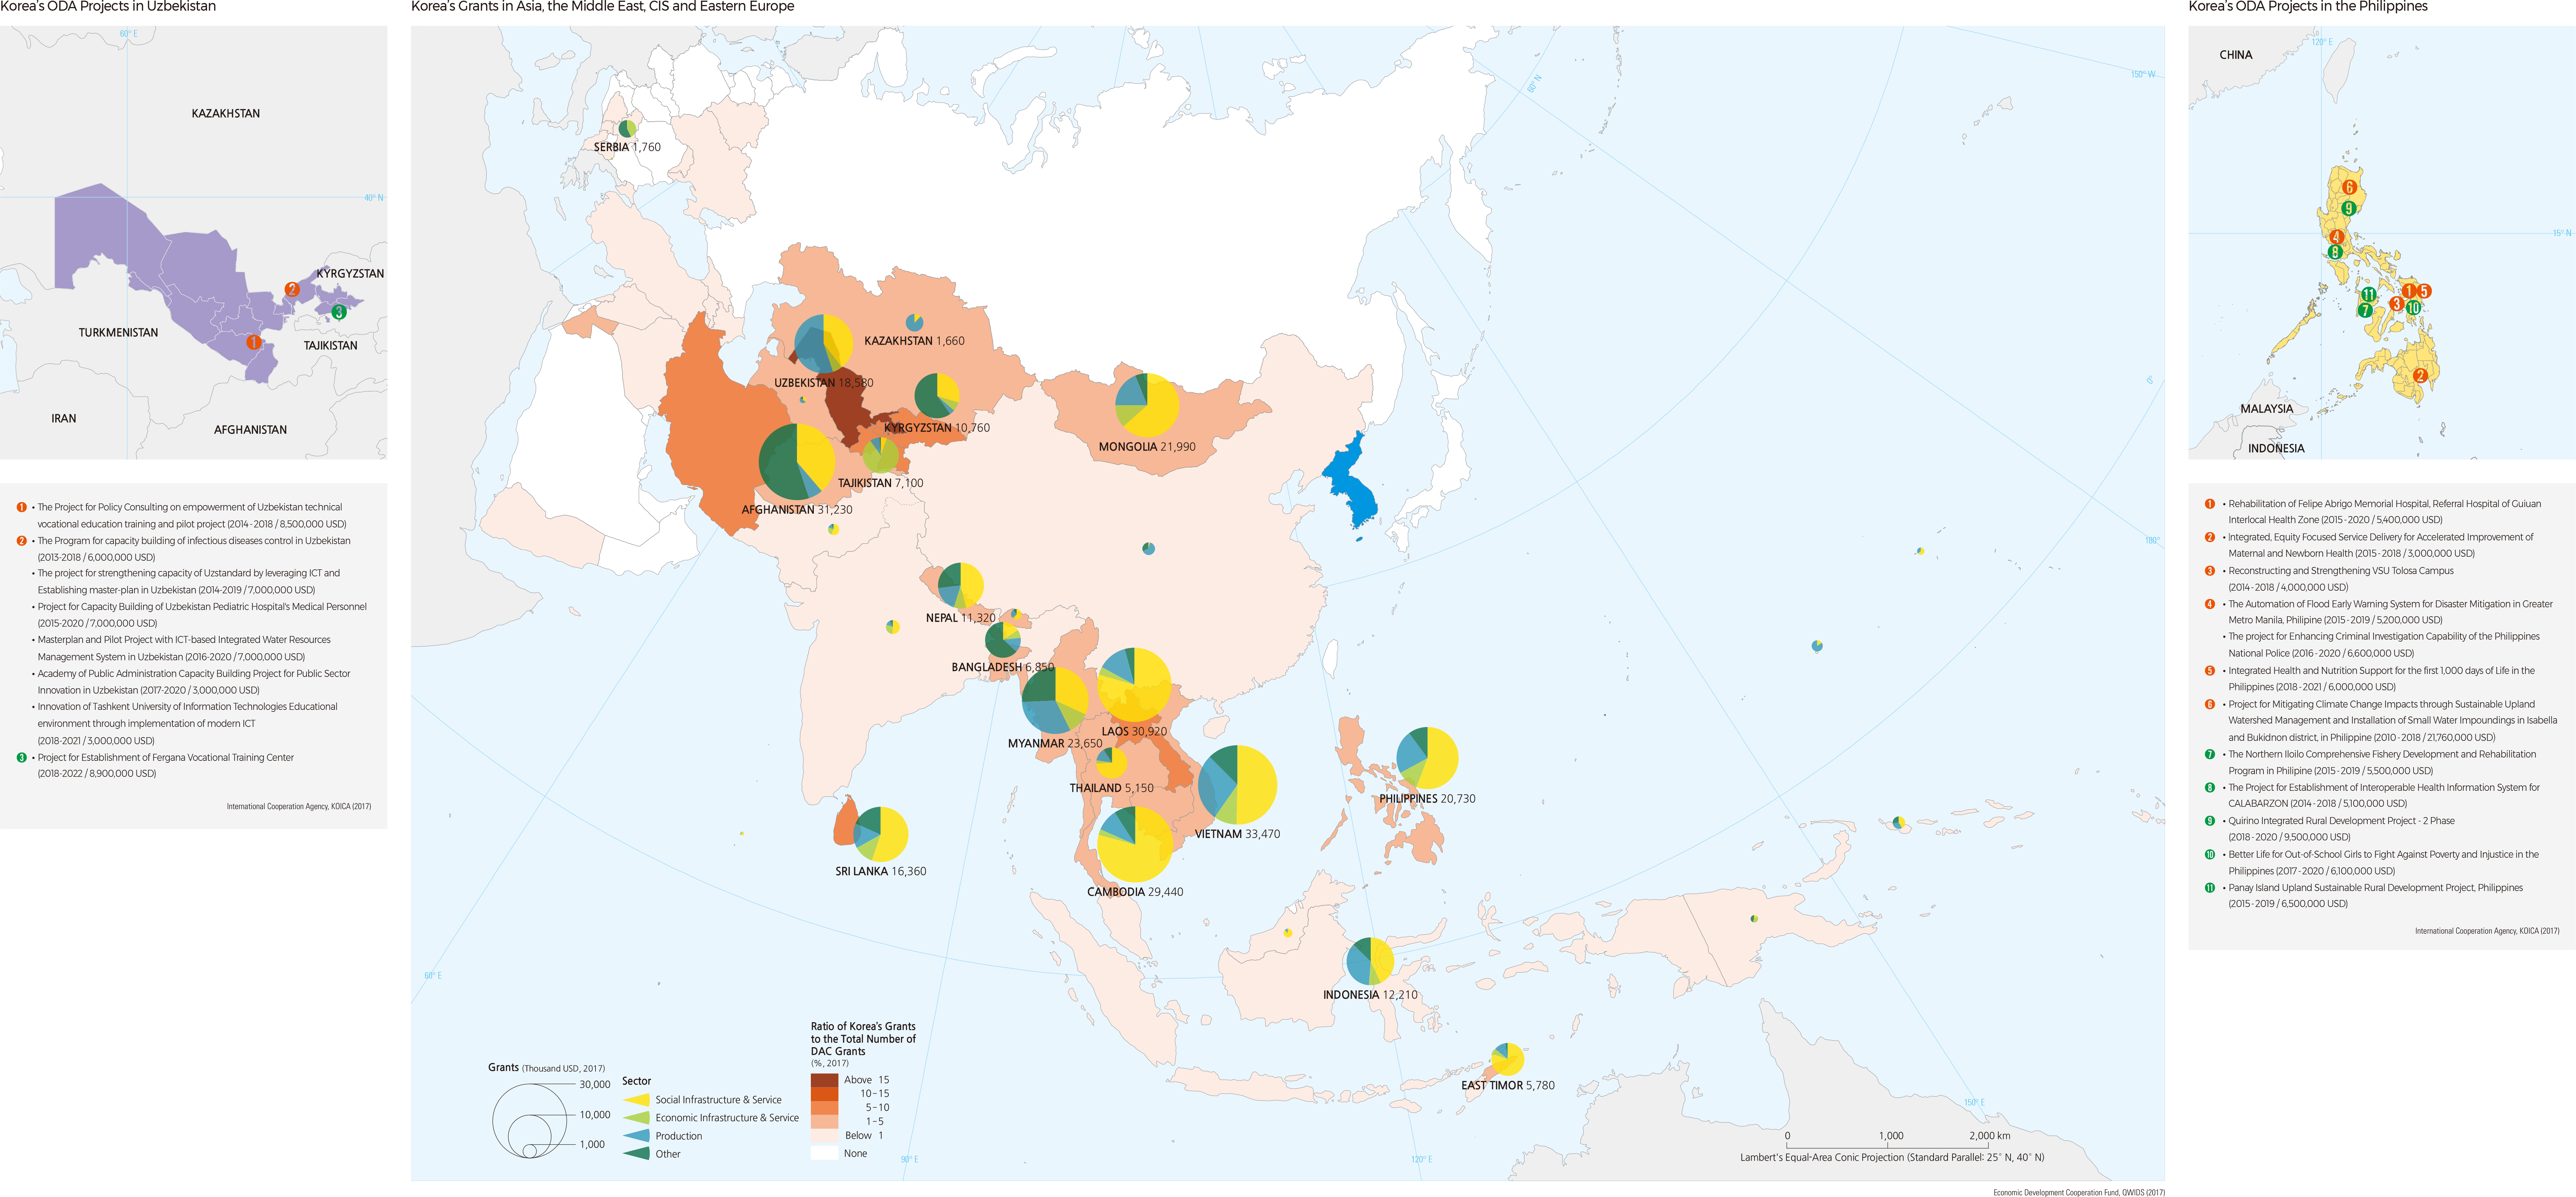
The map shows Korea’s bilateral Official Development Assistance for Asia, the Middle East, Eastern Europe, and the Commonwealth of Independent States (CIS) in 2017. The darker colors represent the countries that received larger grants from Korea than other DAC member countries. What becomes clear is that Korea provides more contributions to Asian countries such as Uzbekistan, Tajikistan, Kyrgyzstan, Laos, Cambodia, Vietnam, the Philippines, and Mongolia than do the other DAC member countries.
The map also shows that a significant amount of Korean aid goes to Vietnam, Afghanistan, Laos, Jordan, Cambodia, Myanmar, Mongolia, Philippines, and Uzbekistan. In general, the aid targets social infrastructure and services (education, health, population policies and programs, reproductive health, water supply and sanitation), economic infrastructure and services (transportation and storage, communications, energy, banking and financial services), and production sectors (agriculture, forestry, fisheries, industry, mining, construction, trade policies and regulations, and tourism).
The upper-left map presents the aid projects of the Korea International Cooperation Agency (KOICA) in Uzbekistan. Partly due to the uneven distribution of the Uzbekistan population, most of the projects cluster in the capital city, Tashkent. Most projects aim to improve infrastructure for public health and vocational training in ICT.
Meanwhile, the KOICA has funded a variety of projects in the Philippines (shown in the upper-right map), including medical service improvement such as maternal and child health, sustainable rural development programs, and natural disaster prevention projects addressing typhoons and floods.
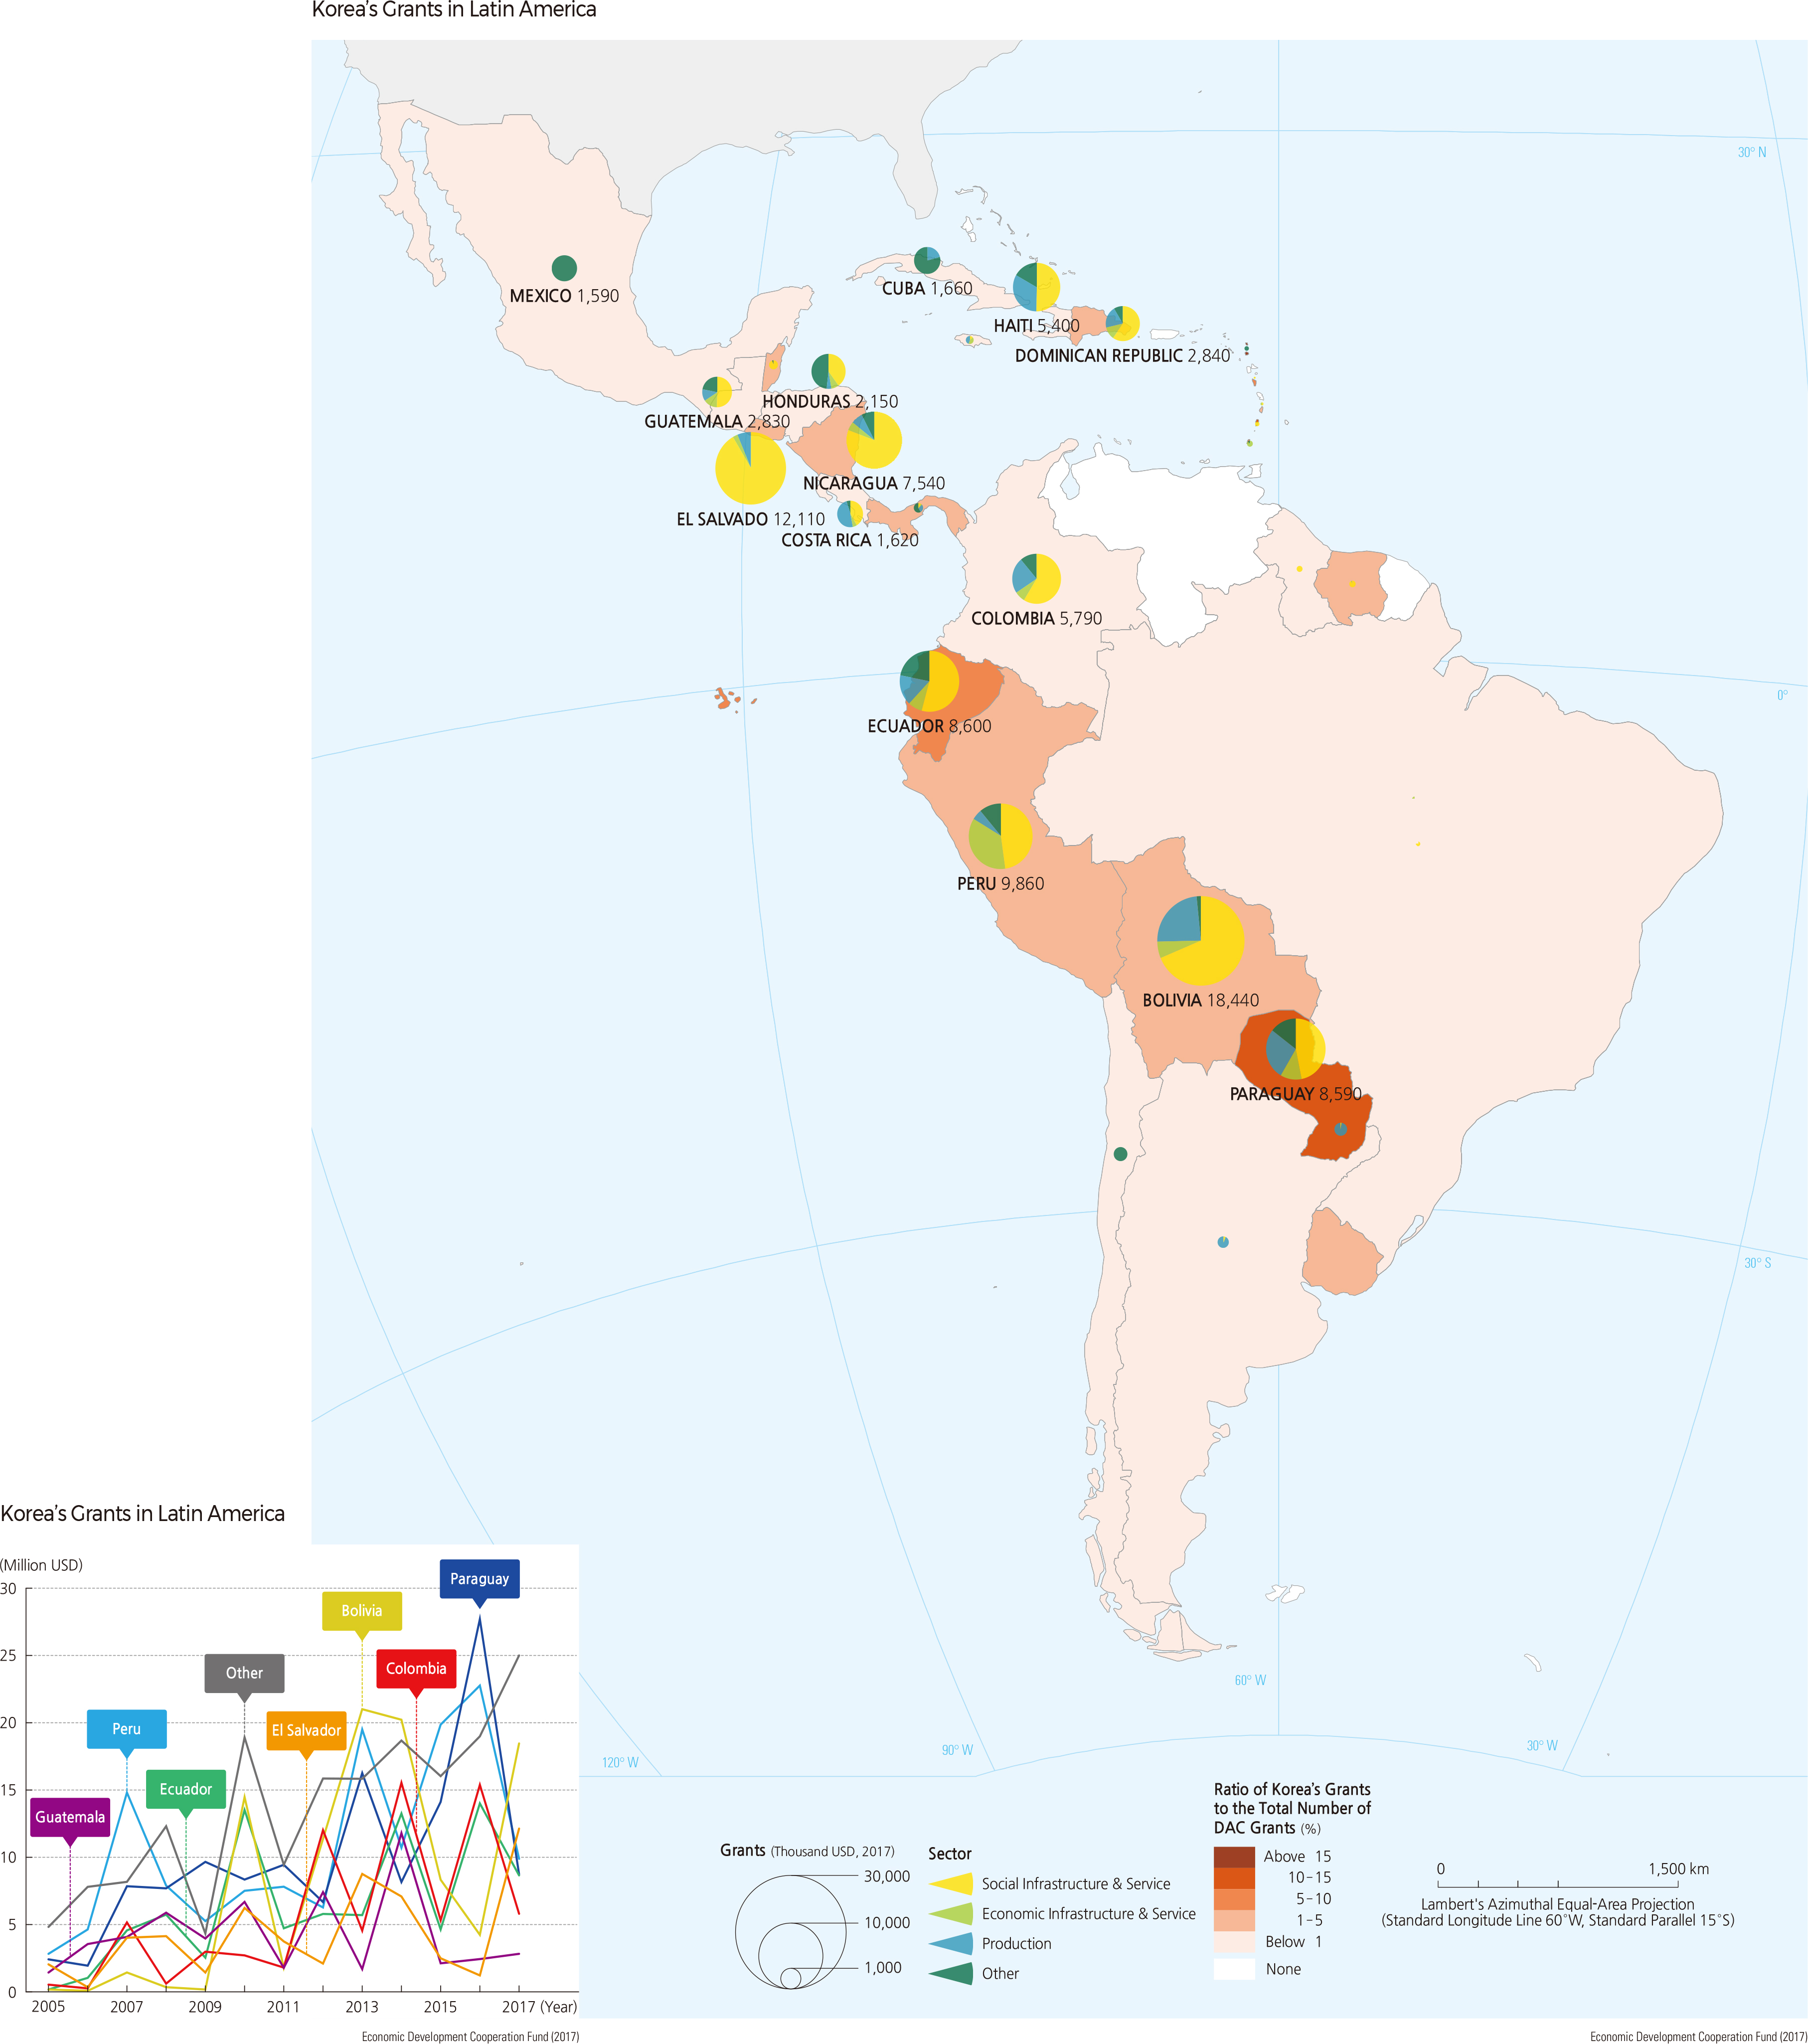
The map displays Korea’s bilateral Official Development Assistance to Latin America in 2017. More specifically, it represents the proportion of Korea’s grants out of the total grants from all the DAC members. The countries which are more dependent on assistance from South Korea are represented in darker colors. Those countries include many in Central America (excluding Mexico), as well as the eastern coastal regions of South America. Particularly high proportions of South Korean aid appear in Paraguay, Grenada, and El Salvador.
The pie graph shows the size and sector of the grants by recipient. In terms of size, the largest recipients of Korean aid are Bolivia, El Salvador, Peru, Ecuador, Paraguay, Nicaragua, Colombia, and Haiti. These grants primarily target social infrastructure and service, but the economic infrastructure and production sectors also receive assistance in several countries.
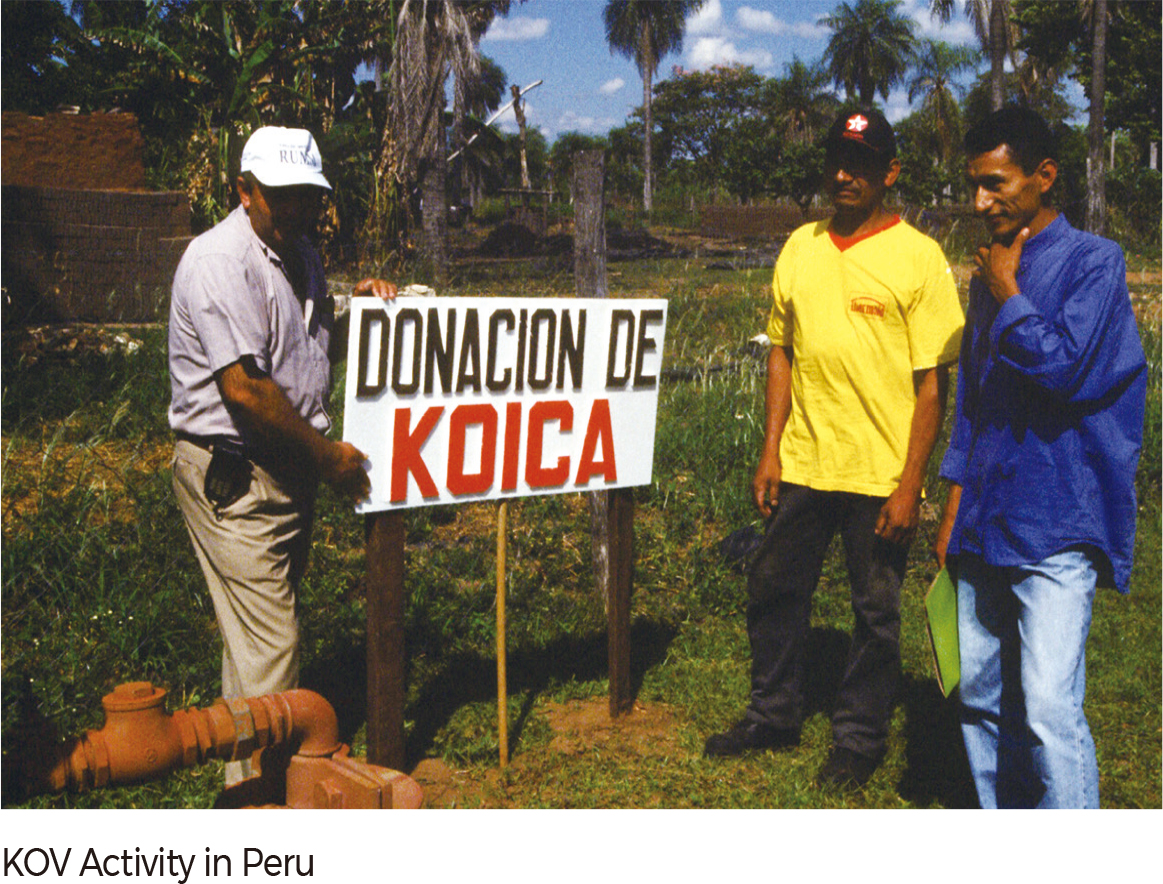
A good example of the social infrastructure and service sector support is The First Korea-Peru Health Center Construction Project. The total amount of the grant was about USD 2.4 million, which was distributed from 1992 to 2010. This project has helped to improve public health and medical service in the region. Another example is the Modernization of Communication and Information System of the State Ministries of the Republic of Paraguay, which was designed to help the government provide service more effectively.
An example of the economic infrastructure and service sector support that Korea has provided includes the USD 2.5 million grants to build the irrigation canal in the Chimborazo province in Ecuador. When this canal project was finished in 2010 it helped local communities increase their agricultural productivity.
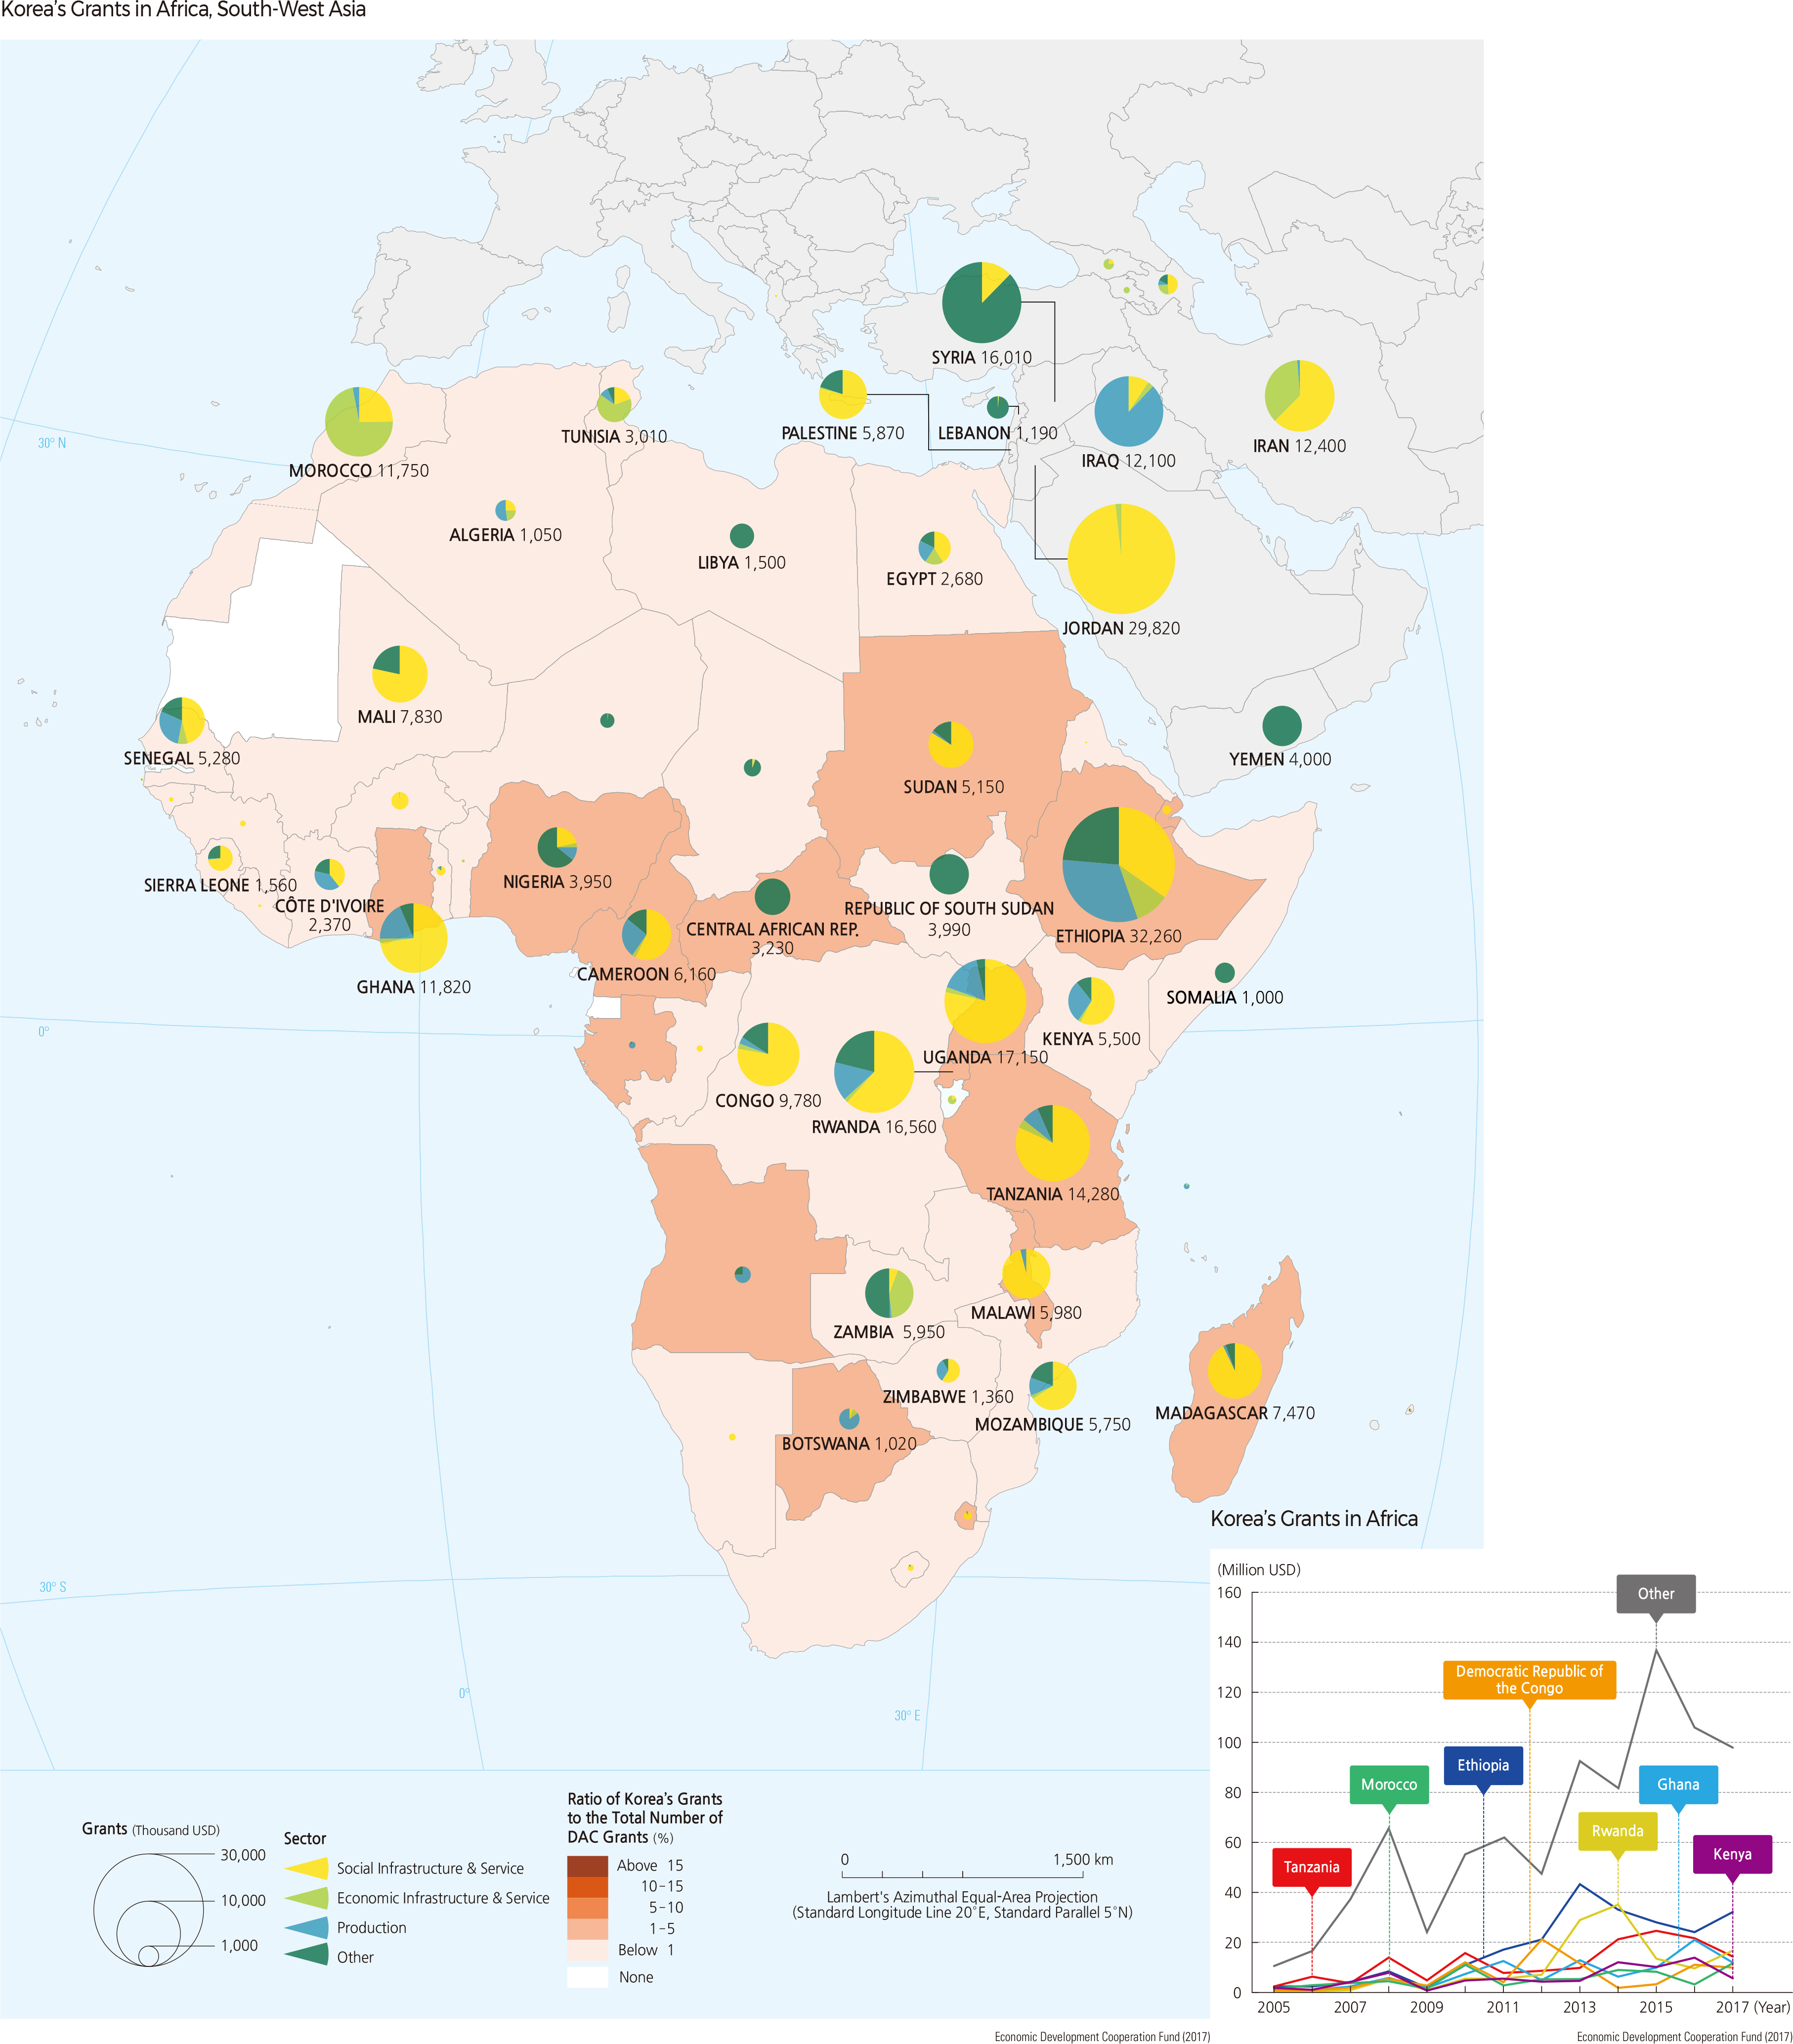
The map shows Korea’s bilateral foreign aid for African countries in 2017. The dark colors represent those countries where Korean grants occupy larger proportions among the total DAC grants. Contrary to the clustered geographical pattern of the aid distribution in Latin America, Korea’s grants are relatively evenly distributed to most African countries.
The pie charts of Korean aid represent countries, dollar amounts, and sectors that received Korean aid. The largest grant recipients in Africa are Ethiopia, Uganda, Rwanda, Tanzania, Ghana, and Morocco. Also, the amounts given to those countries have increased gradually (see the graph). More than half of the grants fund social infrastructure and services. In the countries suffering from civil war and/or famine, grants supported improvement projects in the economic infrastructure and service sector.
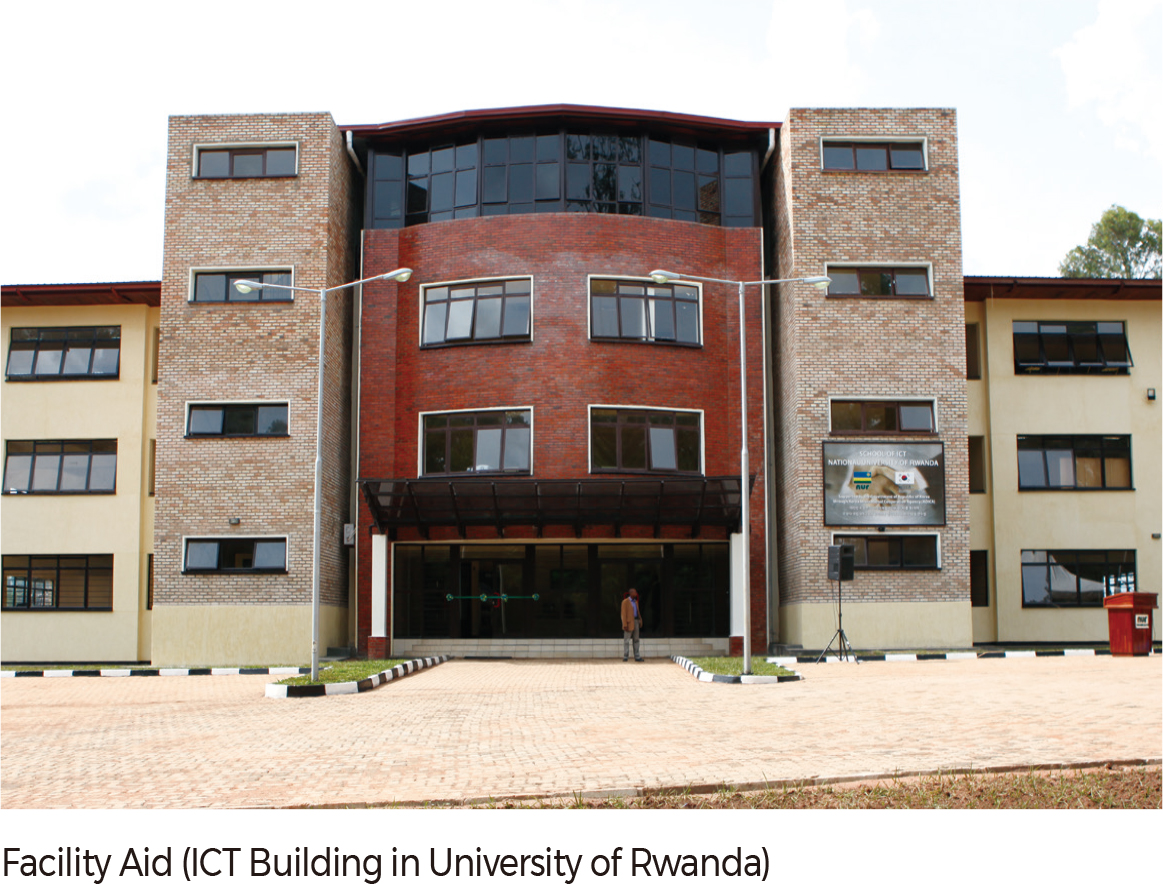
An example of the projects in the social infrastructure and services sector is found in Ethiopia. Korea has supplied USD 2.8 million to help prevent tuberculosis, particularly in the city of Addis Ababa. Korea has also helped Rwanda with a variety of education and training programs. An example of these efforts is constructing the ICT innovation center in the Kigali special economic zone. |