English III 2021
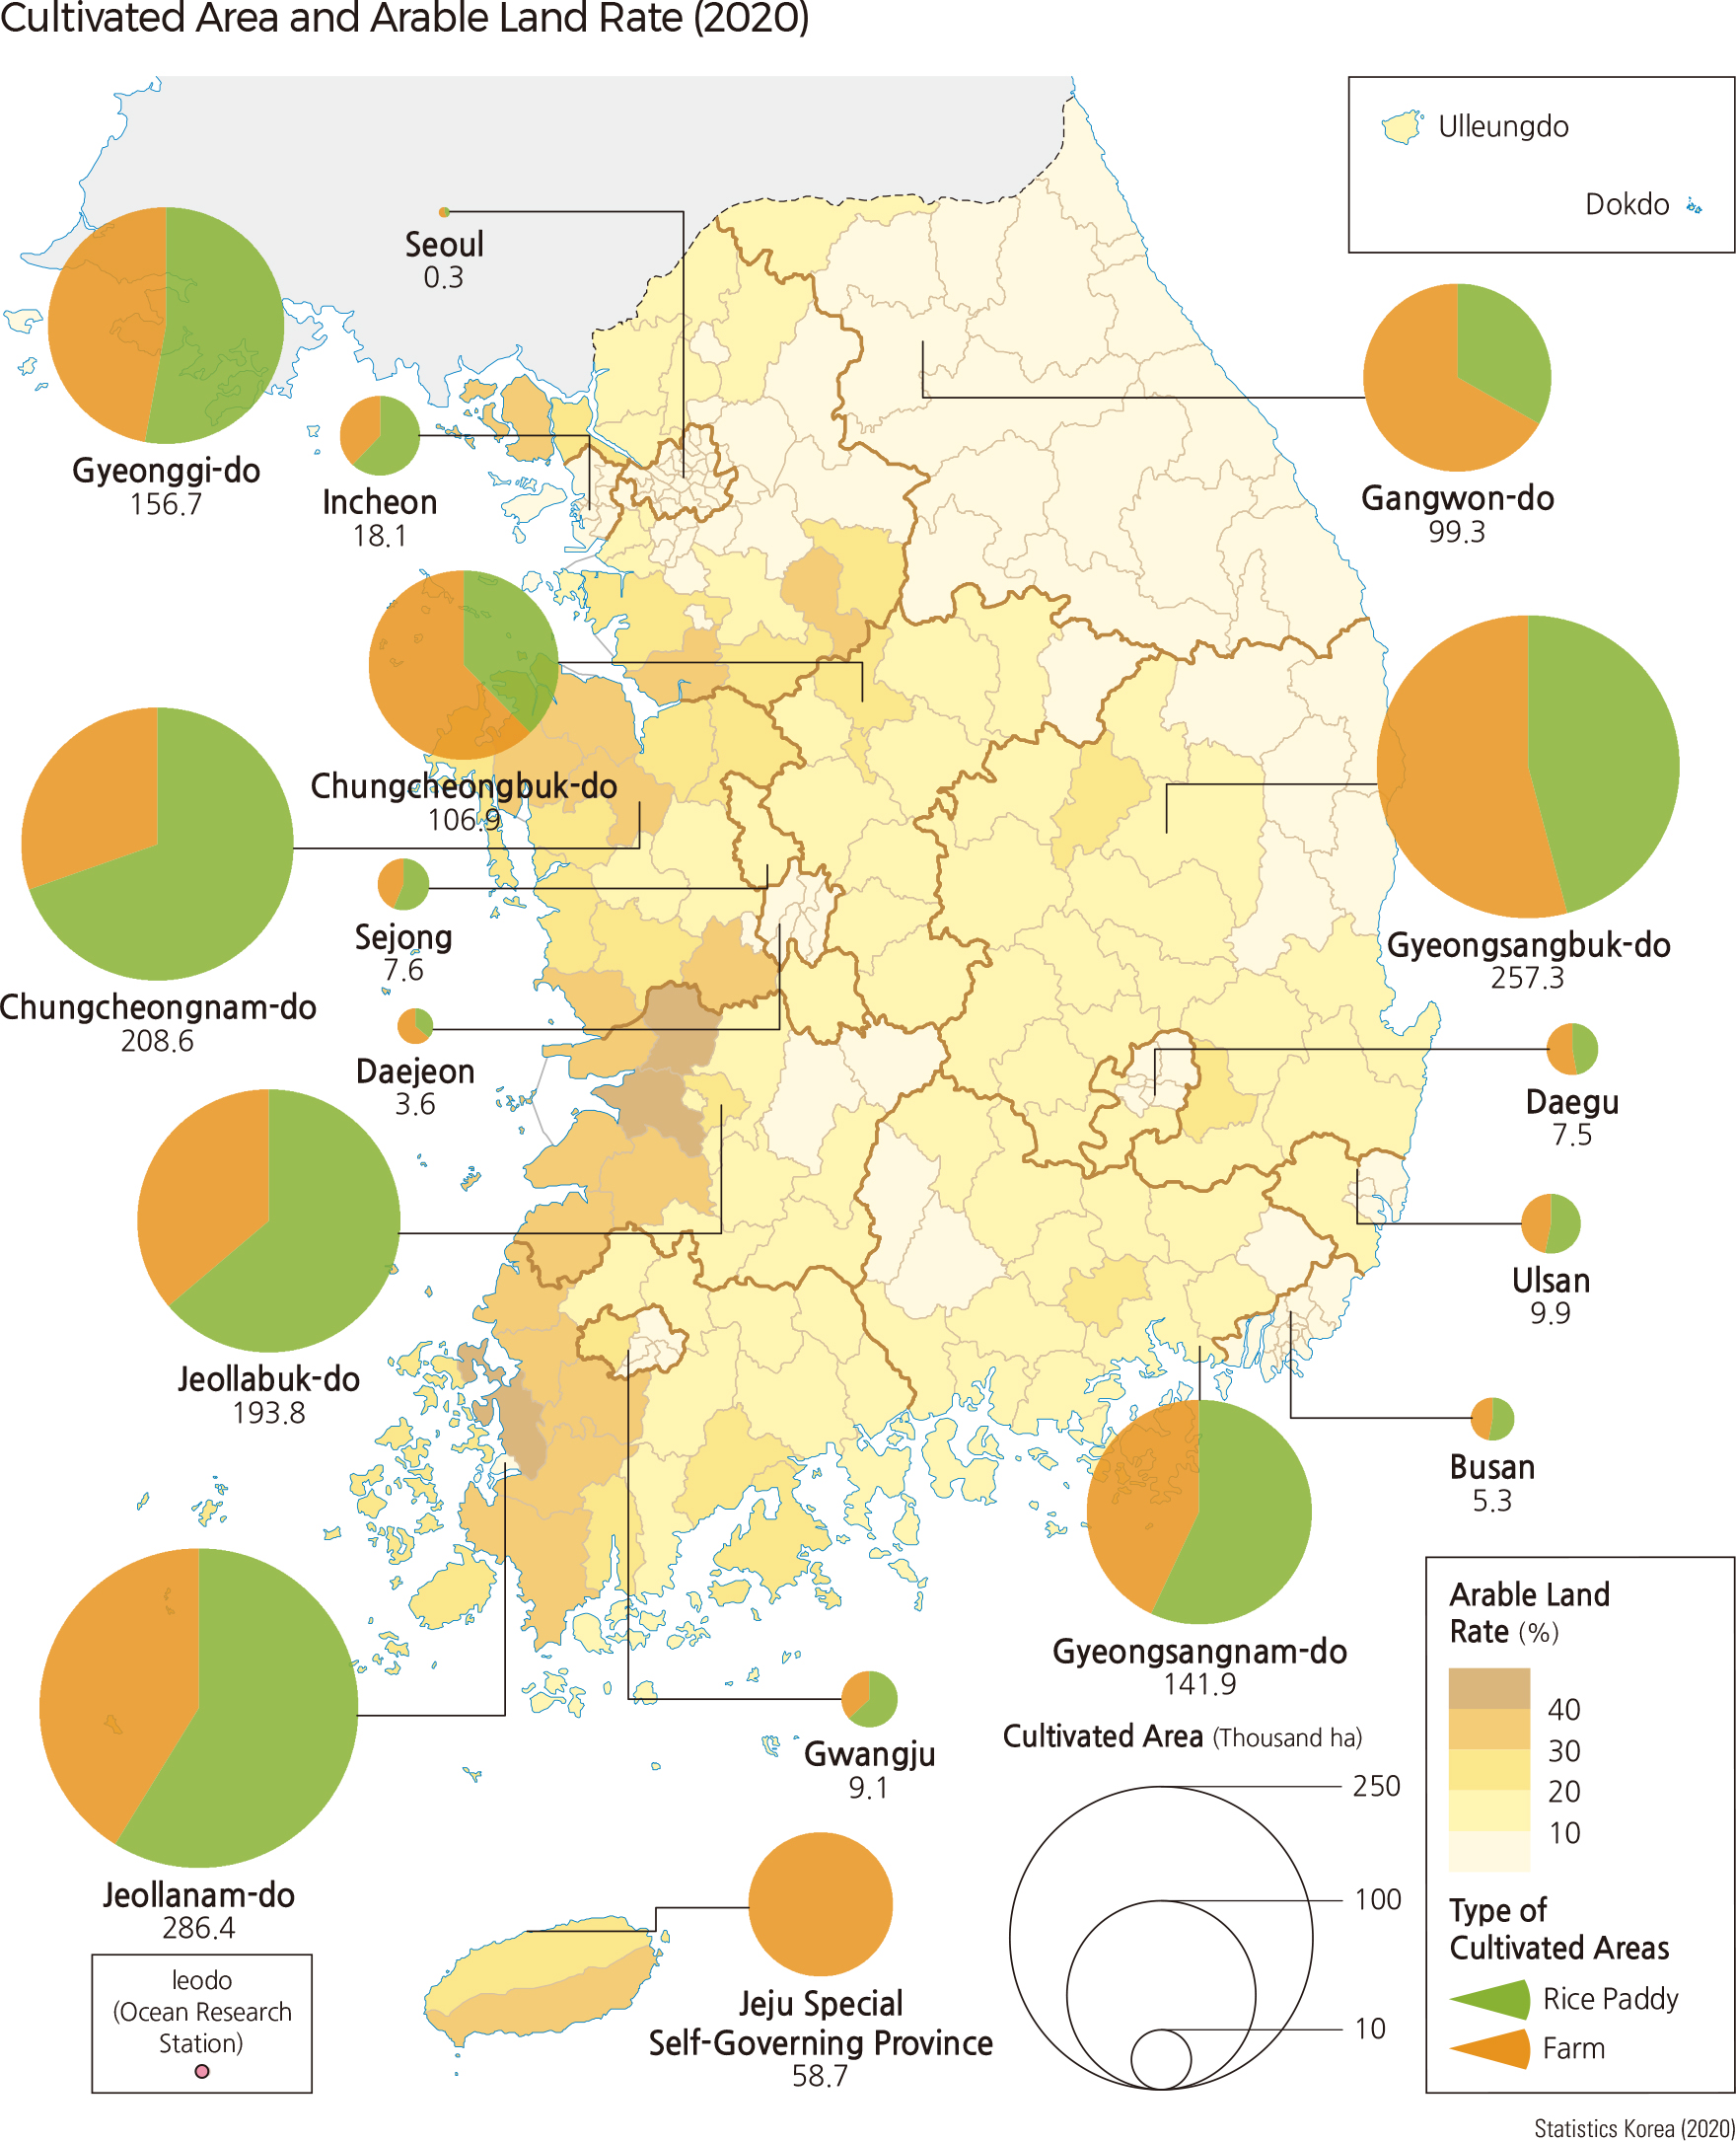
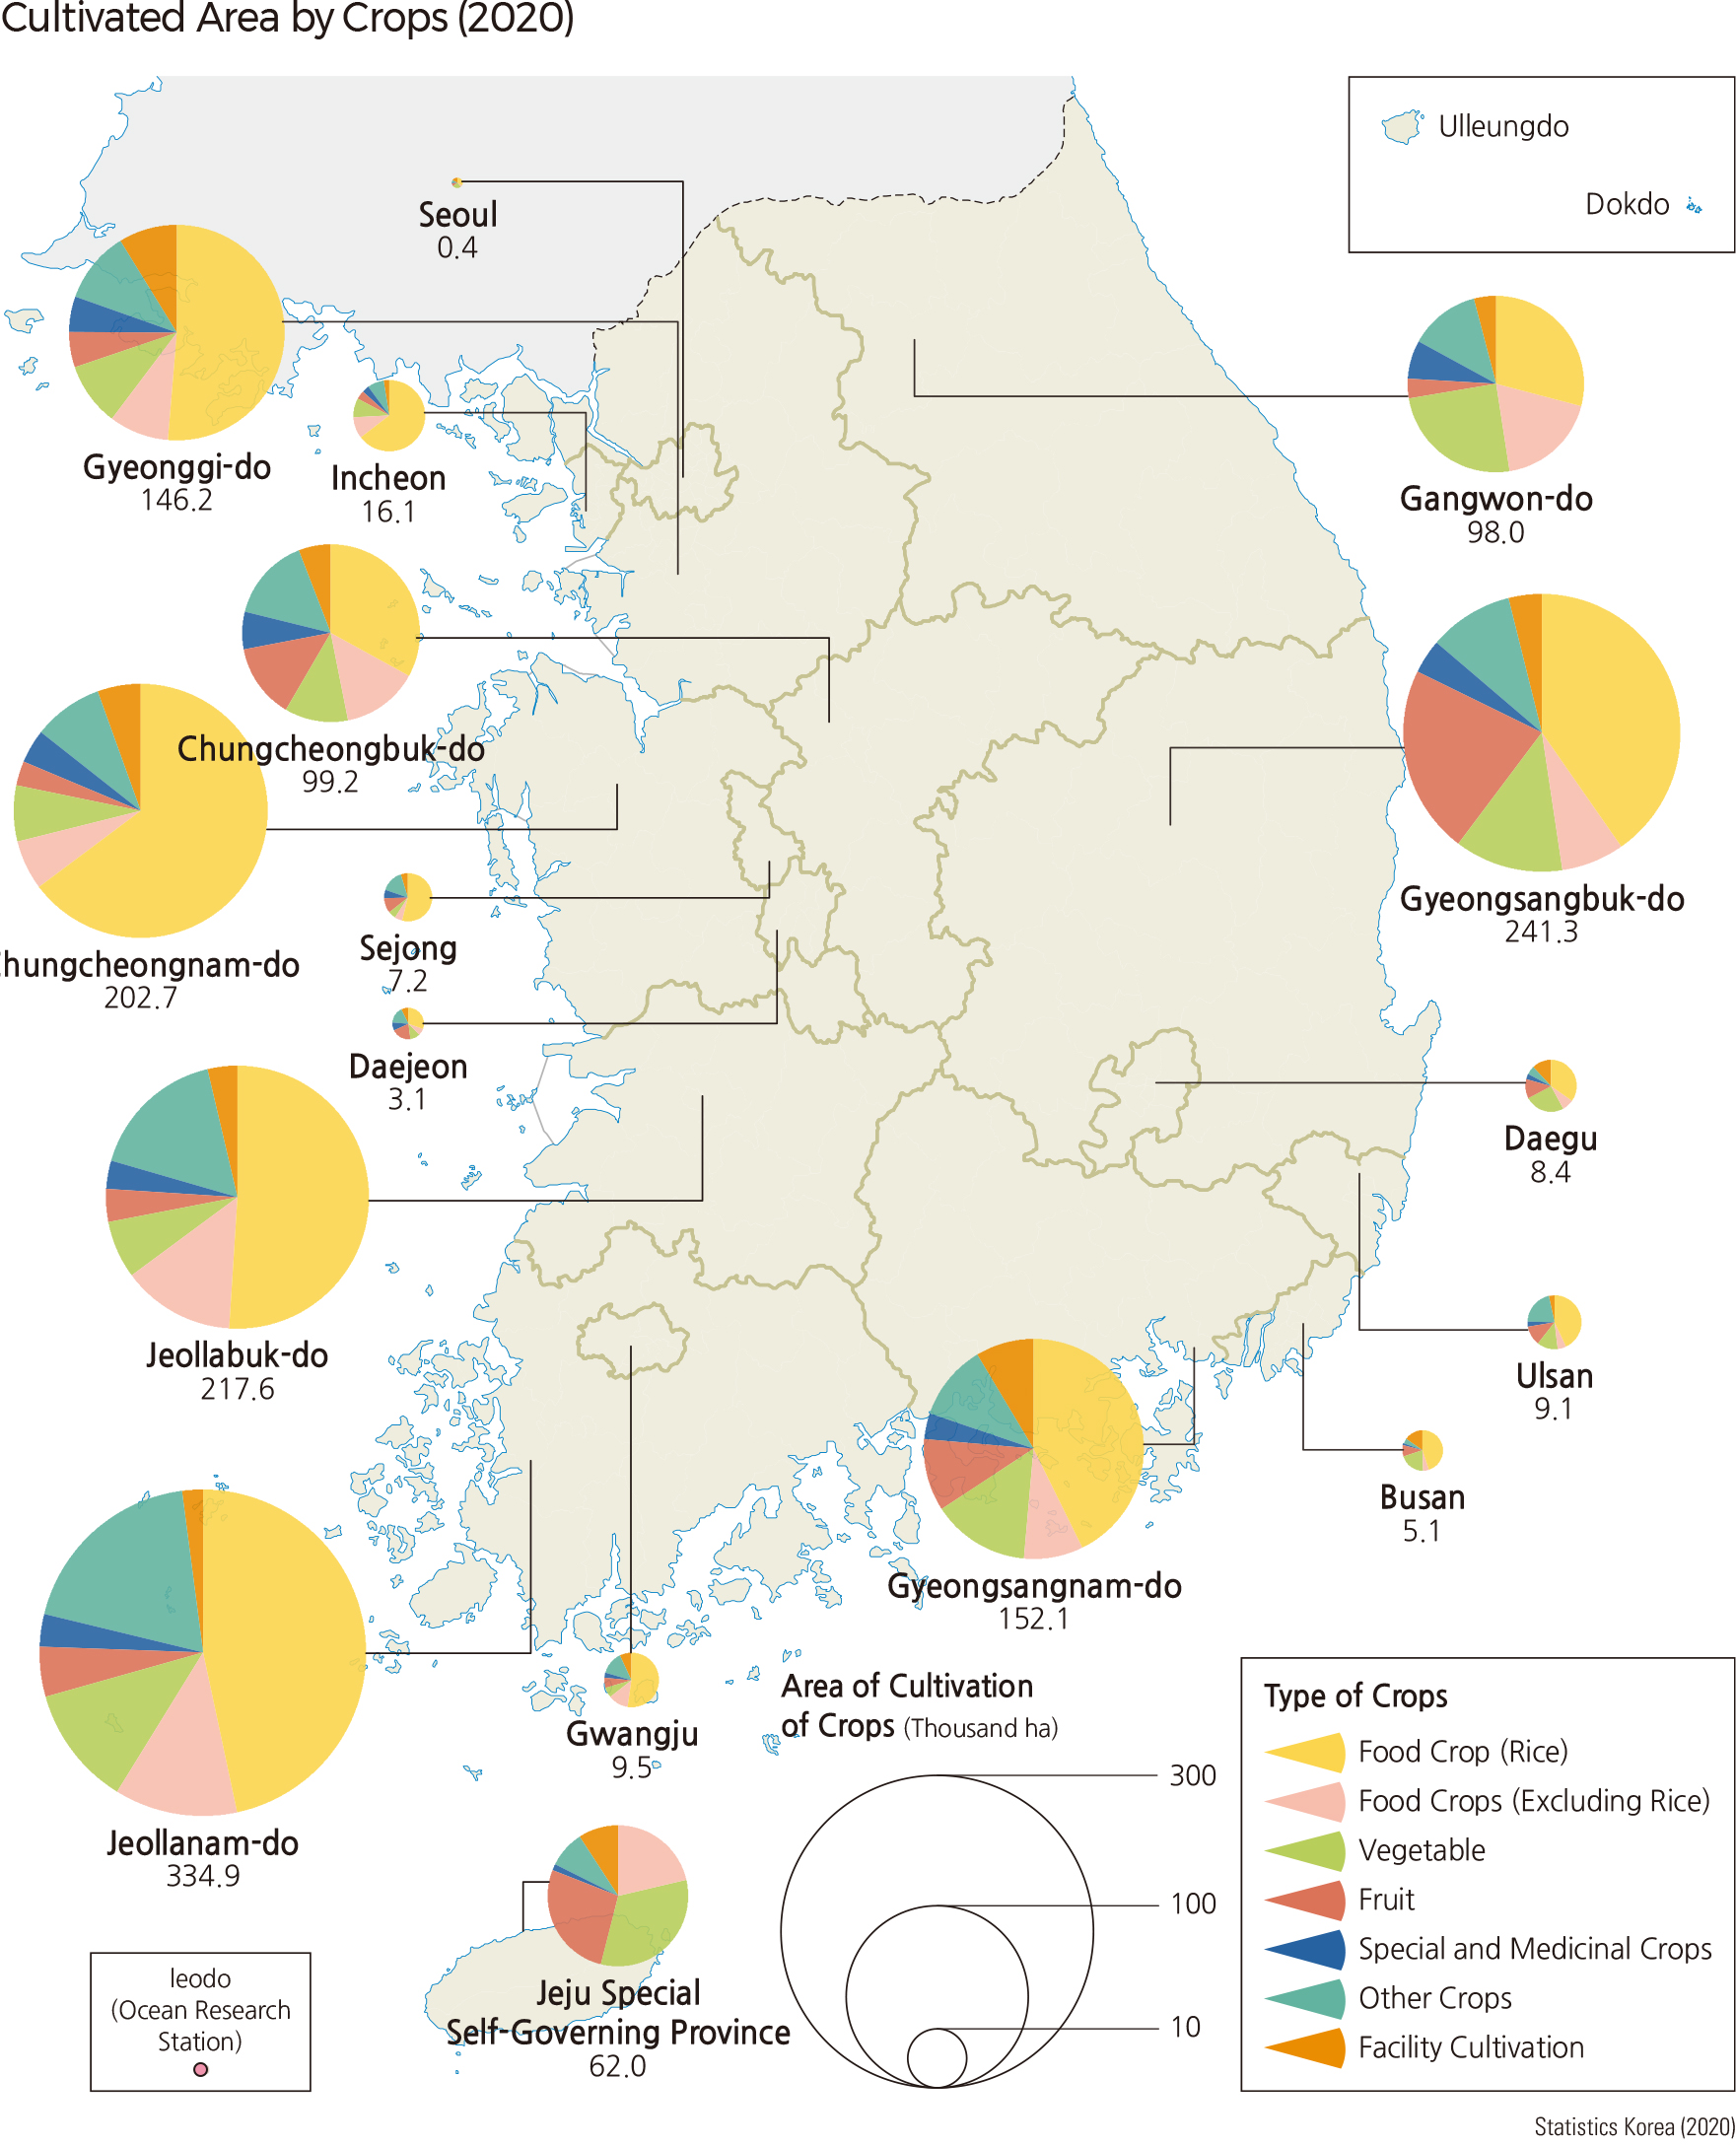
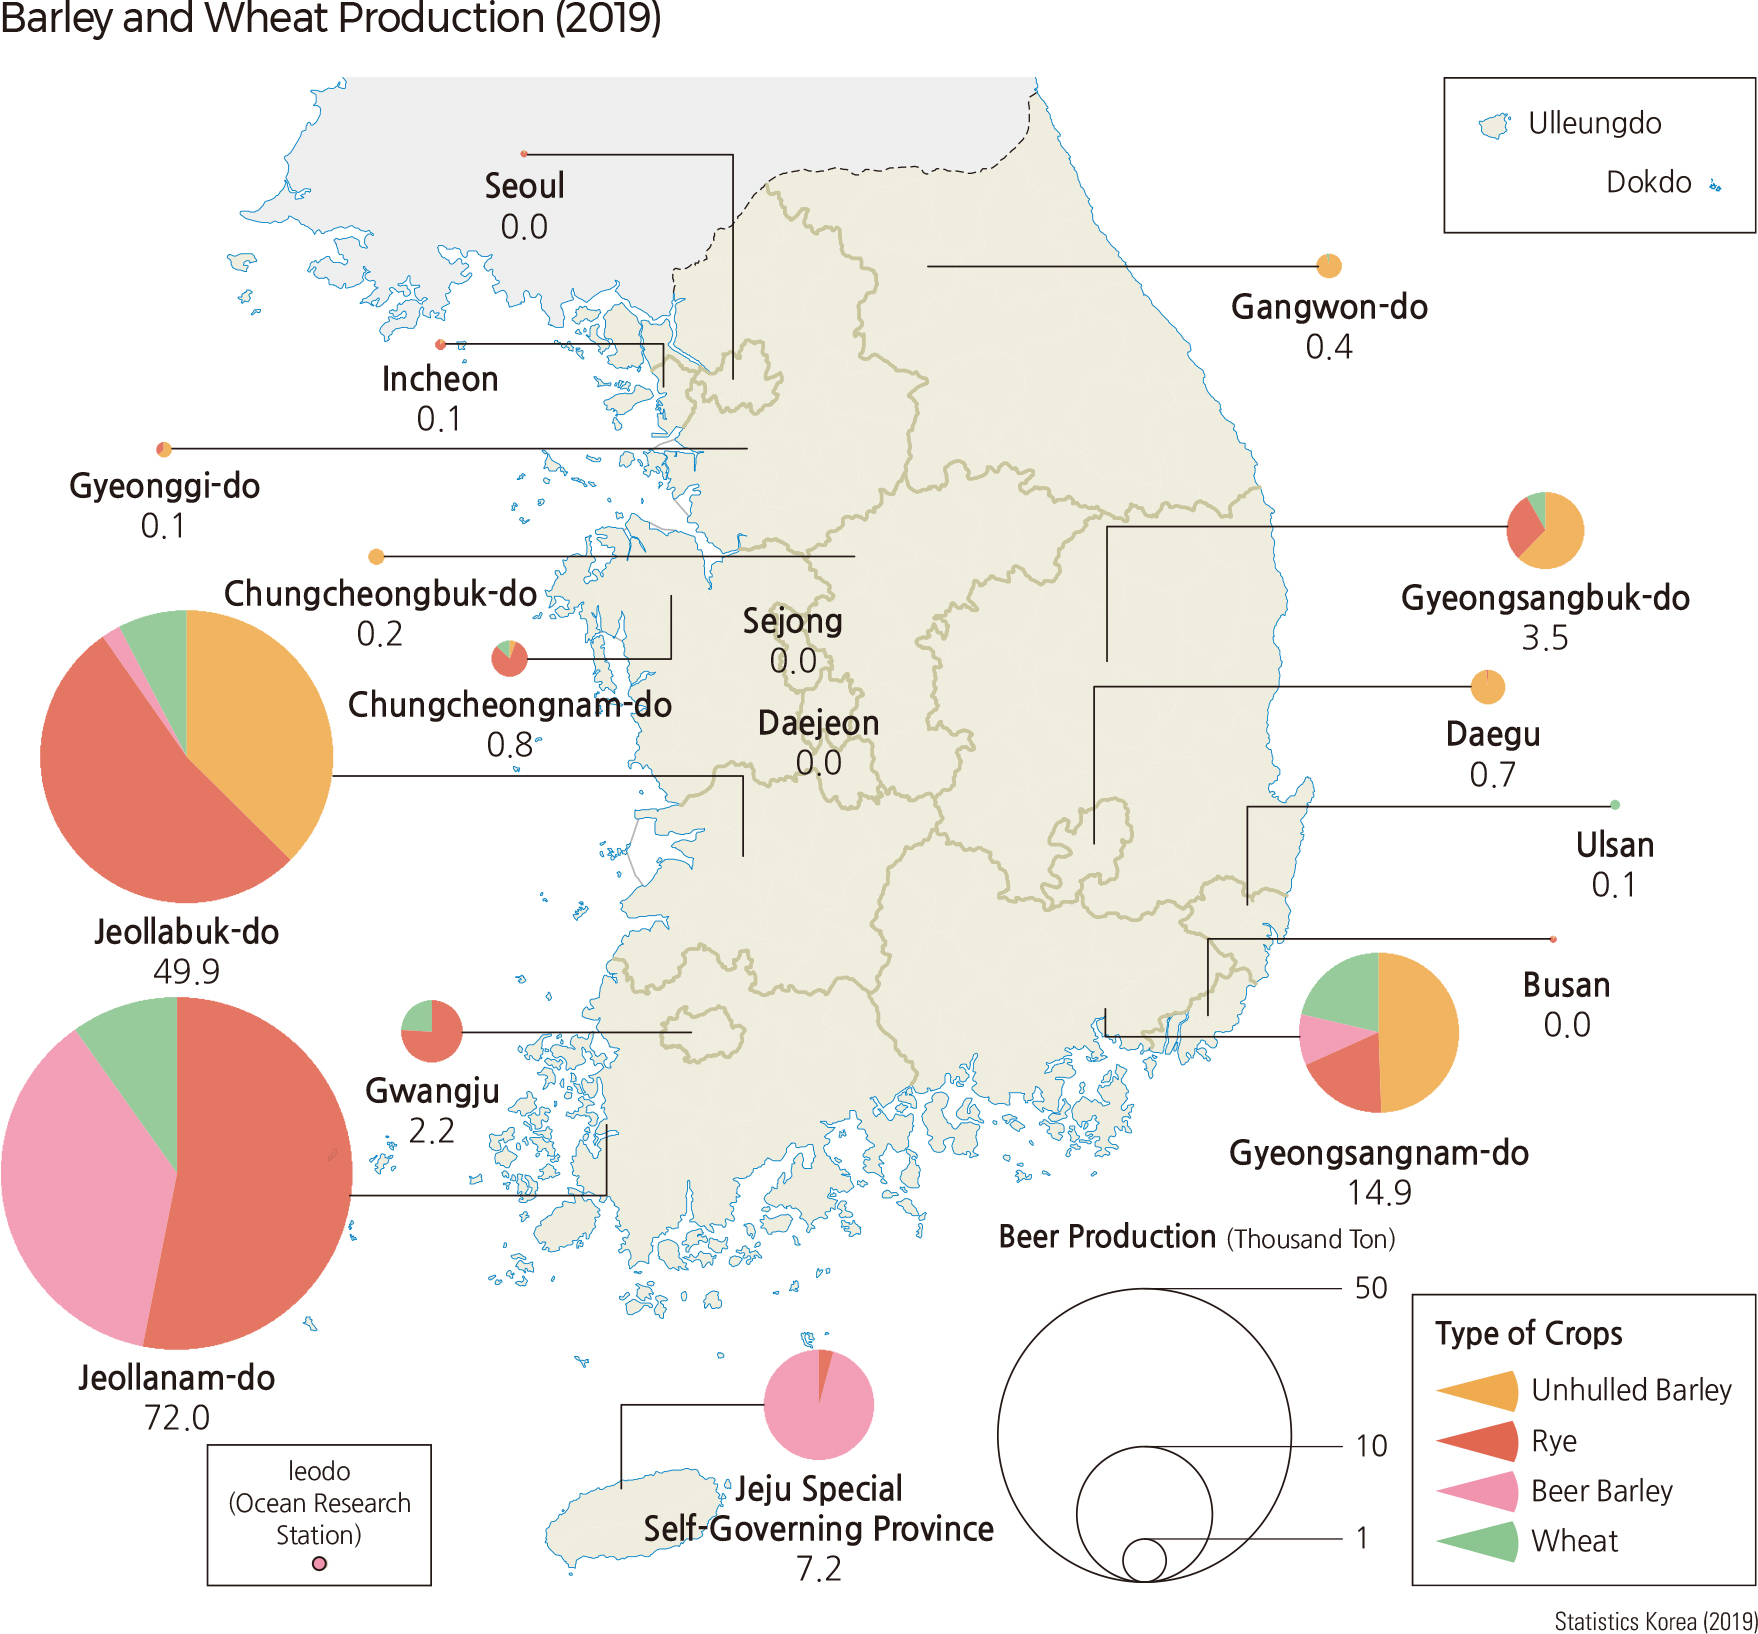
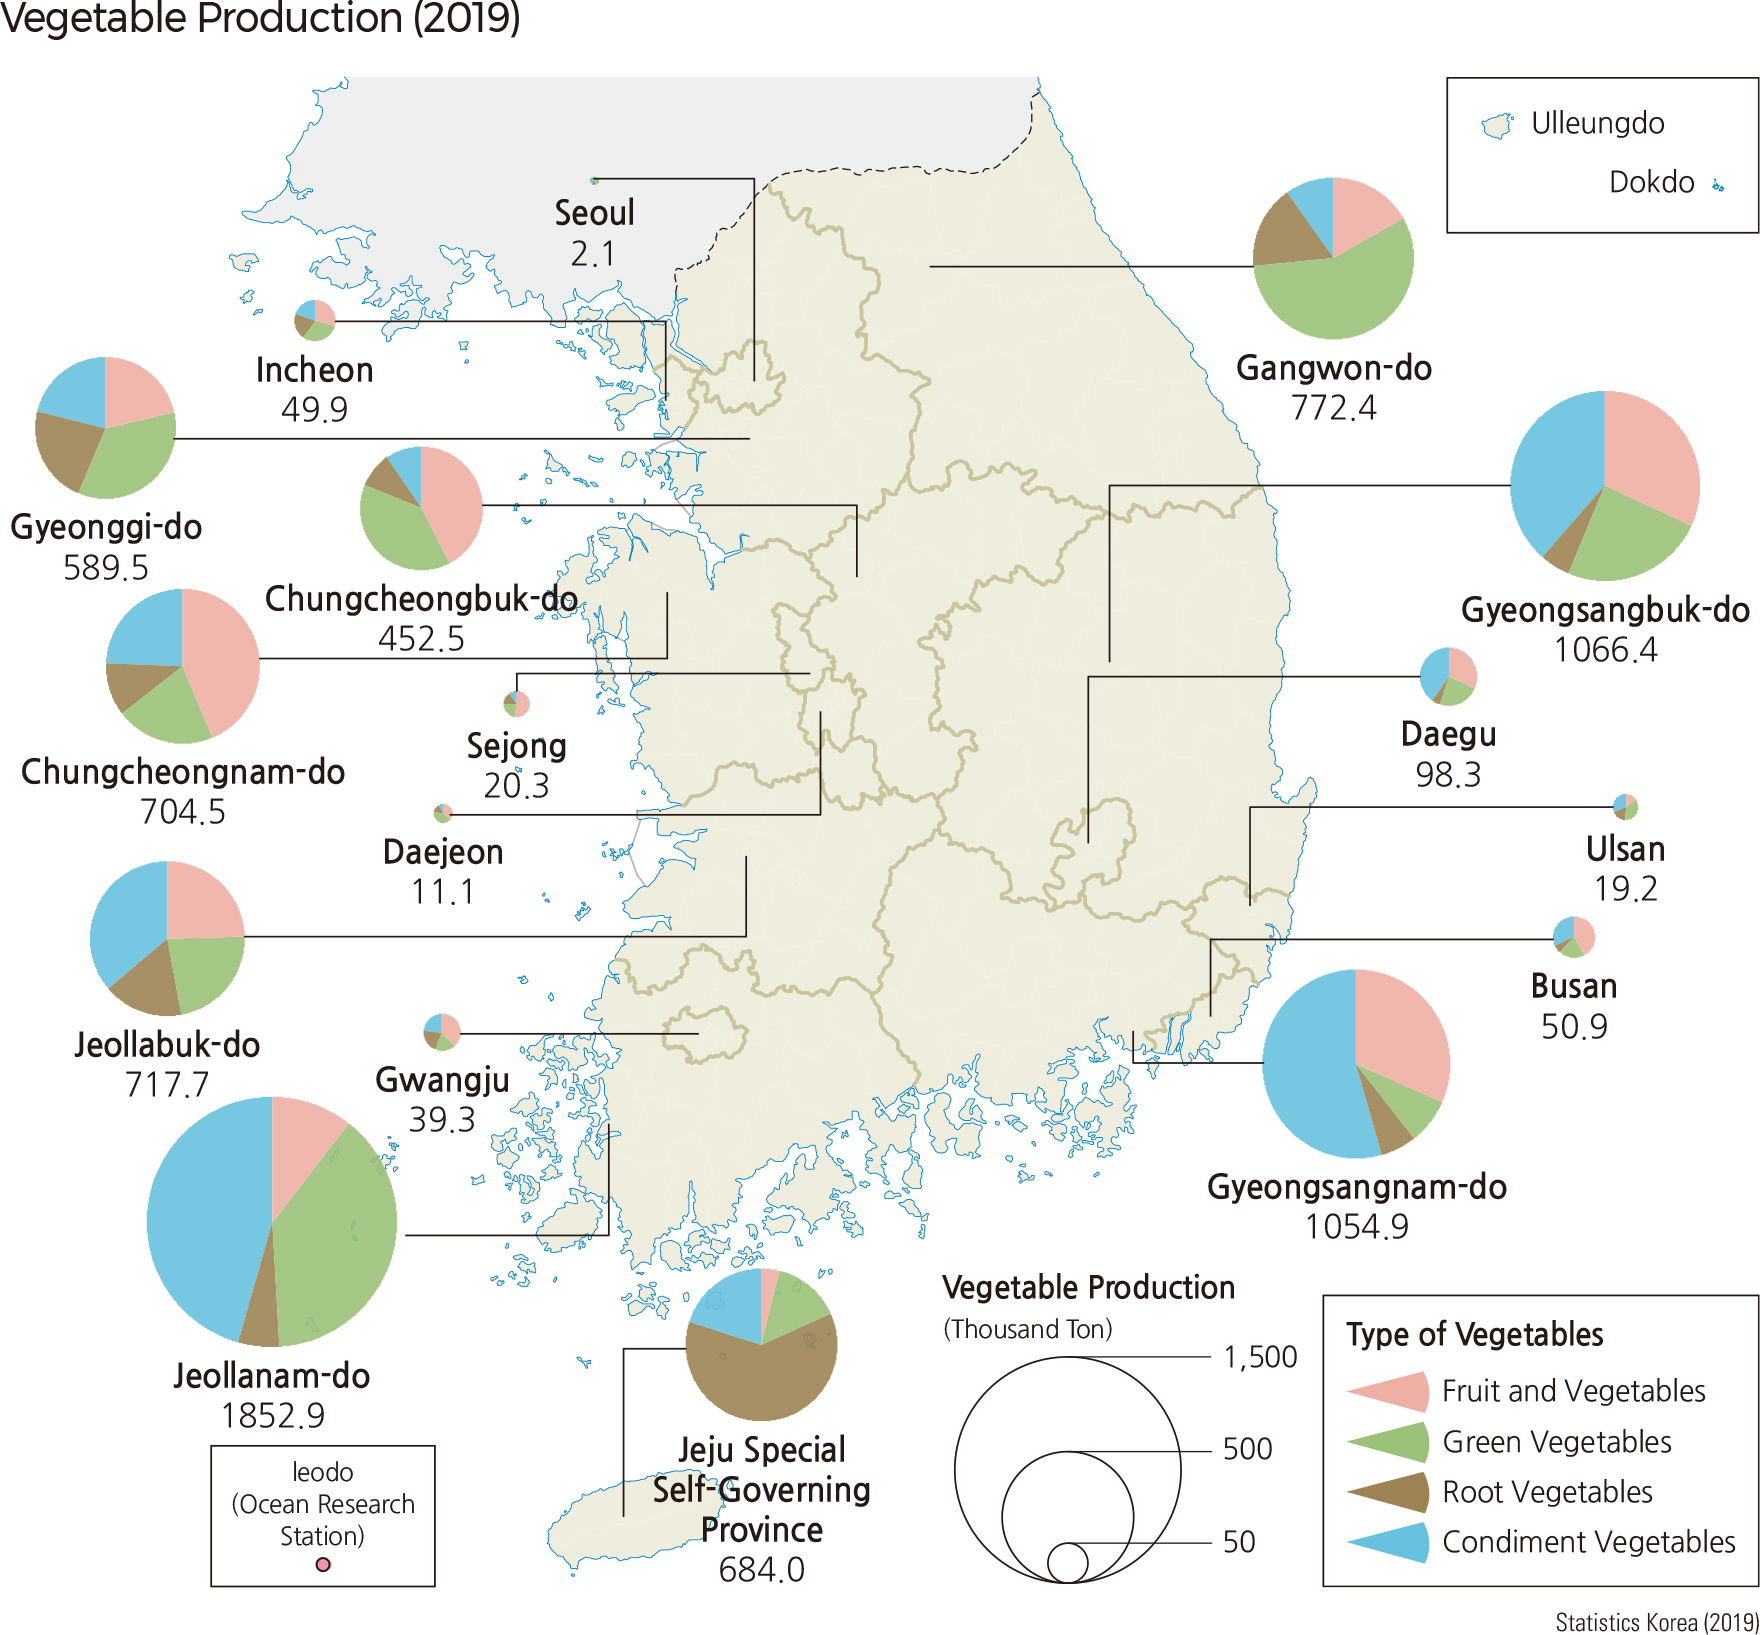
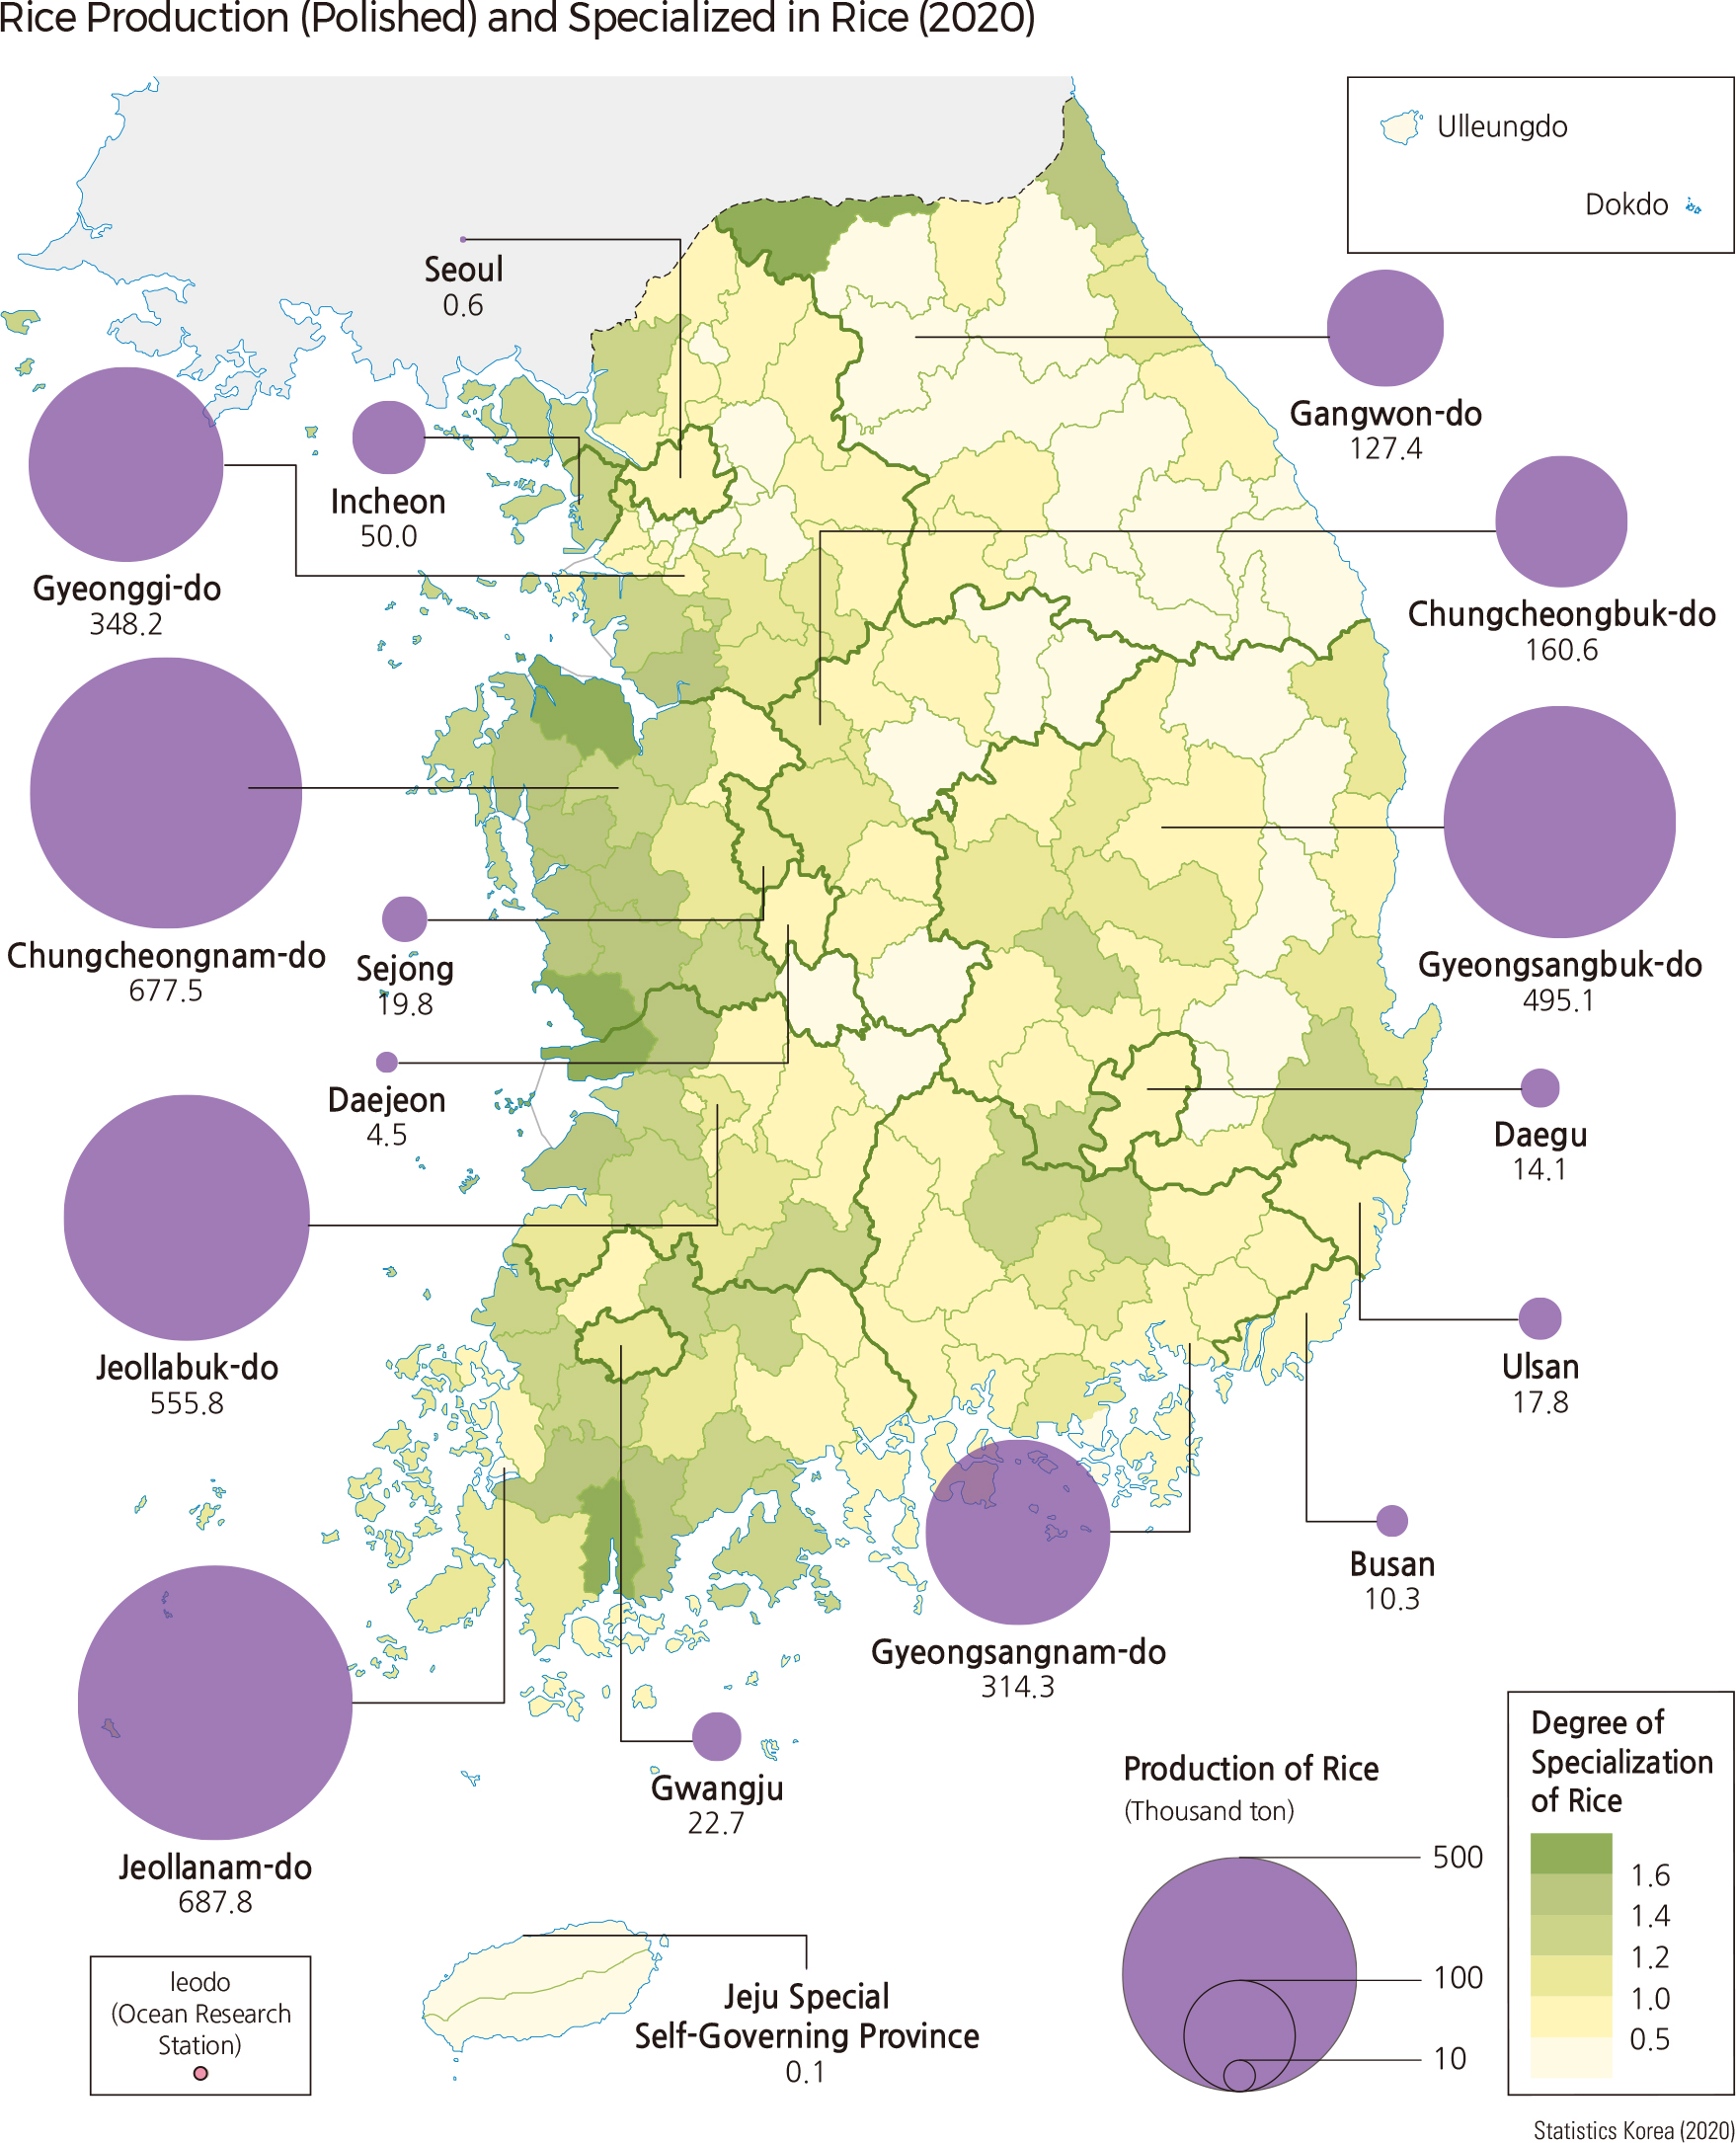
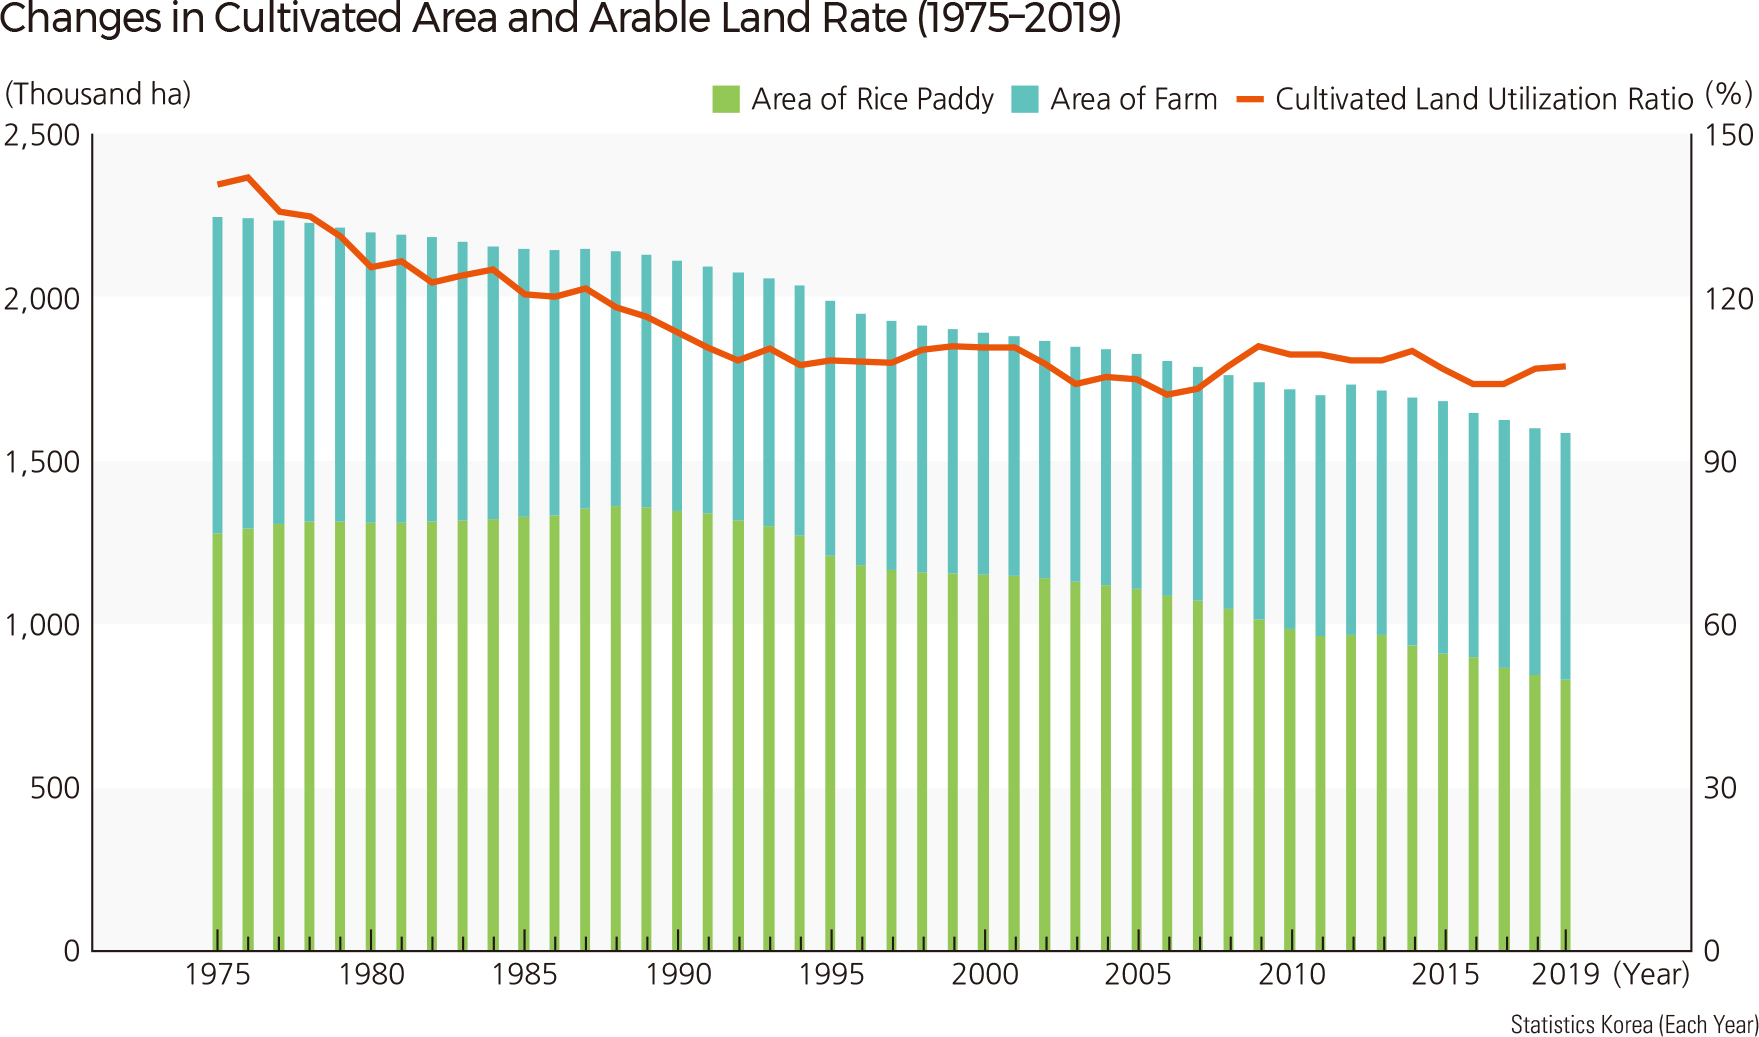
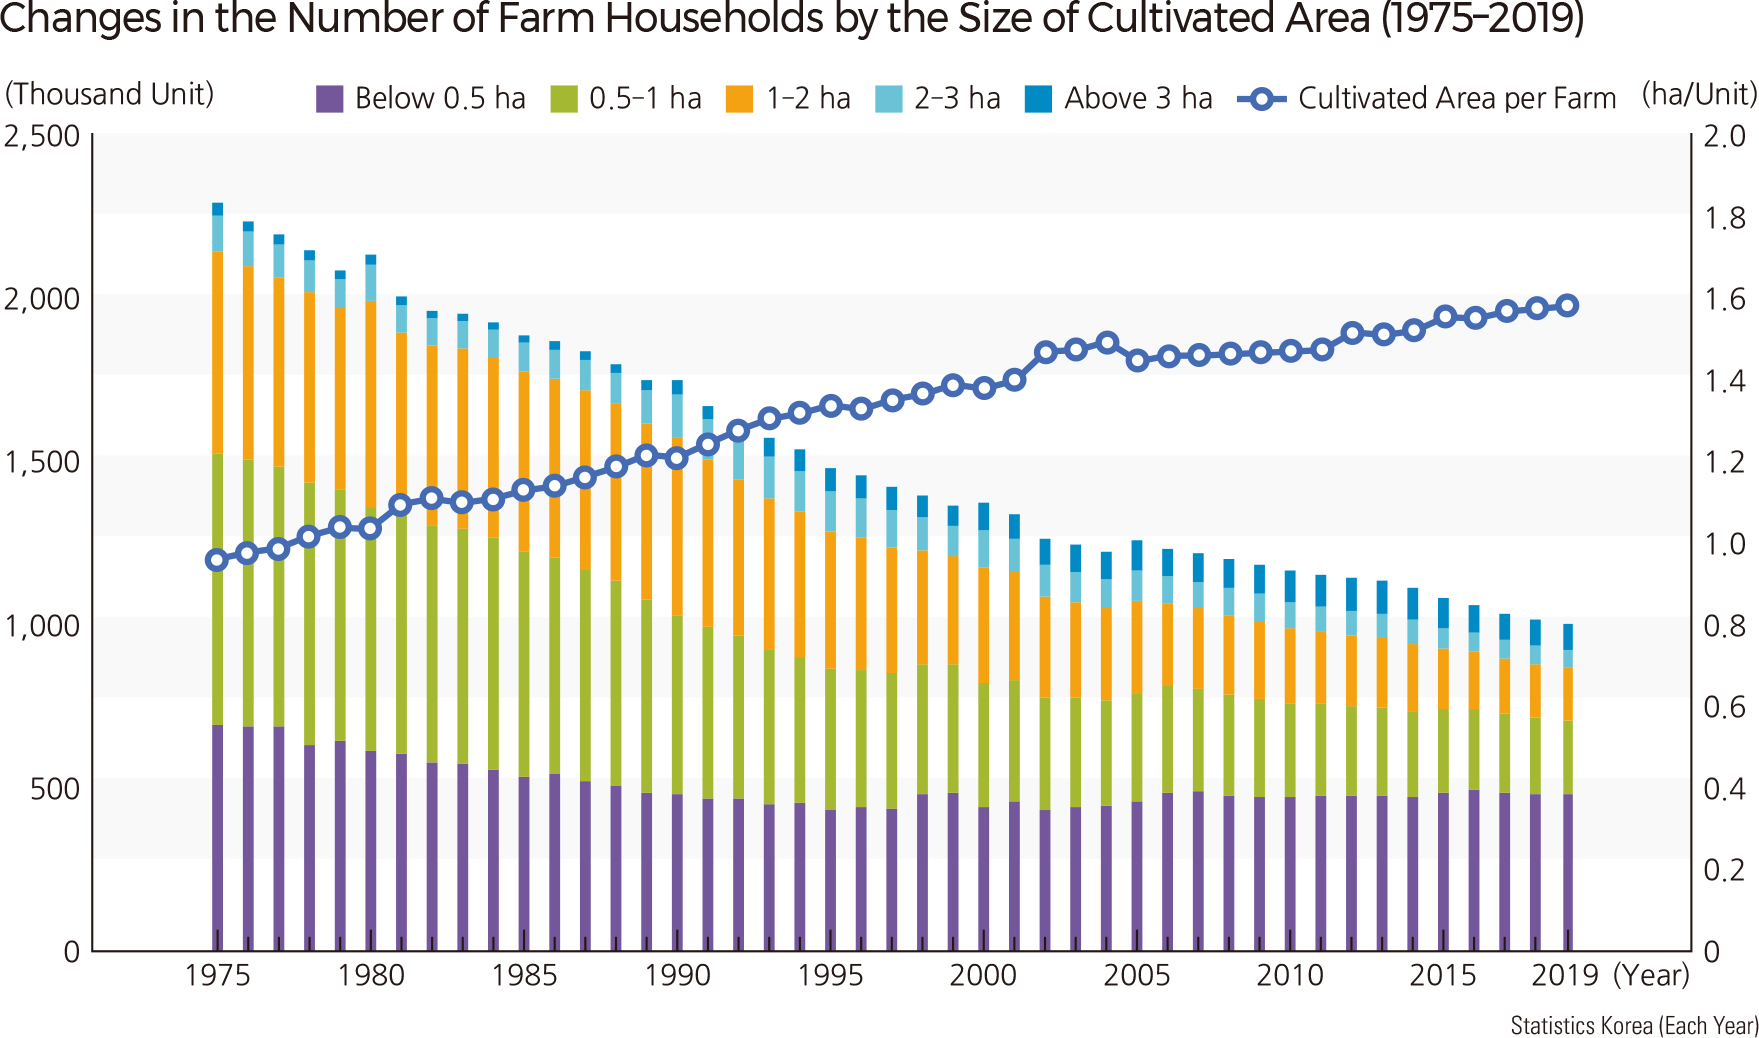
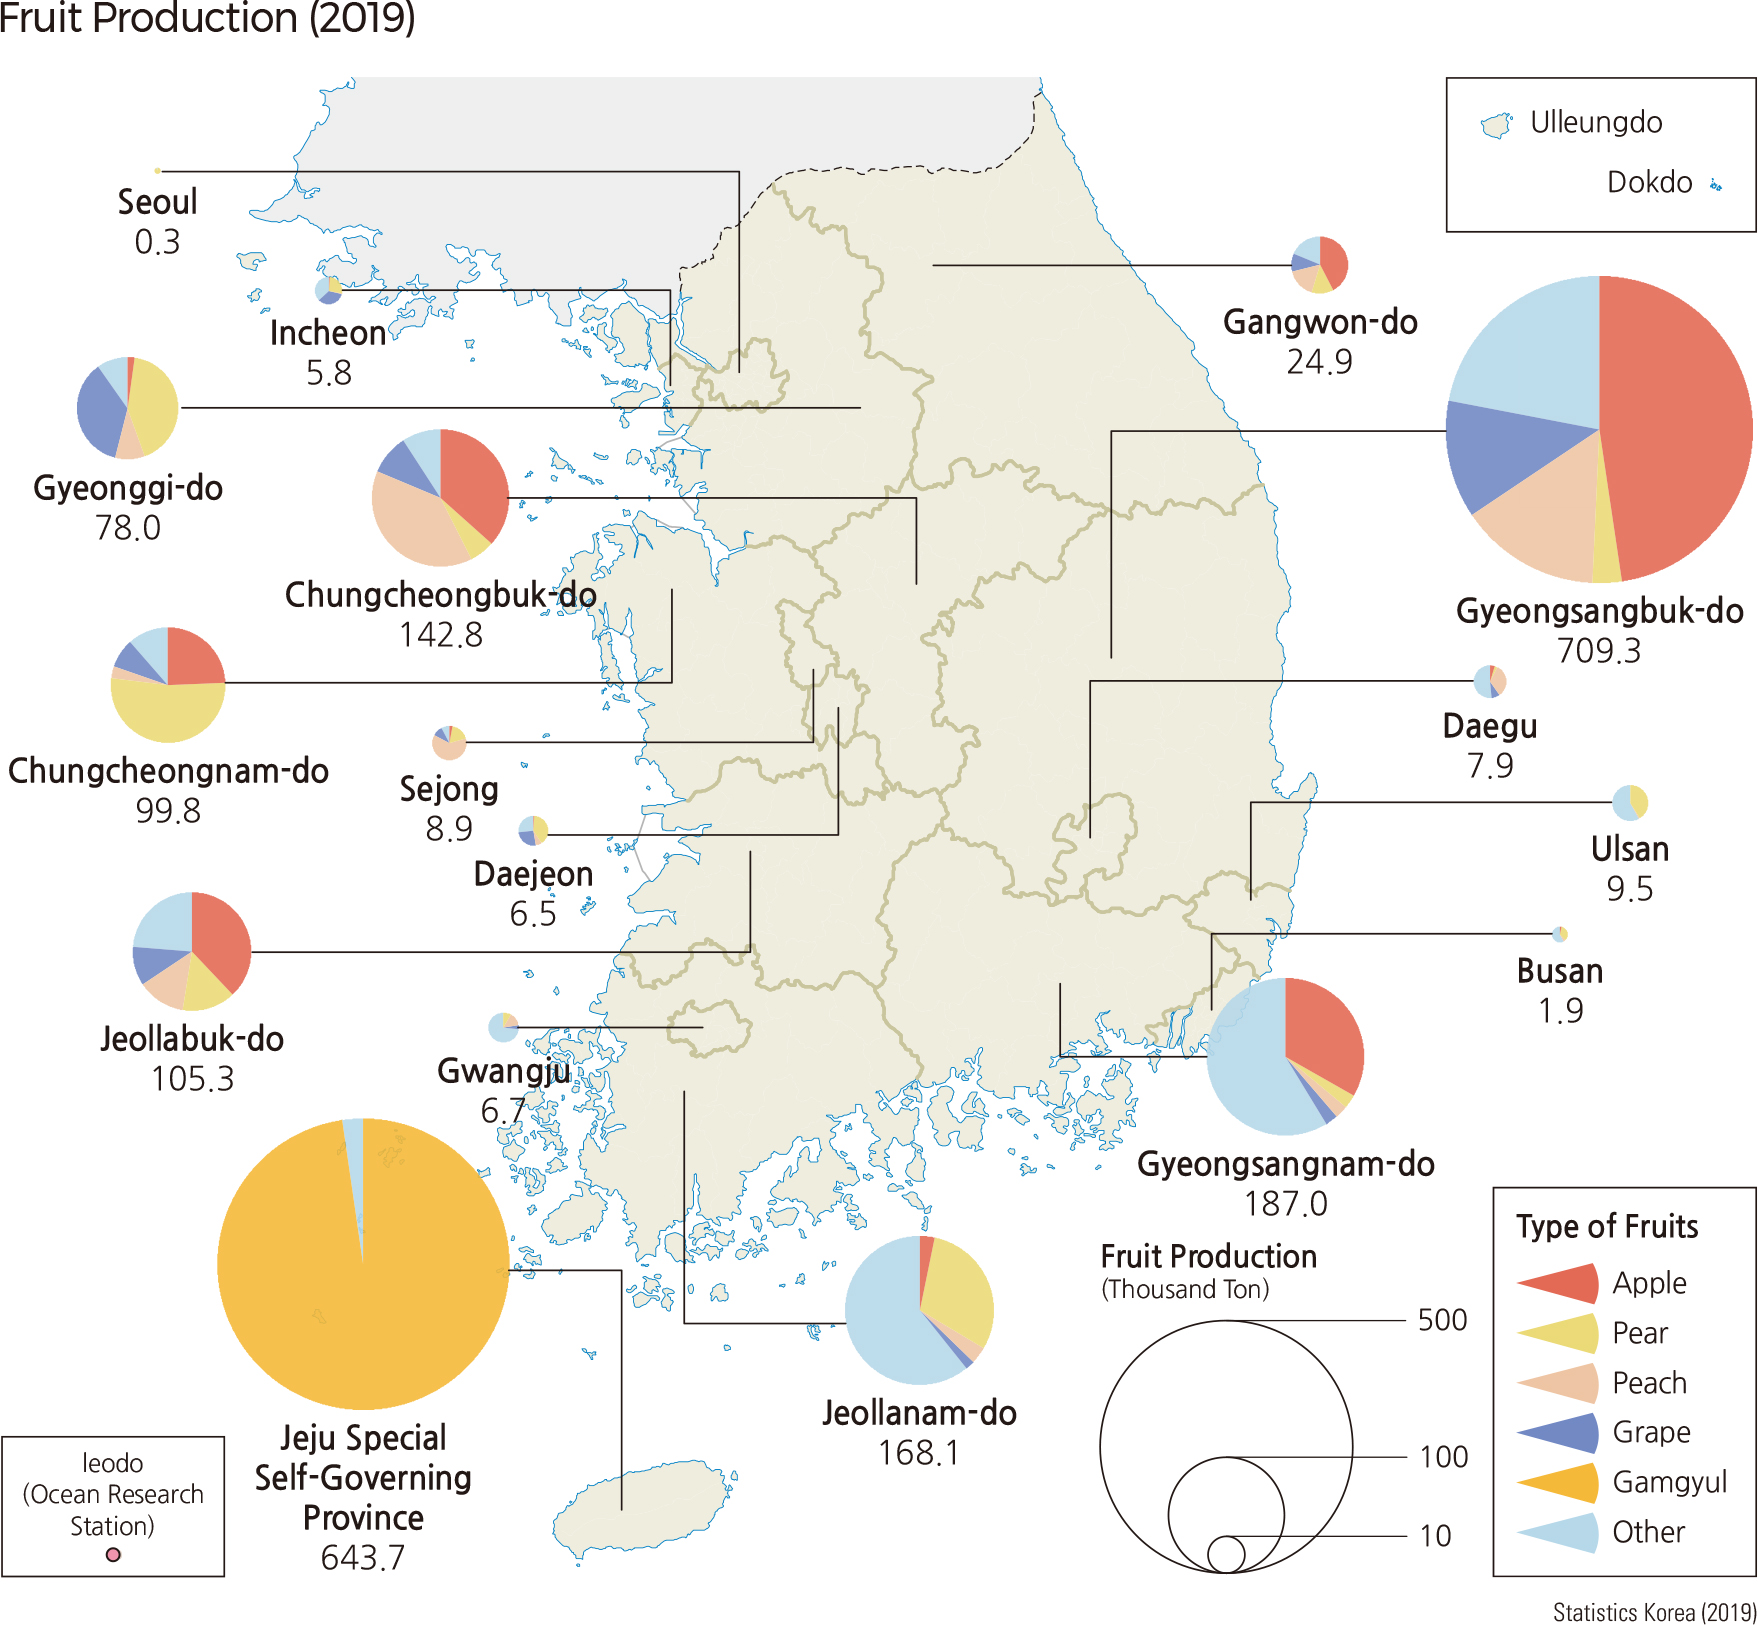
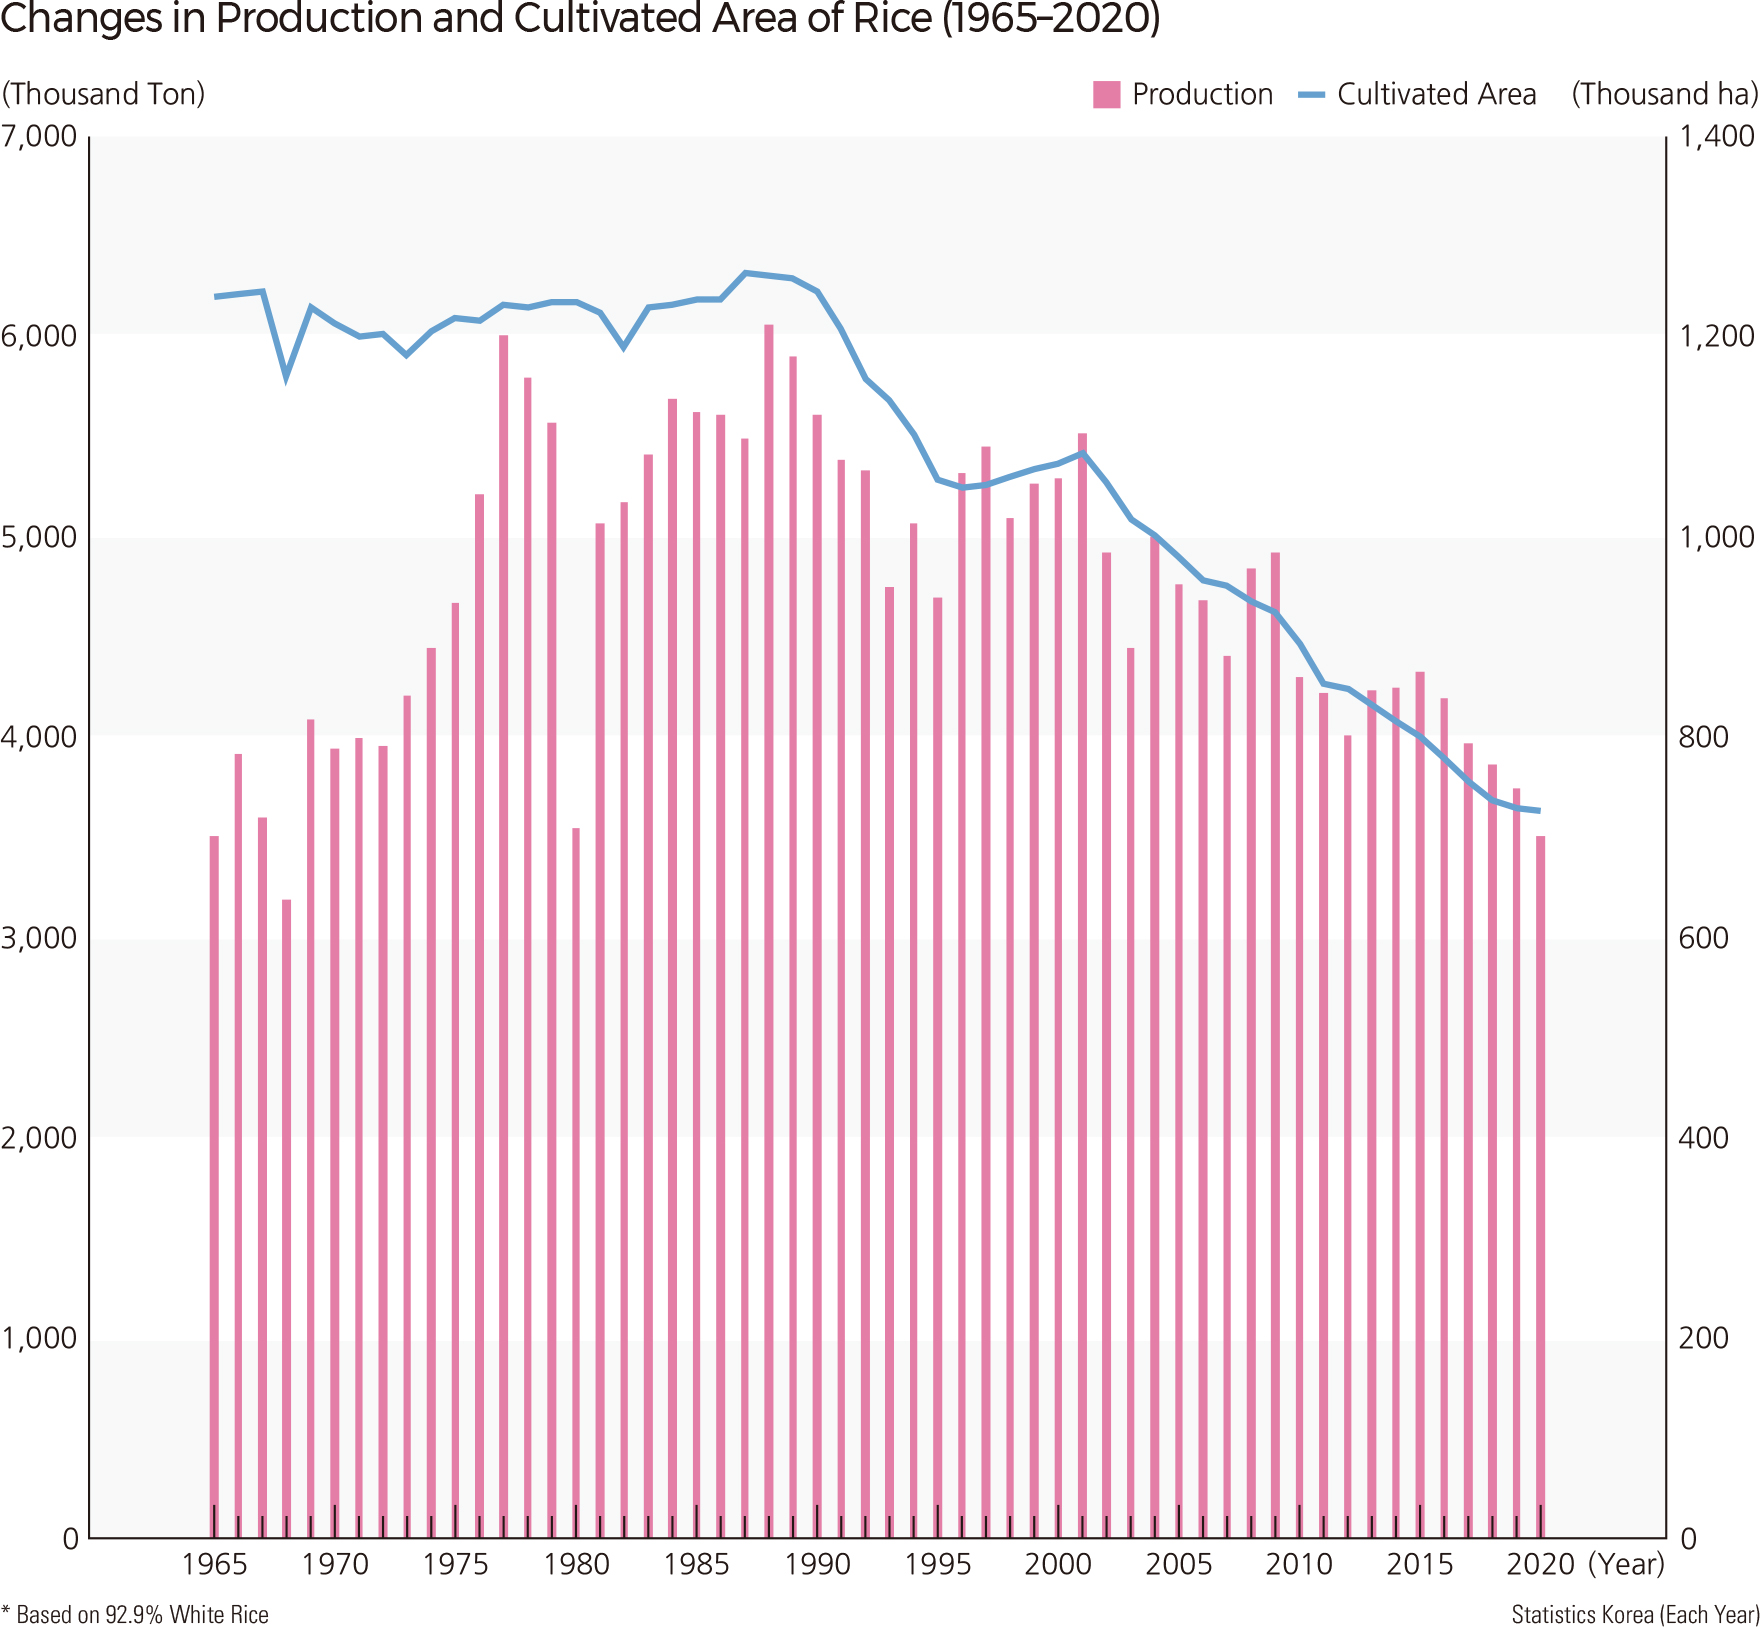
The maps of the cultivated area and arable land rate in 2020 show the current situation of agricultural production by region. According to the rice cultivated area in 2020, Jeollanam-do showed the highest area with 168,387 hectares, followed by Chungcheongnam-do with 145,103 hectares, and Jeollabuk-do with 123,638 hectares. According to the cultivated area of a dry field in 2020, Gyeongsangbuk-do showed the highest area with 139,387 hectares, followed by Jeollanam-do with 118,009 hectares, and Gyeonggi-do with 73,909 hectares. As of 2020, the arable land rate was the highest in Gimje-si (48.0%), followed by Iksan-si (45.0%) and Muan-gun (44.2%). The arable land rate appears high in plain areas such as Jeollanam-do, Jeollabuk-do, Chungcheongnam-do, and Gyeonggi-do. The type of agricultural production is subdivided into open-field production and greenhouse production. The open-field production contains various crops, such as grains, including rice, barley, and wheat, vegetables, orchards, specialty and medicinal crops, and other crops. There are regional differences in the cultivated land area by crop types. For example, in 2020, the cultivated land area of paddy rice was the highest in Jeollanam-do (156,230 hectares), followed by Chungcheongnam-do (131,284 hectares) and Jeollabuk-do (110,880 hectares). The cultivated land area of orchards in 2020 was the highest in Gyeongsangbuk-do (53,006 hectares), followed by Jeju-do (16,677 hectares) and Jeollanam-do (16,487 hectares). The cultivated land area of greenhouses was the highest in Gyeongsangnam-do (13,100 hectares), followed by Gyeonggi-do (12,887 hectares) and Chungcheongnam-do (11,139 hectares). The cultivated land area was decreased 0.8% annually from 1975 to 2019. The cultivated land area in 2019 was 1.58 million hectares, which is a decrease of roughly 660,000 hectares (-29.4%) compared to 1975. Rice field area decreased faster than dry field area as rice field area decreased by about 450,000 hectares (-35%) and dry field area decreased by about 210,000 hectares (-22%) during the same period. The arable land rate dropped from 140.4% in 1975 to 107.2% in 2019. In contrast, the cultivated land area per farm household rose 0.94 to 1.57 from 1975 to 2019, reflecting the growth of agriculture. In this regard, the government has implemented various policies such as fostering agricultural labor force, the enlargement of farm size, improving the production facility, the farm mechanization, and the facility modernization to enhance the competitiveness of agriculture since the early 1990s. The increase in cultivated land area per farm household, in particular, represents achieving an economy of scale which allows for lower production costs and increased price competitiveness. The number of farm households with less than 0.5 hectares of cultivated area decreased from 690,983 households in 1975 to 212,458 households in 2019, whereas the number of farm households with over 3.0 hectares of the cultivated area increased from 35,982 households in 1975 to 77,164 households in 2019. For the same period, the size of the cultivated area per household had increased through these changes. However, the cultivated land area per farm household is still not large compared to other countries. Rather, considering that the proportions of small-sized farm households (with less than 0.5 hectares of cultivated area) in the total farm households is gradually increasing due to the sharp shrinking of the number of farm households, the effect of economies of scale does not seem to be significant. The changes in agricultural production were identified with a focus on the cultivated crop. Above all, the rice production volume and the rice-specialized areas, a major crop in Korea, were mapped as shown. In 2020, the rice production volume was the highest in Jeollanam-do (687,812 tons), followed by Chungcheongnam-do (677,533 tons), Jeollabuk-do (555,774 tons). Among the metropolitan cities, Incheon (50,006 tons) recorded the highest rice production. Rice production volume in Jeju-do was the lowest due to its volcanic soil. The specialization quotients (SQ) were calculated to identify the degree of regional specialization for some crops. The SQ of rice is measured as rice’s proportion of a regional total for a cultivated area divided by rice’s proportion of the national total for a cultivated area. For example, the SQ of over 1.0 region means that the region has a higher concentration of rice than the nation. The rice production volume peaked in 1988 and has been declining since then. However, due to the recent increase in the production volume per cultivated area, the decreasing trend is slowing down. The production volume of rice in 1988 was about 6.05 million tons, whereas its production volume was about 3.51 million tons in 2020. The rice cultivated area peaked in 1987 (about 1.26 million hectares), has declined ever since, and has decreased sharply since 2001. As a result, the area of rice cultivation was no more than about 730,000 hectares in 2020. The regional production volumes of barley and wheat, vegetables, orchards, specialty and medicinal crops, and major open-field crops in Korea, were mapped as shown. After harvesting rice, the area that cultivates barley and wheat is unevenly distributed. In 2020, Jeollanam-do, Jeollabuk-do, and Gyeongsangnam-do accounted for over 90% of the total production of barley and wheat. Vegetables recorded the highest production among the open-field crops. The vegetable production was the highest in Jeollanam-do (about 1.85 million tons), followed by Gyeongsangbuk-do (about 1.07 million tons) and Gyeongsangnam-do (about 1.05 million tons). Among fruits, apples, peaches, and grapes are produced mostly in Gyeongsangbuk-do, pears in Chungcheongnam-do, and tangerines in Jeju-do. Regarding the production of specialty and medicinal crops, Gyeongsangbuk-do produced the highest volume (about 69,000 tons), followed by Chungcheongnam-do (about 43,000 tons) and Gyeonggi-do (about 42,000 tons). The changes in the agricultural production by major crops from 1980 to 2019 reveal that the production of food crops decreased, while the production of cash crops, such as vegetables and fruits, increased. In 1980, vegetables were the most produced in the open fields, followed by rice, other food crops, orchards, and the vegetables produced in the greenhouse. In 2019, the vegetables produced in the open fields were the most produced, followed by rice, the vegetables produced in the greenhouse, fruits, and barley and wheat. |