English III 2021
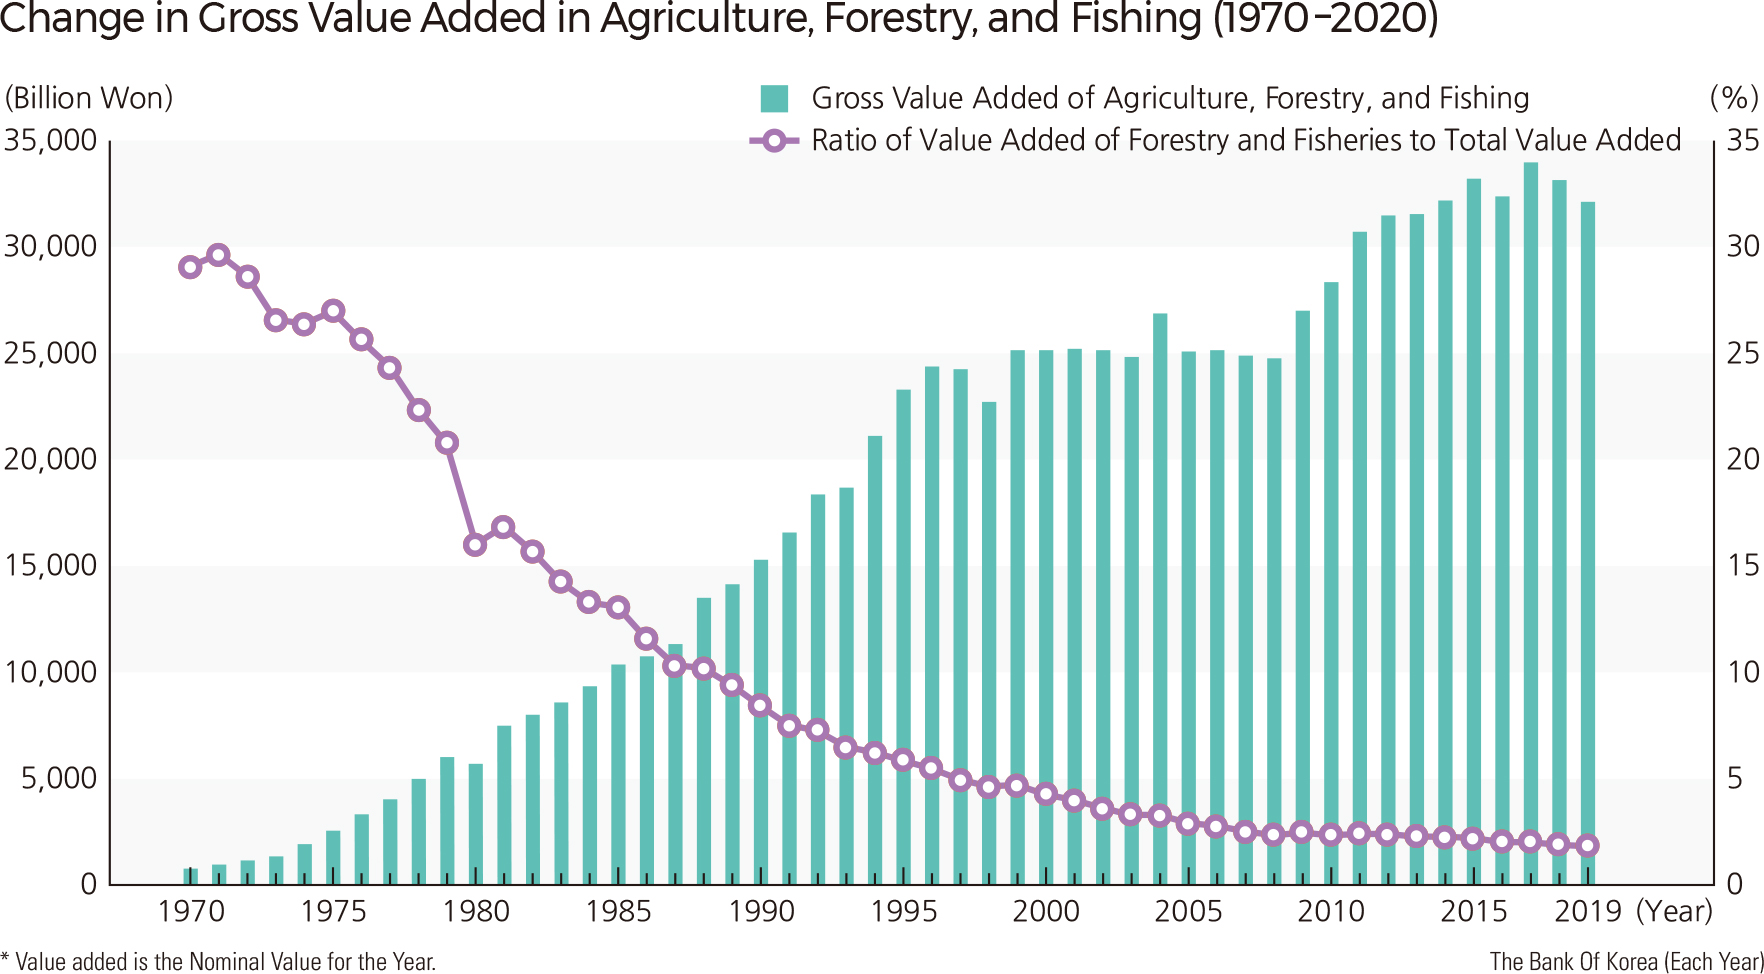
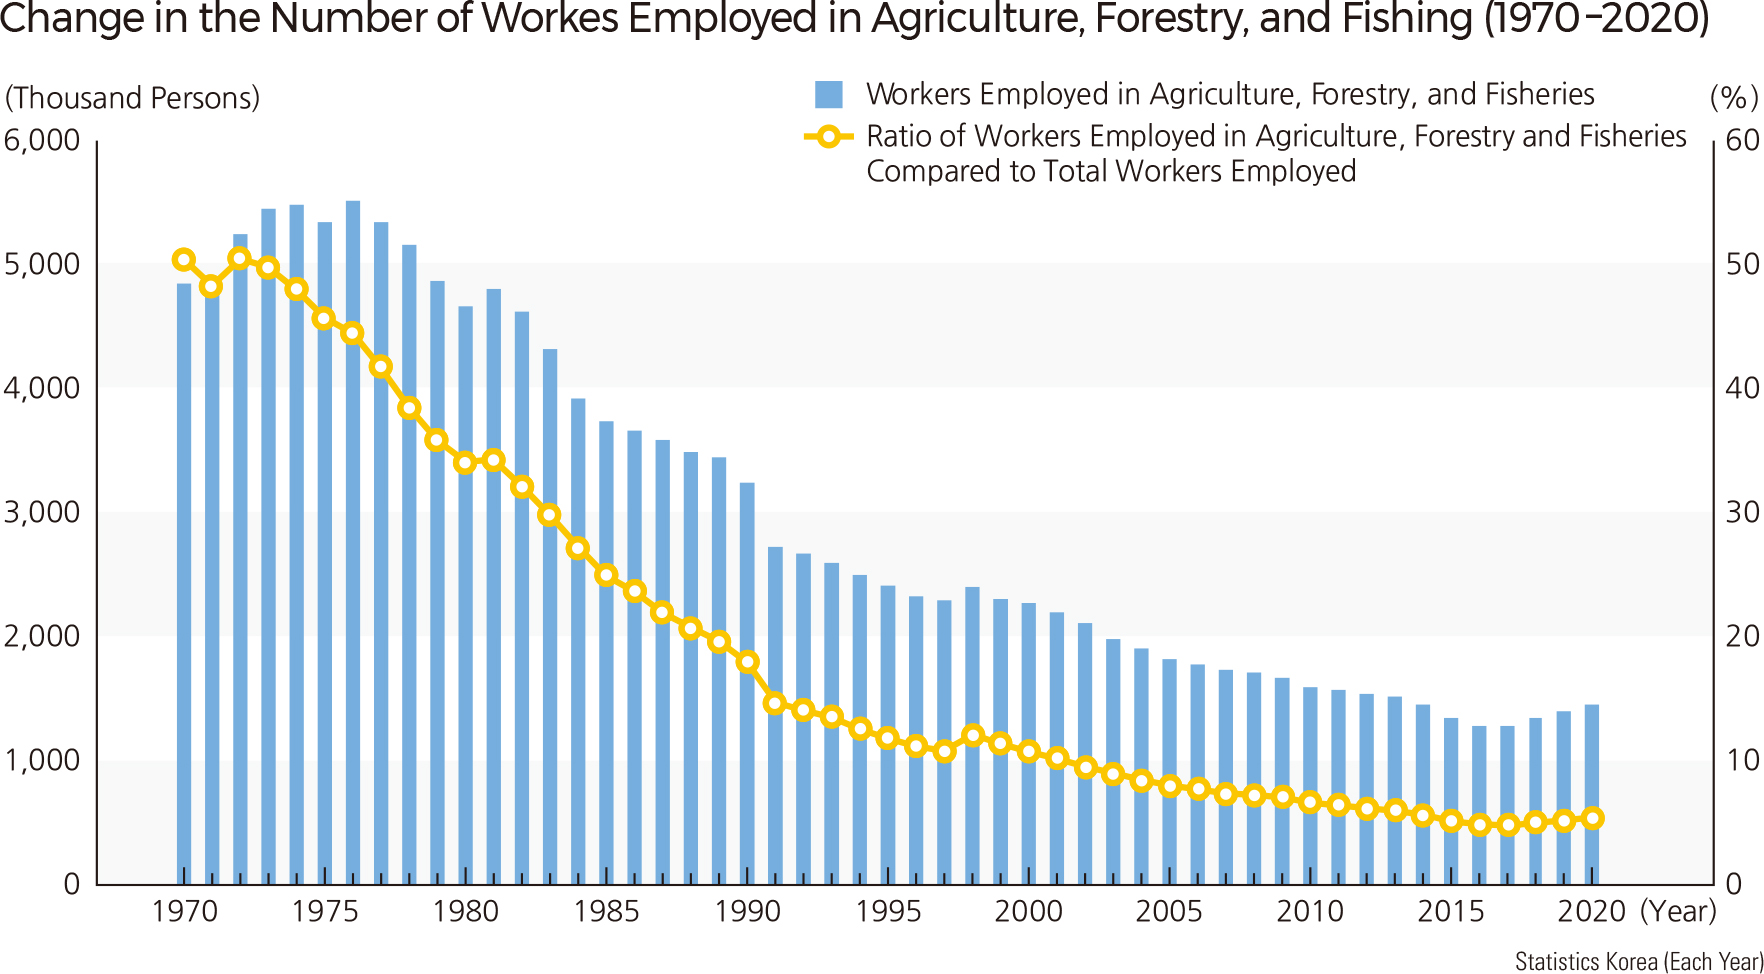
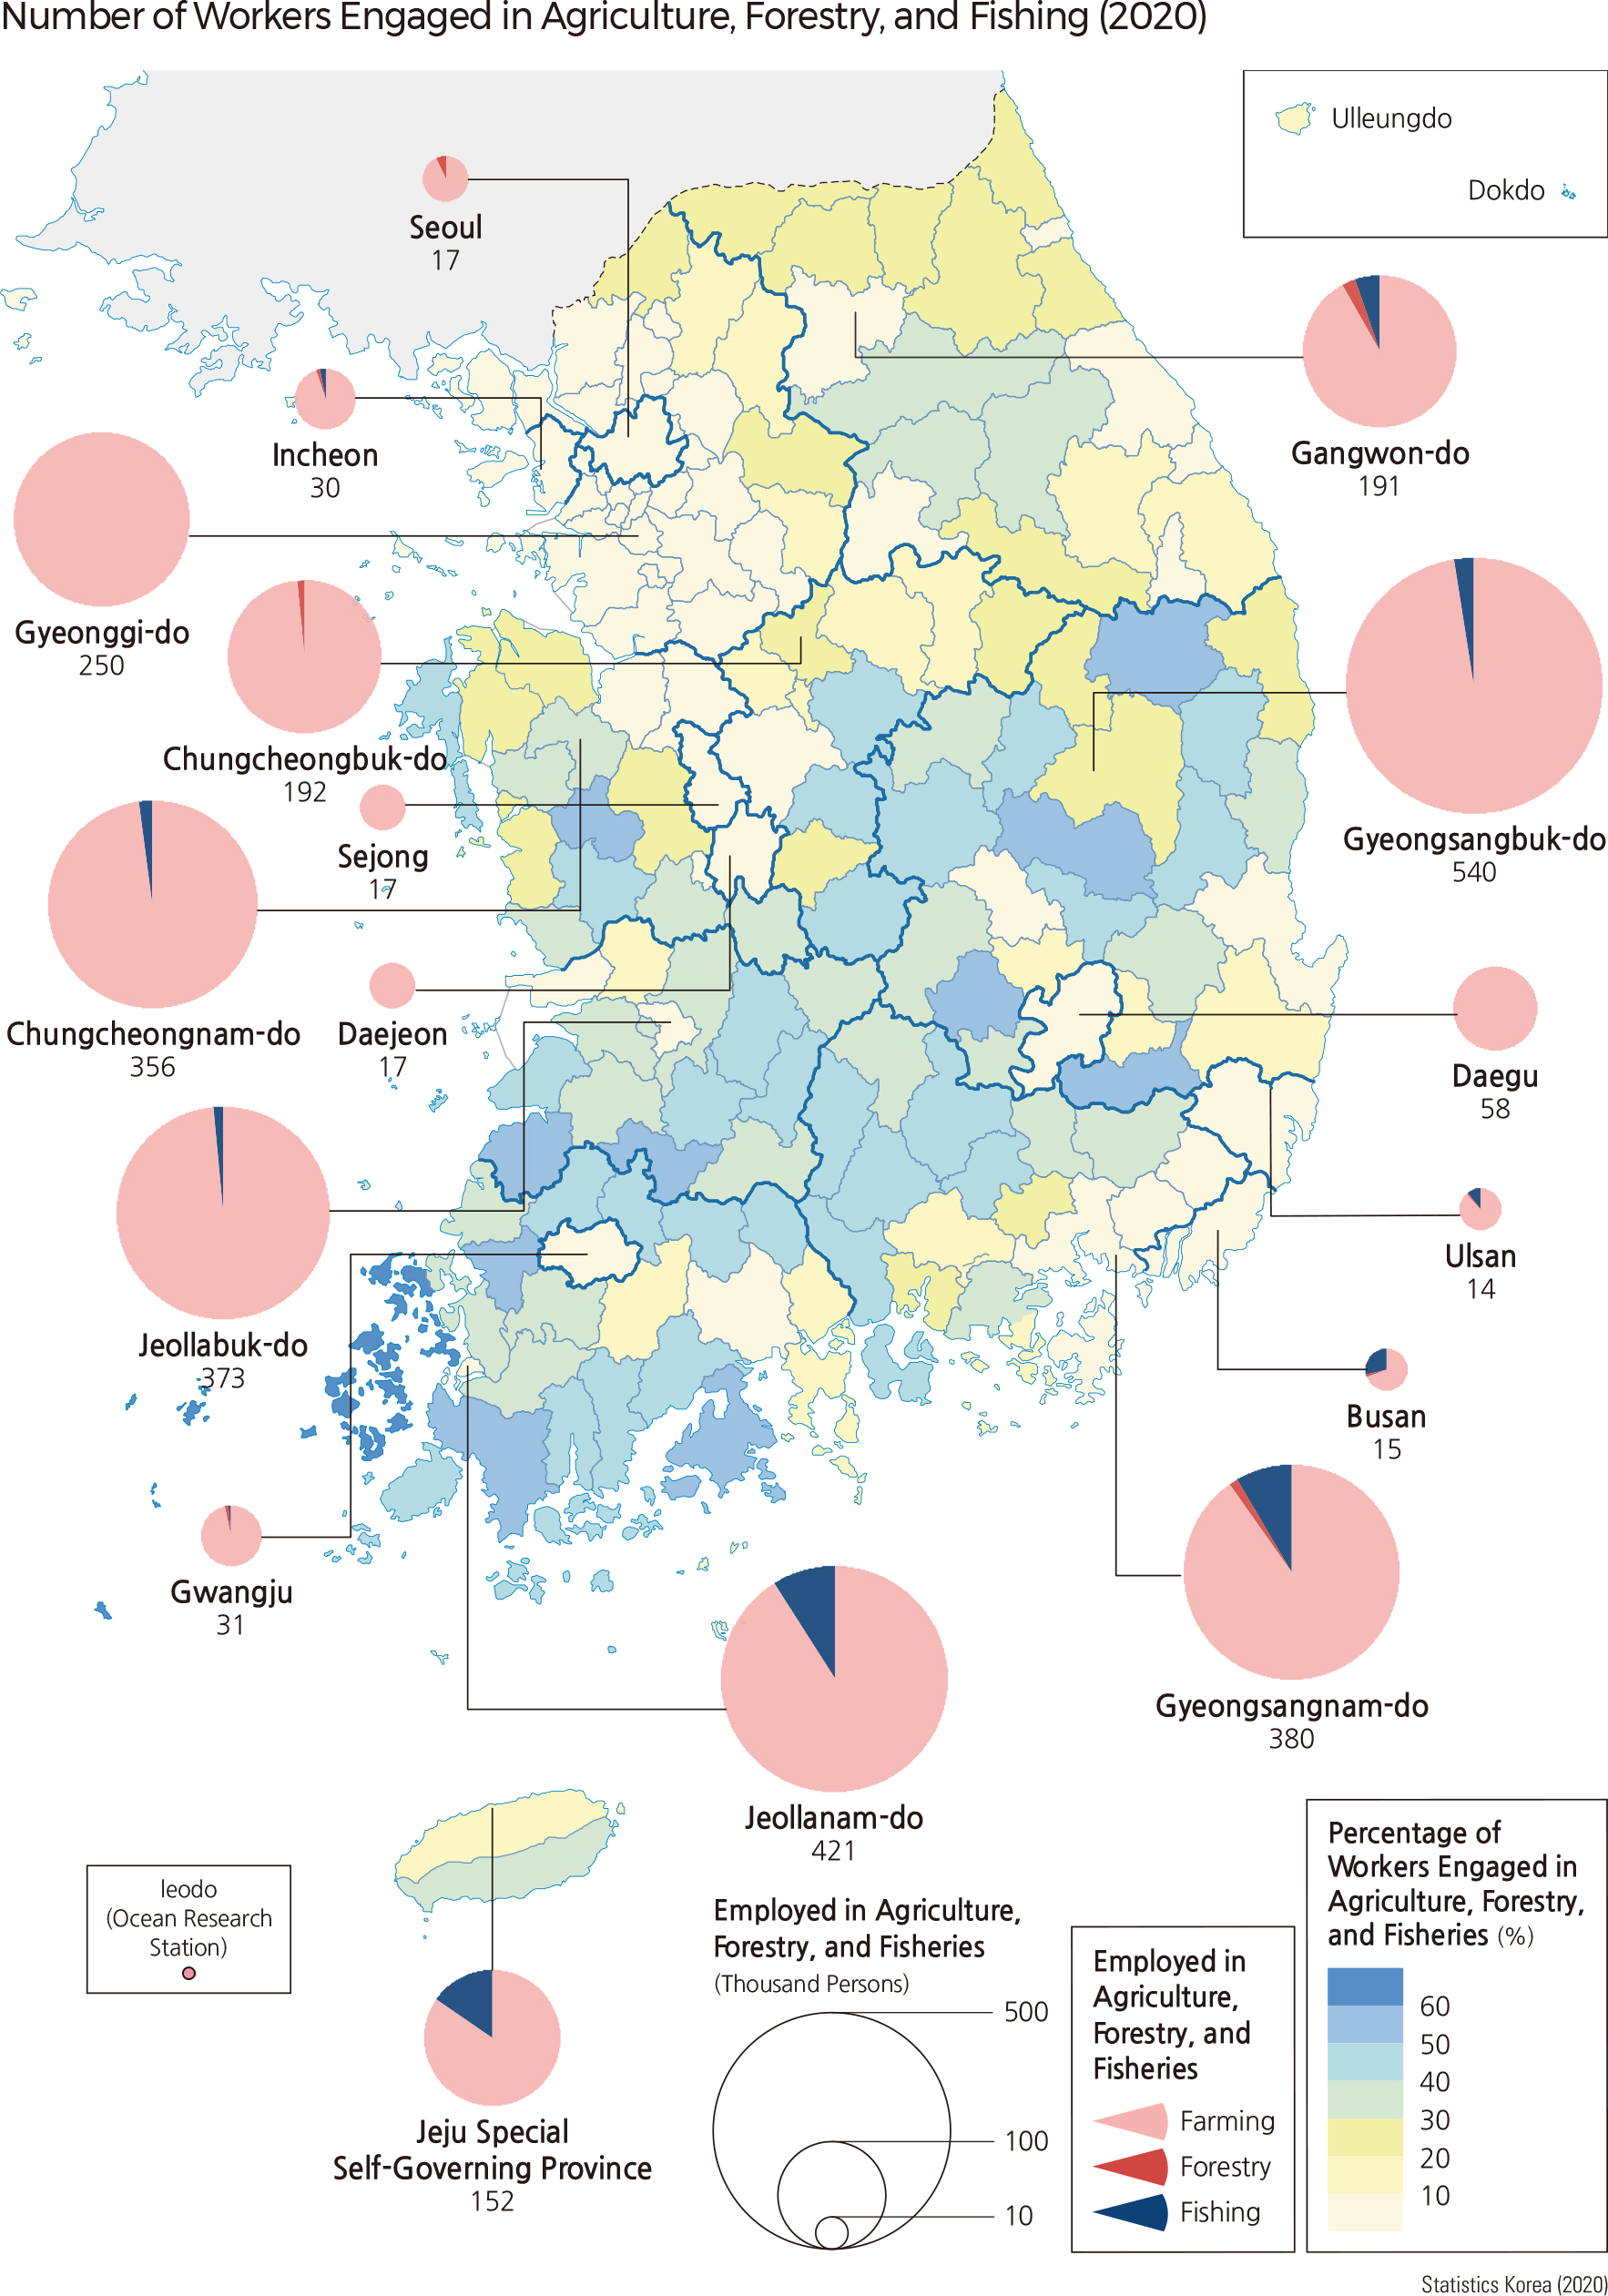
The proportion of agriculture, forestry, fishing, and mining in the national economy has dramatically declined since full-fledged industrialization began. The gross value added in the agriculture, forestry, and fishing sectors stayed below 5 trillion won until the late 1970s and reached about 30 trillion won in the 2010s. On the other hand, the proportion of the gross value added in the agriculture, forestry, and fishing sectors to the total industry fell dramatically from about 29% in 1970 to roughly 2.4% in 2010, and its proportion has gradually decreased. The number of workers employed in the agriculture, forestry, and fishing sectors went down dramatically from about 4.85 million people in 1970 to about 1.45 million people in 2020. The proportion of the number of workers employed in the agriculture, forestry, and fishing sectors to the total number of workers decreased from about 50% to about 5.4% for the same period. But it deserves some attention that the number of workers employed in the same industry continued to be increased slightly from 2017 to 2020. These changes are linked to growth in the number of young to middle-aged adults engaged in the agriculture, forestry, and fishing sectors, as well as migrant farmers, migrant fishermen, and urban-to-rural migrants. Also, the agriculture, forestry, and fishing sectors have been able to grow into a new untact industry amid the crisis of the COVID-19 pandemic. There are regional differences in the gross value added and the number of workers in the agriculture, forestry, and fishing sectors. According to the gross value added in the agriculture, forestry, and fishing sector in 2018, Gyeongsangbuk-do showed the highest size with about 55 trillion won, followed by Jeollanam-do with about 52 trillion won, Chungcheongnam-do with about 41 trillion won, and Gyeongsangnam-do with about 40 trillion won. And, according to the regional proportion of gross value added in the agriculture, forestry, and fishing sector in 2018, Jeju-do showed the highest proportion with about 9.9%, followed by Jeollanam-do with about 7.9%, Jeollabuk-do with about 7.7%, and Gyeongsangbuk-do with about 5.4%. In addition, according to the number of workers employed in the agriculture, forestry, and fishing sectors in 2020, Gyeongsangbuk-do, Gangwon-do, and Jeollanam-do showed the highest number of workers in the agriculture, forestry, and fishing sectors, respectively.
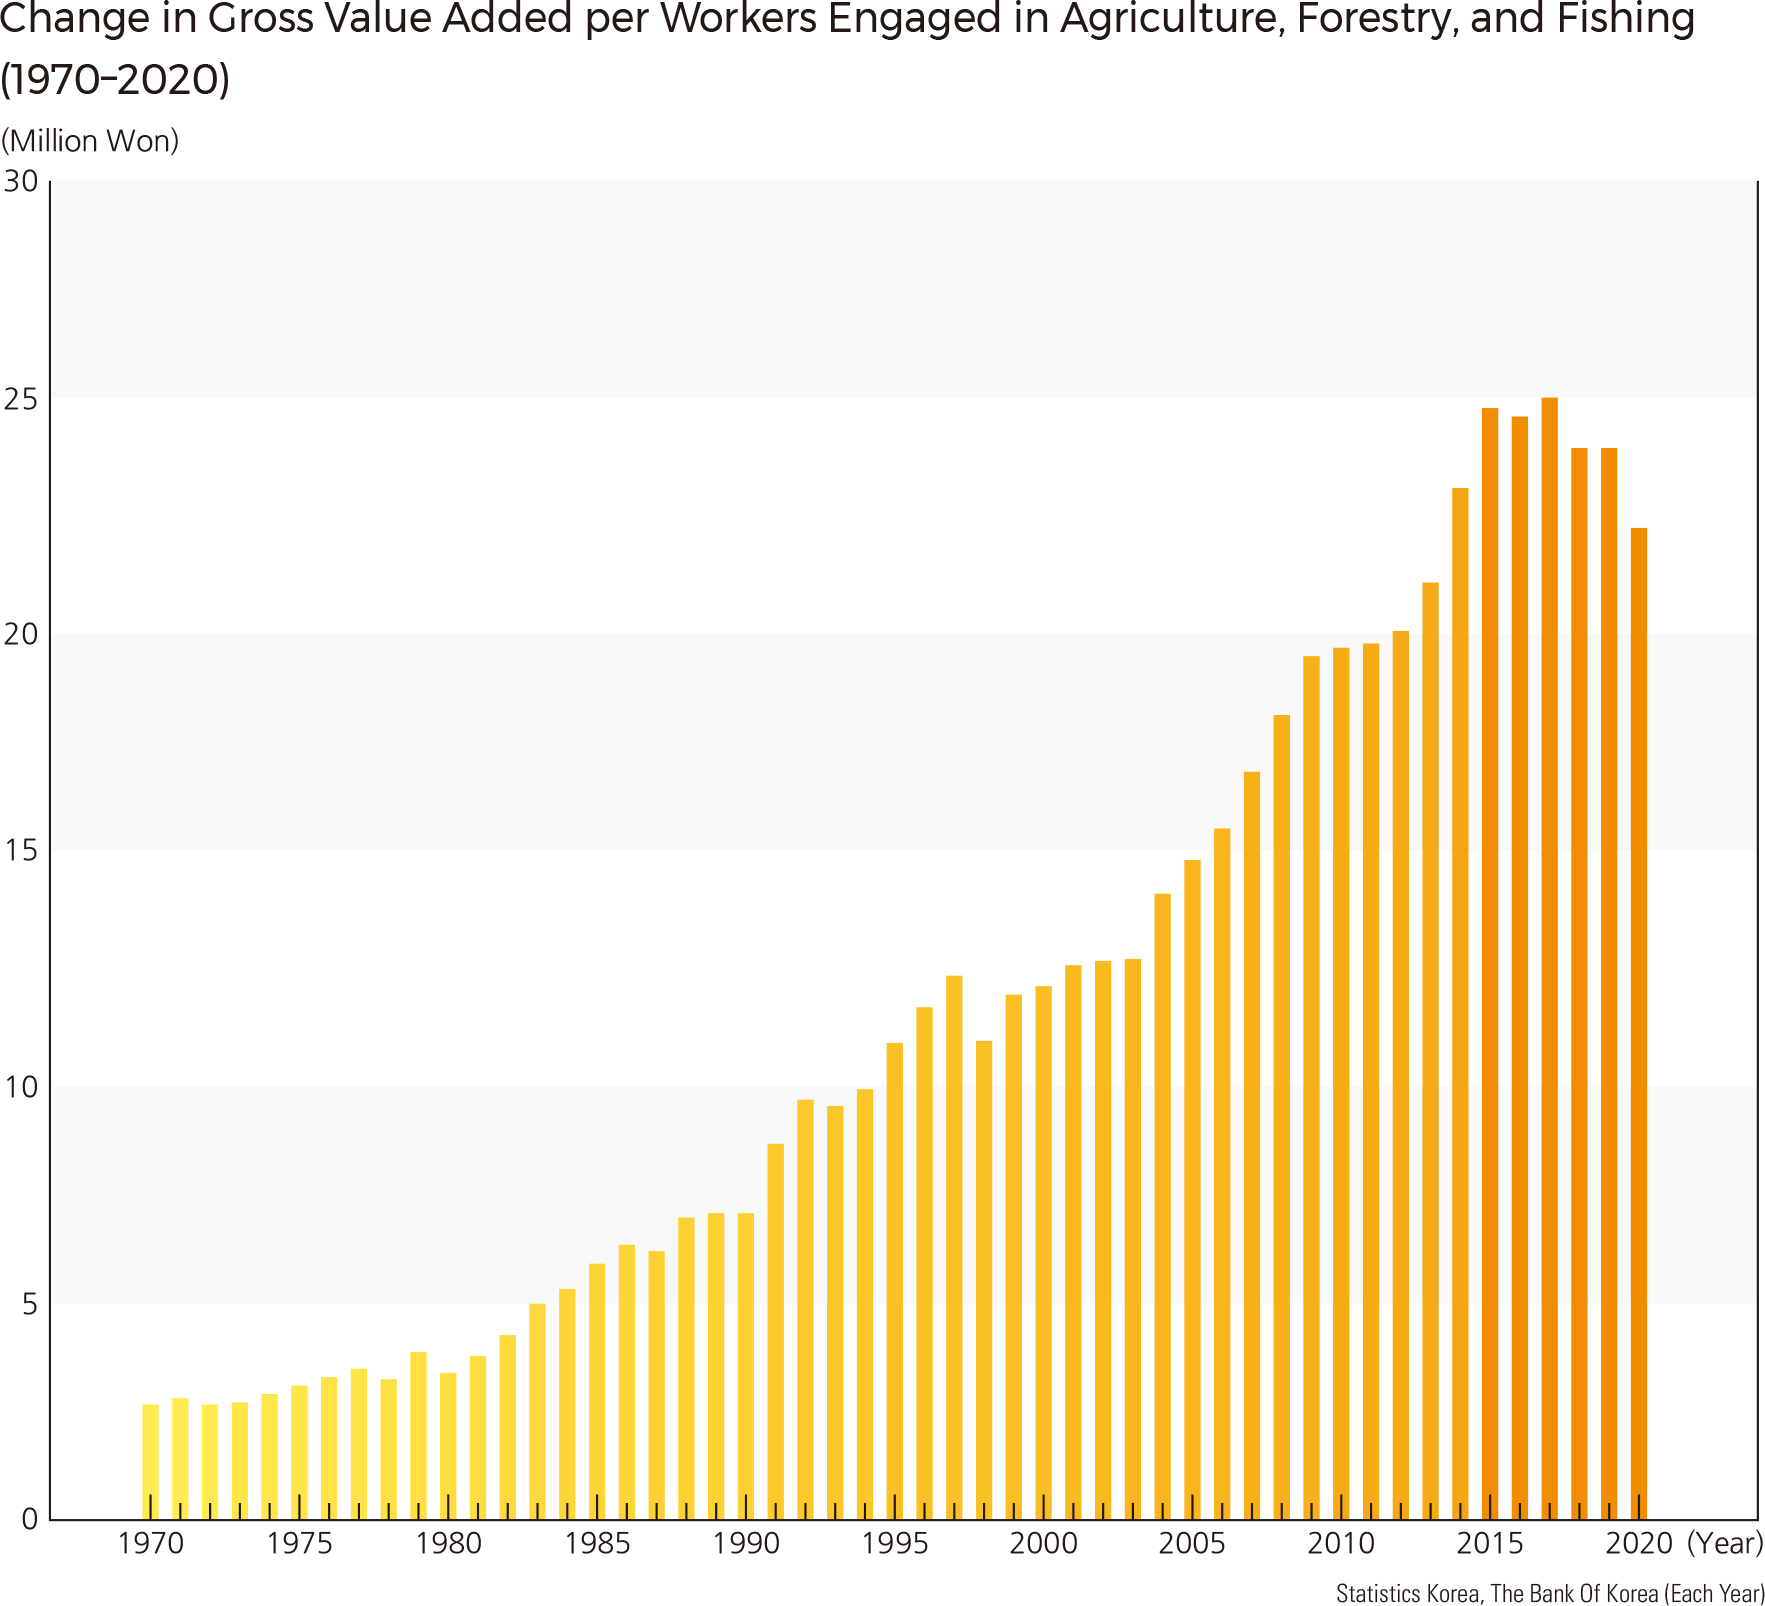
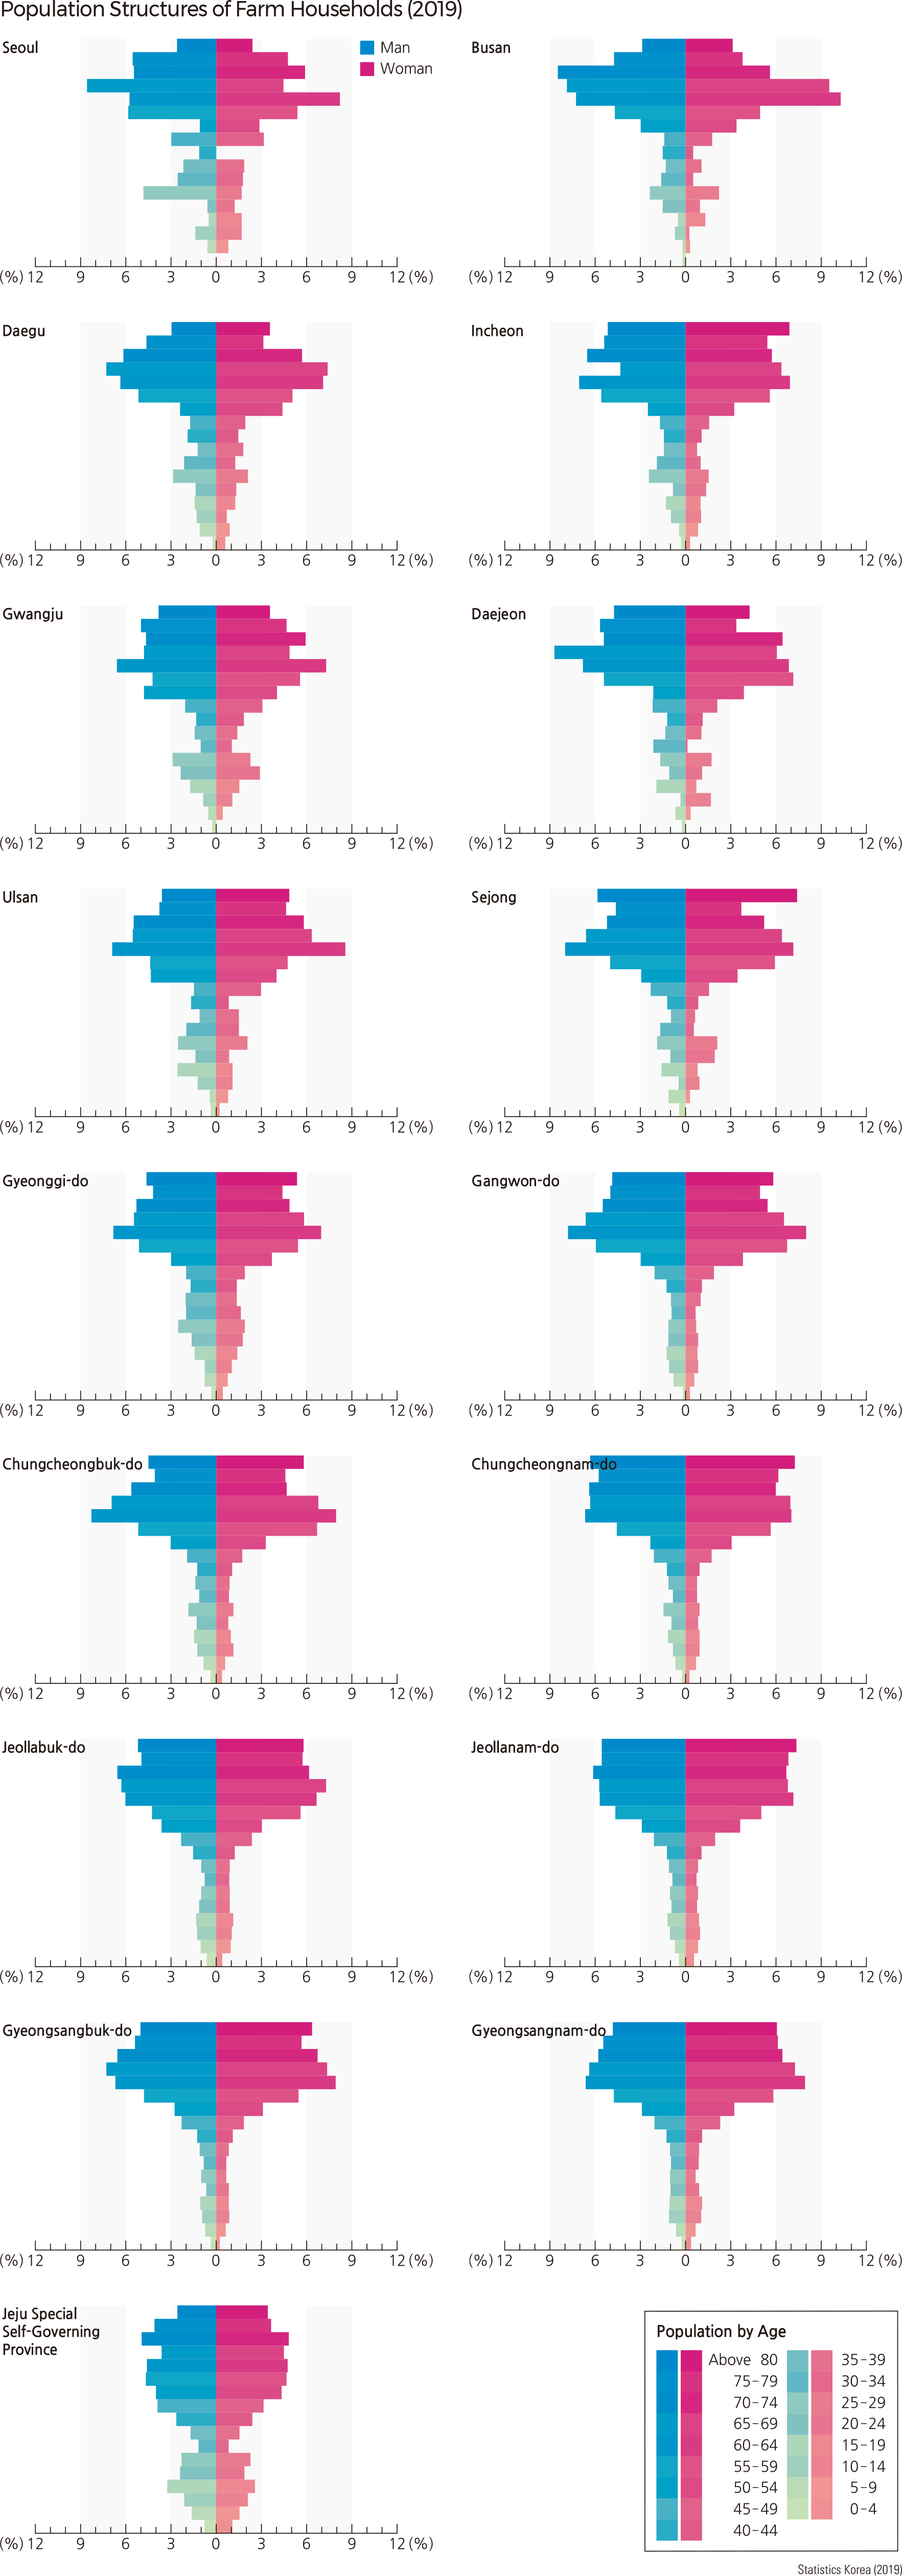
From 1970 to 2020, the gross value added per worker engaged in the agriculture, forestry, and fishing sectors had increased. For example, its gross value added per worker reached about 22 million won in 2020, while its gross value added per worker was about 2.56 million won in 1970. The increase in the gross value added per worker is due to increased agricultural productivity. In 2019, the population structures of farm households by region showed that persons aged 65 years or over outnumbered other age groups. A mushroom-shaped population structure of farm households reflects that farm households are aging rapidly. However, there are regional differences in the population structures of farm households. For example, the proportion of farm households in the ages of 10s and 20s is relatively high in Jeju-do, partially because of the influx of young adults and middle-aged people. From 2010 to 2019, the population in the agriculture, forestry, and fishing sectors was aging rapidly. The proportion of the population aged 65 years or over in the agriculture, forestry, and fishing sectors increased from about 31% in 2010 to about 46% in 2019.
|