English III 2021
The population growth can be explained by the natural population growth of birth and death and the social population growth of in-migration and out-migration. In Korea, a natural decrease in the population with more deaths than births is relatively recent. At the provincial level, natural population decrease was first recorded in Jeollanam-do in 2005. As of 2020, populations naturally decrease in all provinces except for Gyeonggi-do, Incheon, Ulsan, and Sejong. Therefore, an important factor in determining the increase or decrease of a region's population is population migration. Population migration has begun in earnest through industrialization. In 1975, the migration rate reached 25.5%, and in 1988, 9.97 million people migrated. However, since the late 1980s, the total migrants and migration rates have decreased. As of 2020, the proportions of intraregional migration within -si/-gun/-gu areas, intraregional migration between -si/-gun/-gu areas, and interregional migration were 38%, 29%, and 33%, respectively. Until the late 1980s, the Seoul Metropolitan Area was the main in-migration region, while the Honam, Yeongnam, and Chungcheong regions were the main out-migration regions. However, there have been changes since the late 1980s. Seoul has become the region with the largest population outflow to Gyeonggi and Incheon. On the other hand, the Chungcheong region has become an influx of population since the mid-1990s, which is related to the expansion of the Seoul Metropolitan Area's functions into the Chungcheong region. International migrations can be divided into the immigrants and emigrants of Koreans and the immigrants and emigrants of foreigners. In the case of Koreans, there were more emigrants than immigrants until the mid-2000s. However, the number of immigrants and emigrants remained similar until 2019. In the case of foreigners, from 2000 to 2019, there were generally more immigrants than emigrants. However, the international migration patterns in 2020 completely differ from those before 2019. Due to the impact of COVID-19, there were more Korean immigrants than Korean emigrants, and there were more foreign emigrants than foreign immigrants.
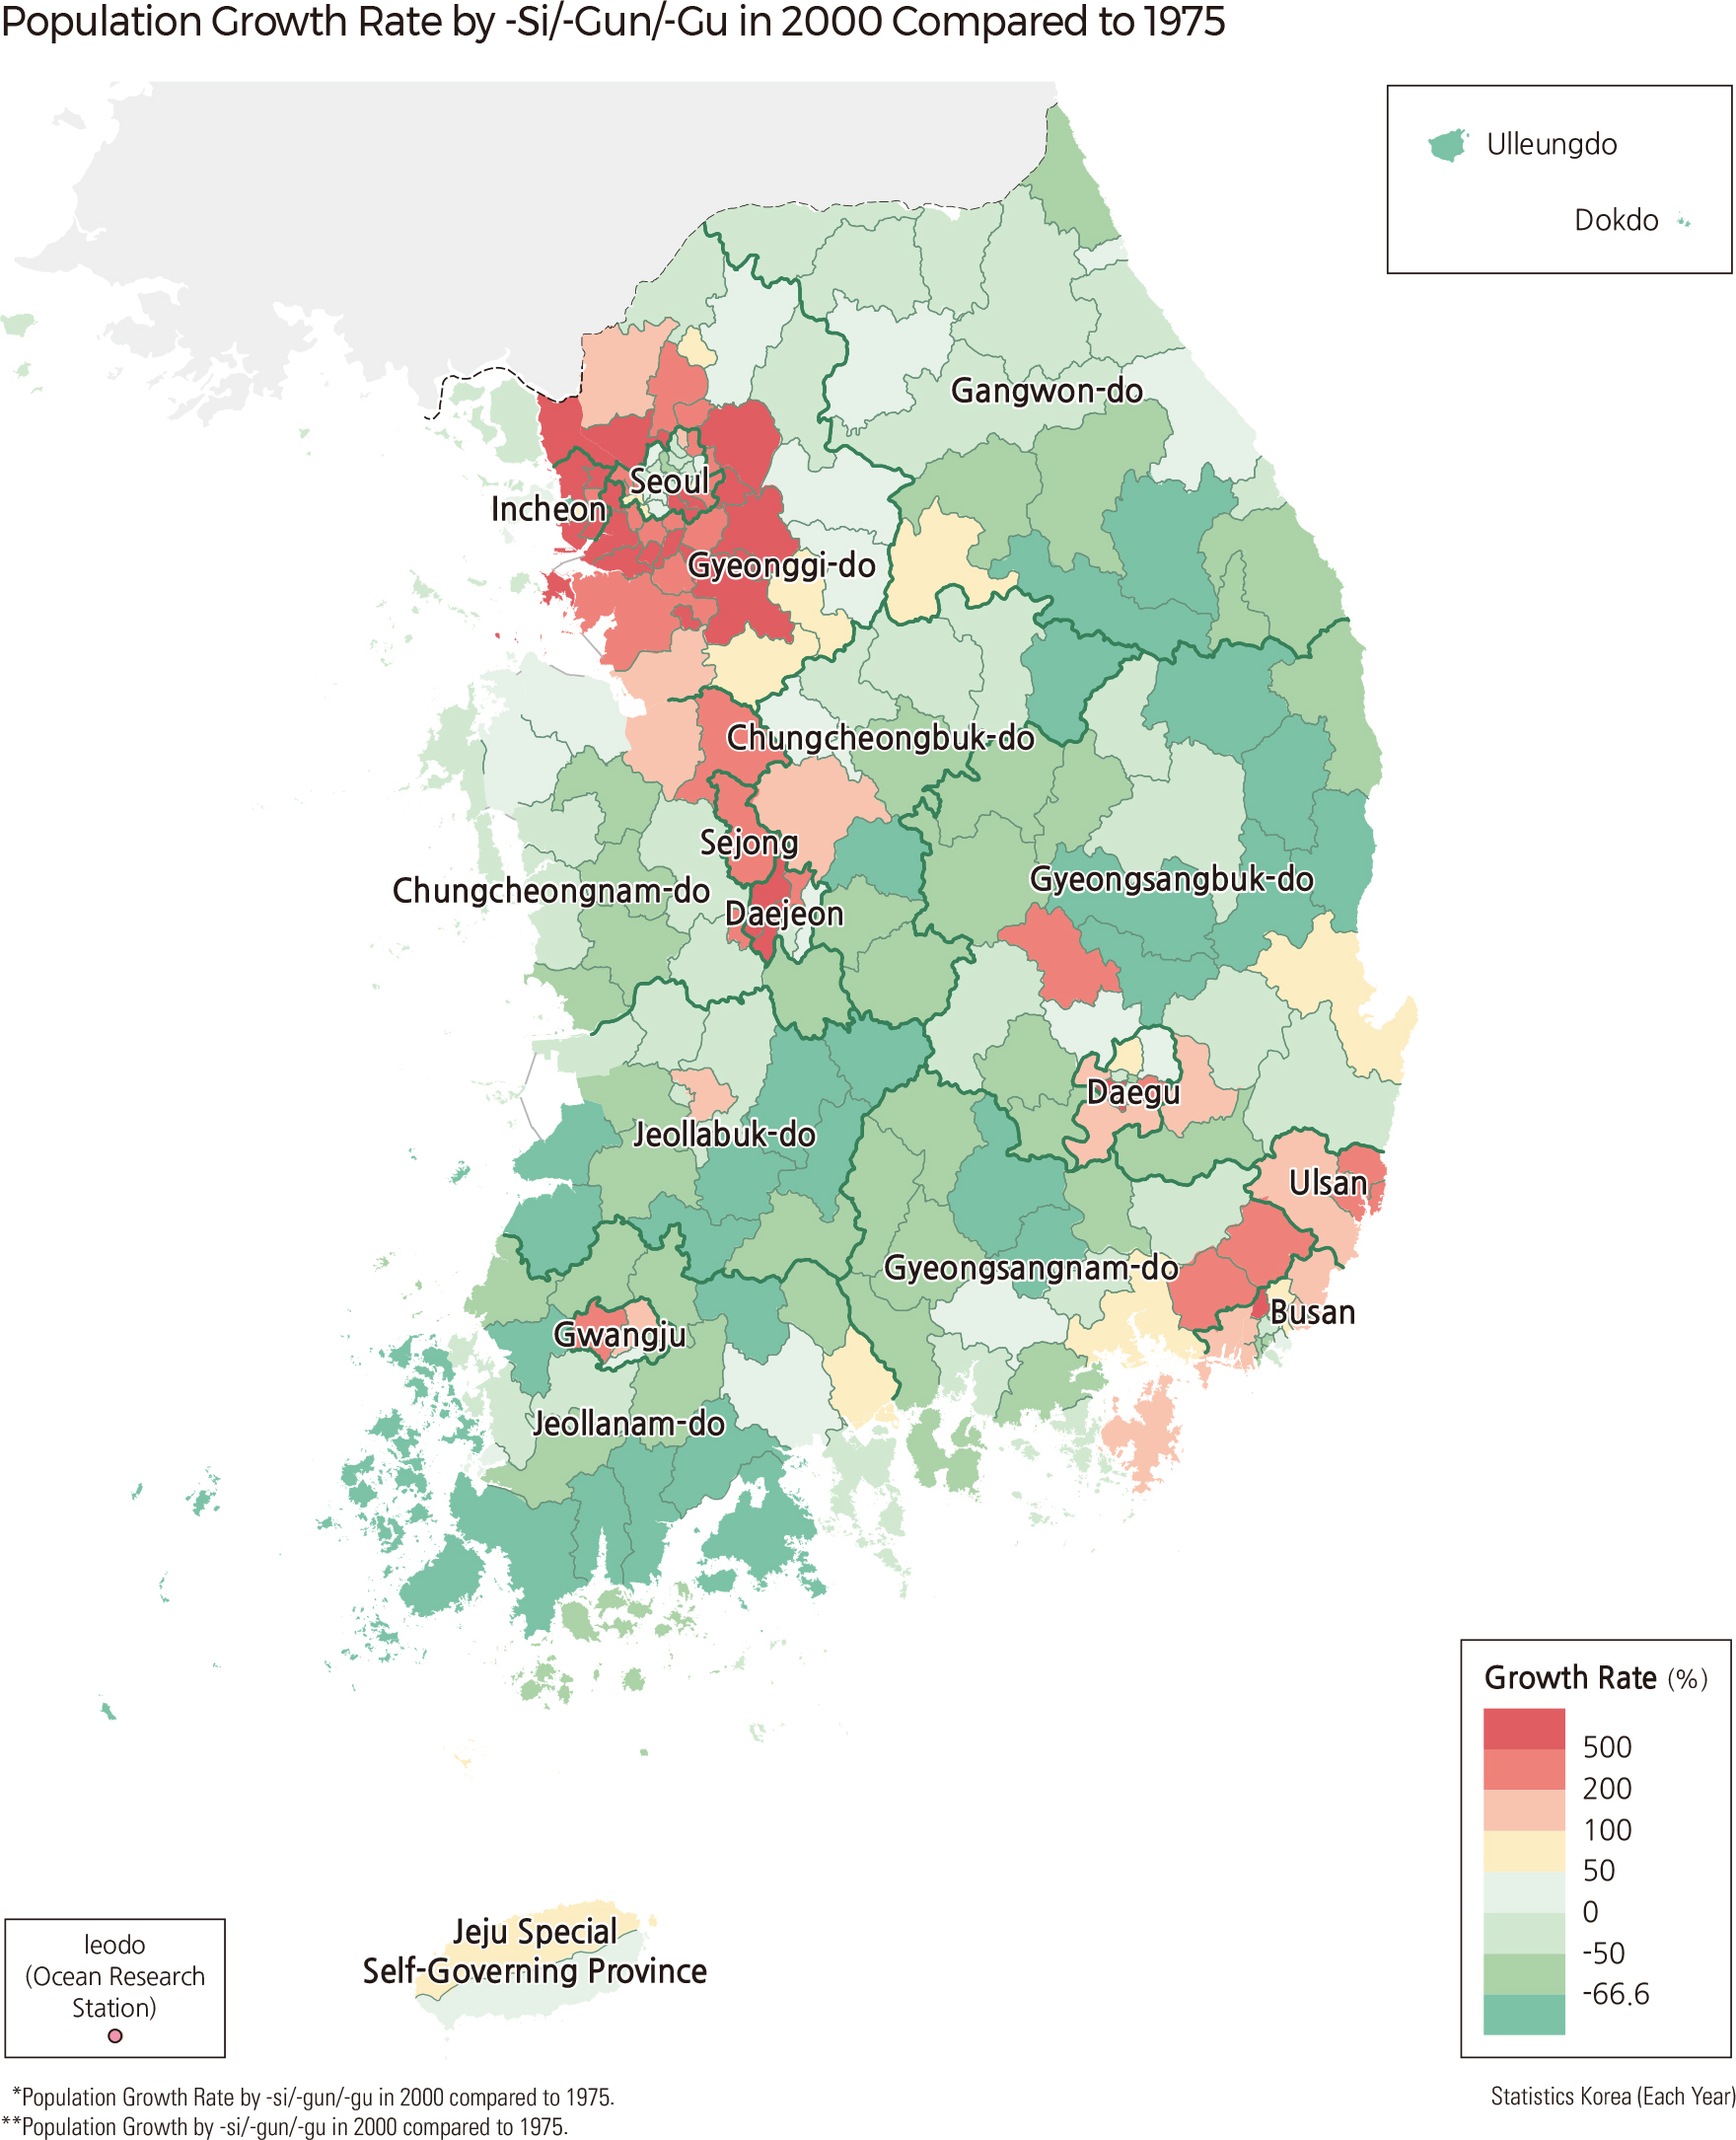
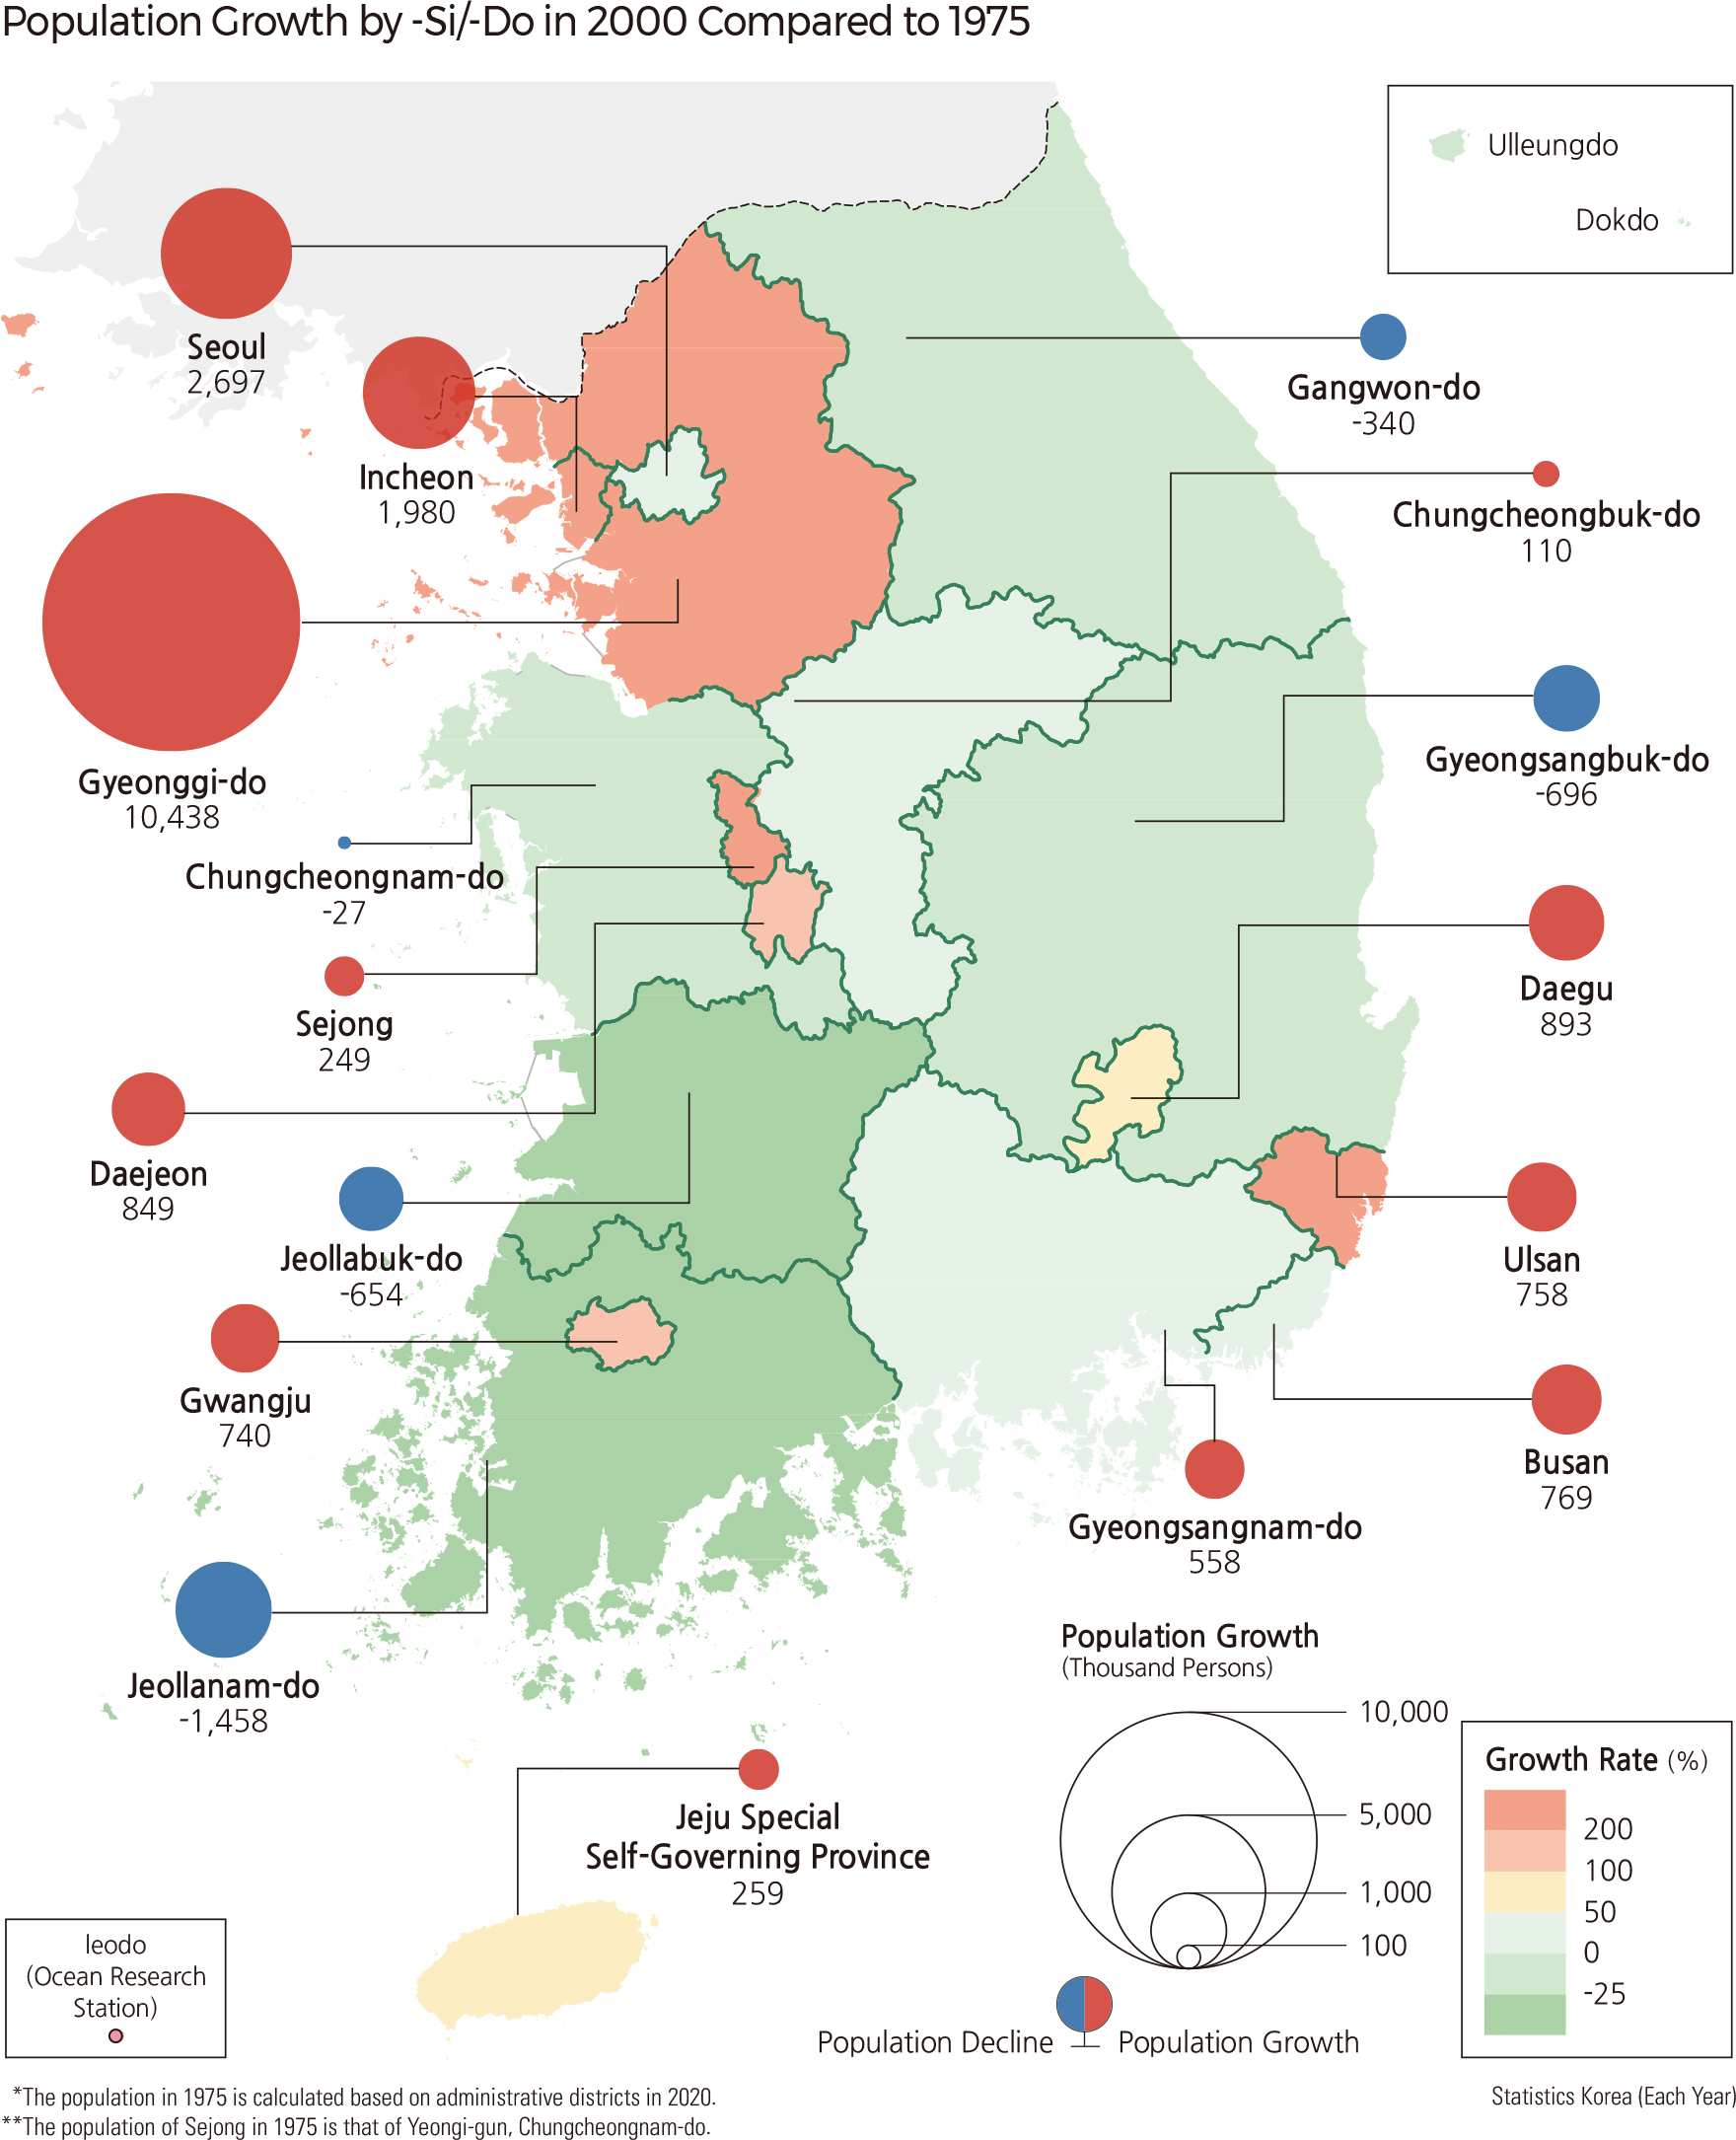
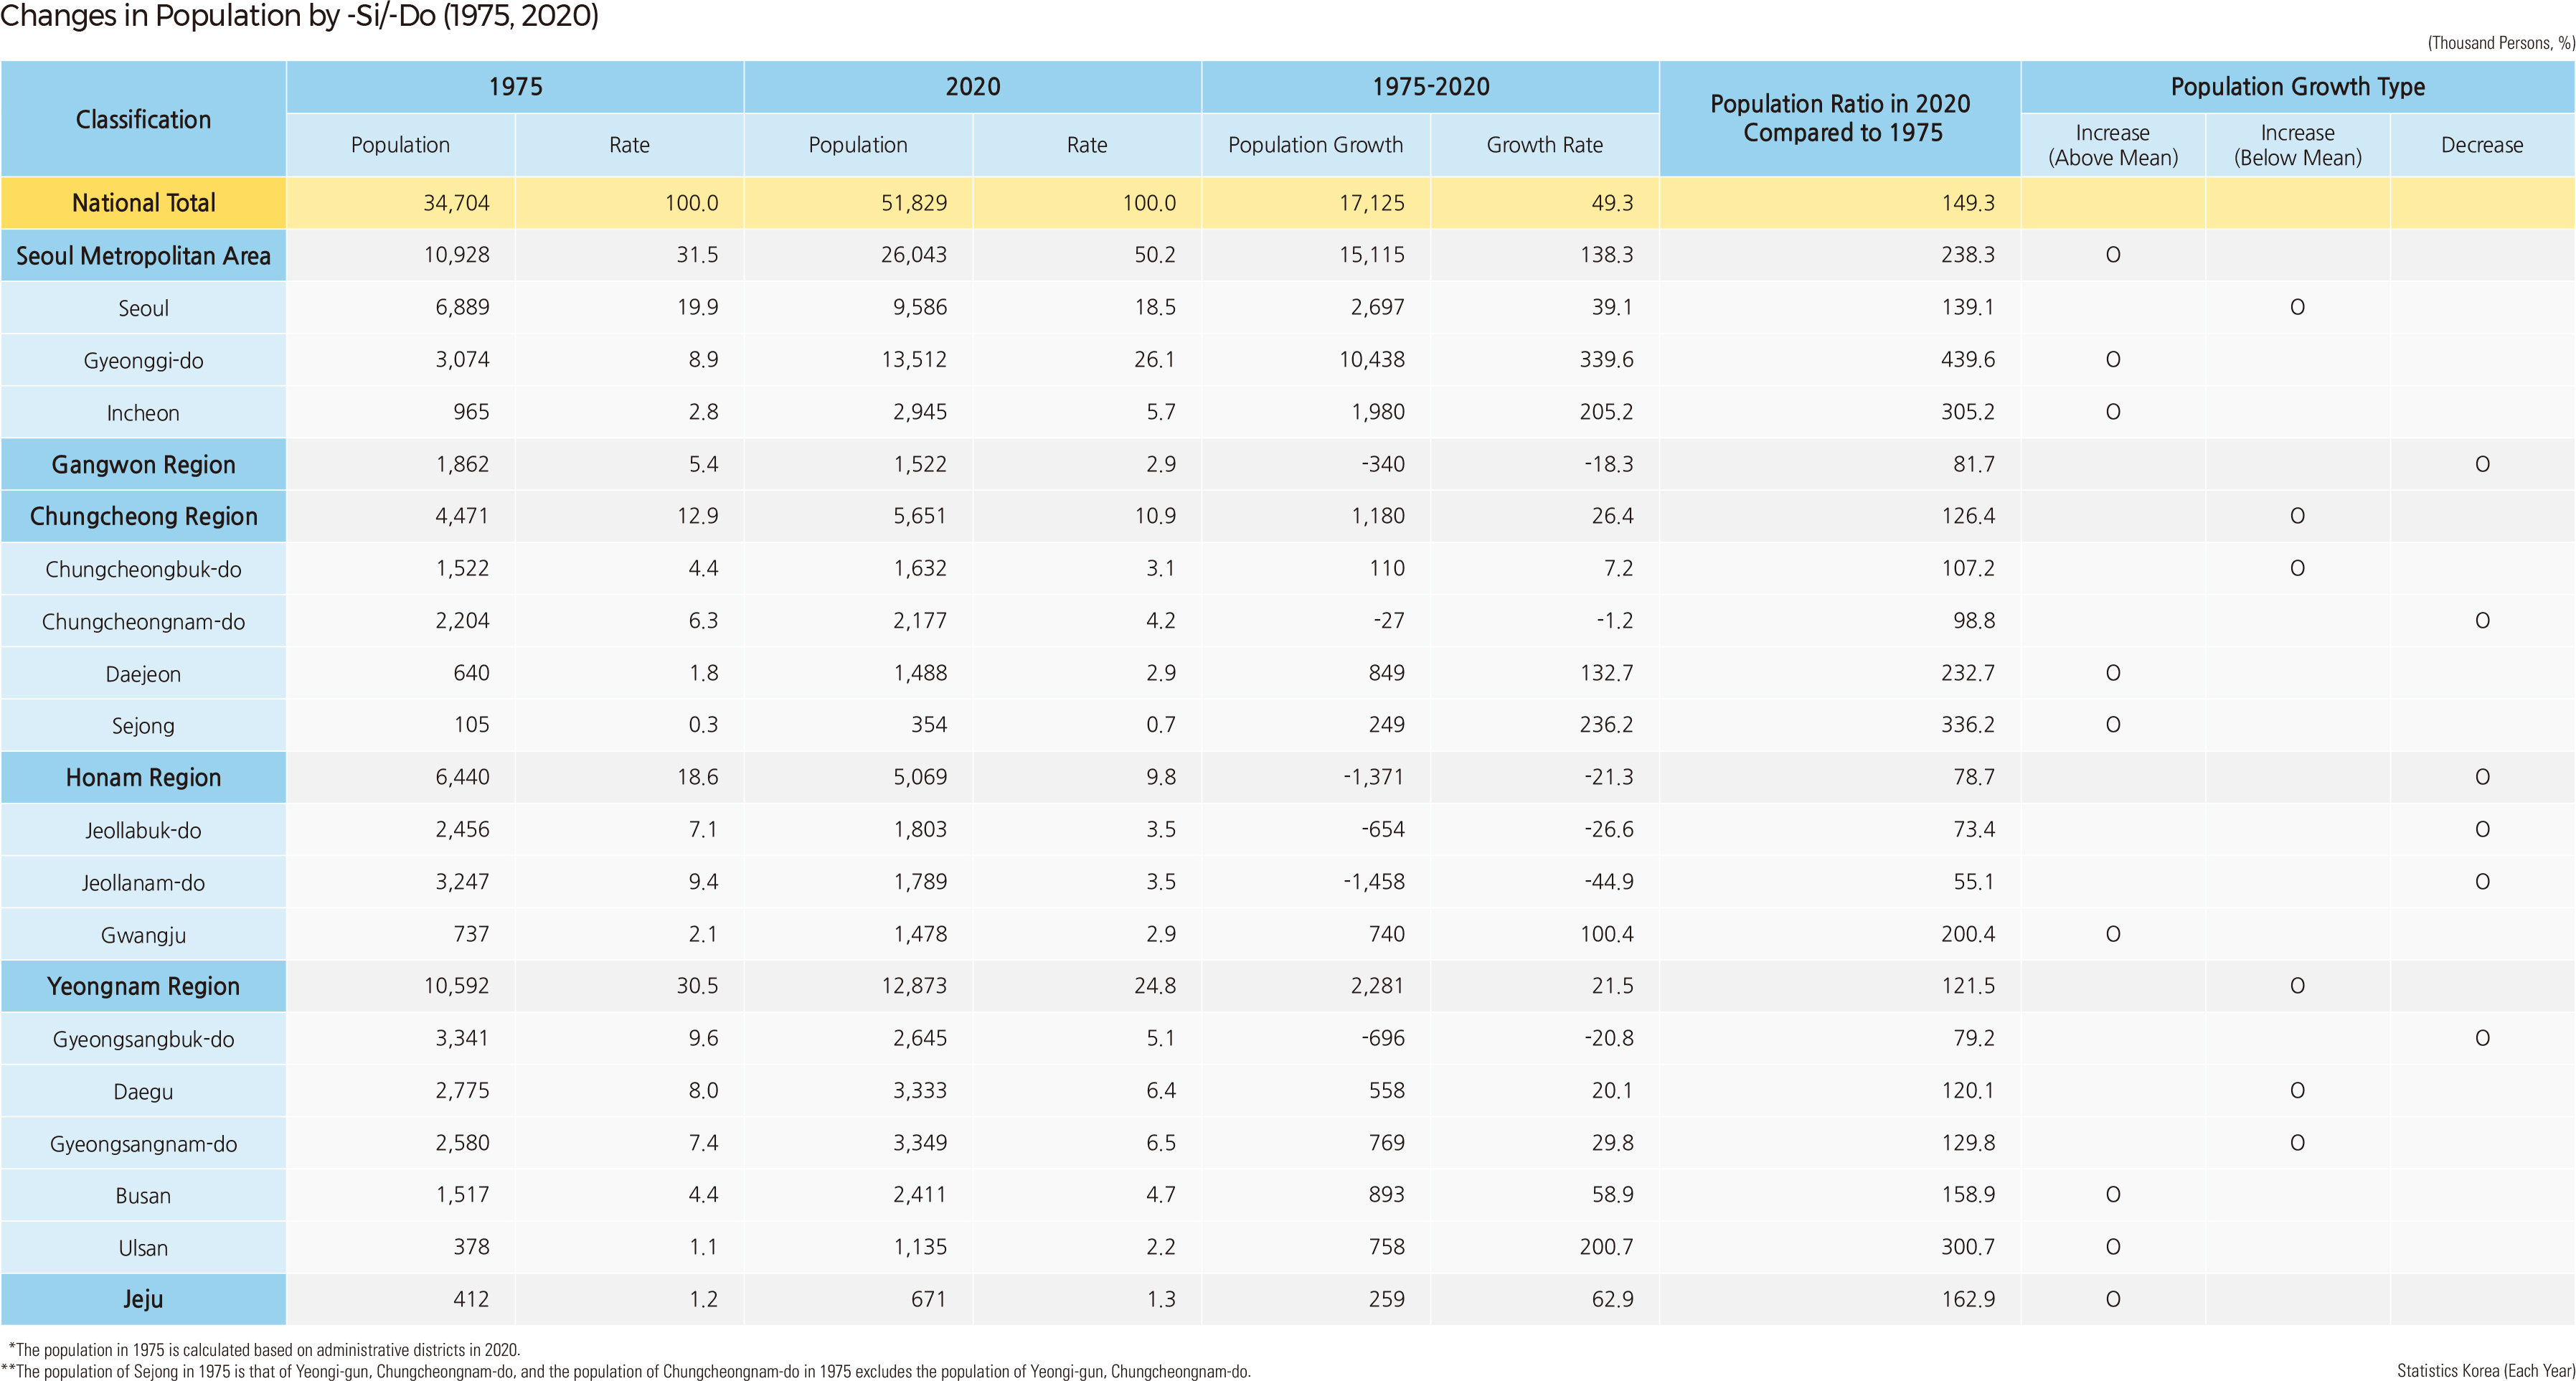
Assuming no change in administrative districts, Yeonsu-gu in Incheon (2,206%) experienced the highest population growth rate between 1975 and 2020 at the -si/-gun/-gu area levels, followed by other administrative districts in the Seoul Metropolitan Area, such as Ansan-si in Gyeonggi-do (1,728%), Seo-gu in Incheon (1,425%), Siheung-si in Gyeonggi-do (1,174%), and Gunpo-si in Gyeonggi-do (1,076%). On the other hand, the region with the lowest population growth rate (the largest population decrease rate) was Sinan-gun in Jeollanam-do (-78%). Rural areas such as Yeongyang-gun in Gyeongsangbuk-do (-77%), Jinan-gun in Jeollabuk-do (-76%), Boseong-gun in Jeollanam-do (-76%), and Jeongseon-gun in Gangwon-do (-75%) occupy most of the population decrease areas. As of 2020, 120 out of the 229 -si/-gun/-gu areas had decreases in population compared to 1975, of which 74 areas had population decreases of more than 50% compared to 1975. In 30 areas, more than 2/3 of the population had decreased. In addition, 26 of the 109 areas where the population increased did not reach the national population growth rate of 49.3% during the same period, so it can be evaluated as an area where the population actually flowed out. Therefore, 146 out of 229 -si/-gun/gu areas are regions with an outflow of population. The population decreased in large cities, such as the central areas of Seoul, Busan, Daegu, Incheon, Gwangju, and Daejeon. At the -si/-do area levels, administrative districts with higher population growth rates were Gyeonggi-do (340%), Sejong (236%), Incheon (205%), and Ulsan (201%). On the other hand, administrative districts with higher population decrease rates were Jeollanam-do (-45%), Jeollabuk-do (-27%), Gyeongsangbuk-do (-21%), and Gangwon-do (-18%). From 1975 to 2020, the population increased from 34.7 million to 51.83 million, an increase of about 17.13 million (19.3%). The population of Gyeonggi-do increased from 3.07 million in 1975 to 13.51 million in 2020, an increase of 10.44 million, which is about 61% of the population increase during the same period. In the case of Jeollanam-do, the population decreased from 3.25 million in 1975 to 1.79 million in 2020, a decrease of about 1.46 million. As a result, the proportion of the population, which had reached 9.4% of the national population in 1975, decreased to 3.5% in 2020.
|