English III 2021
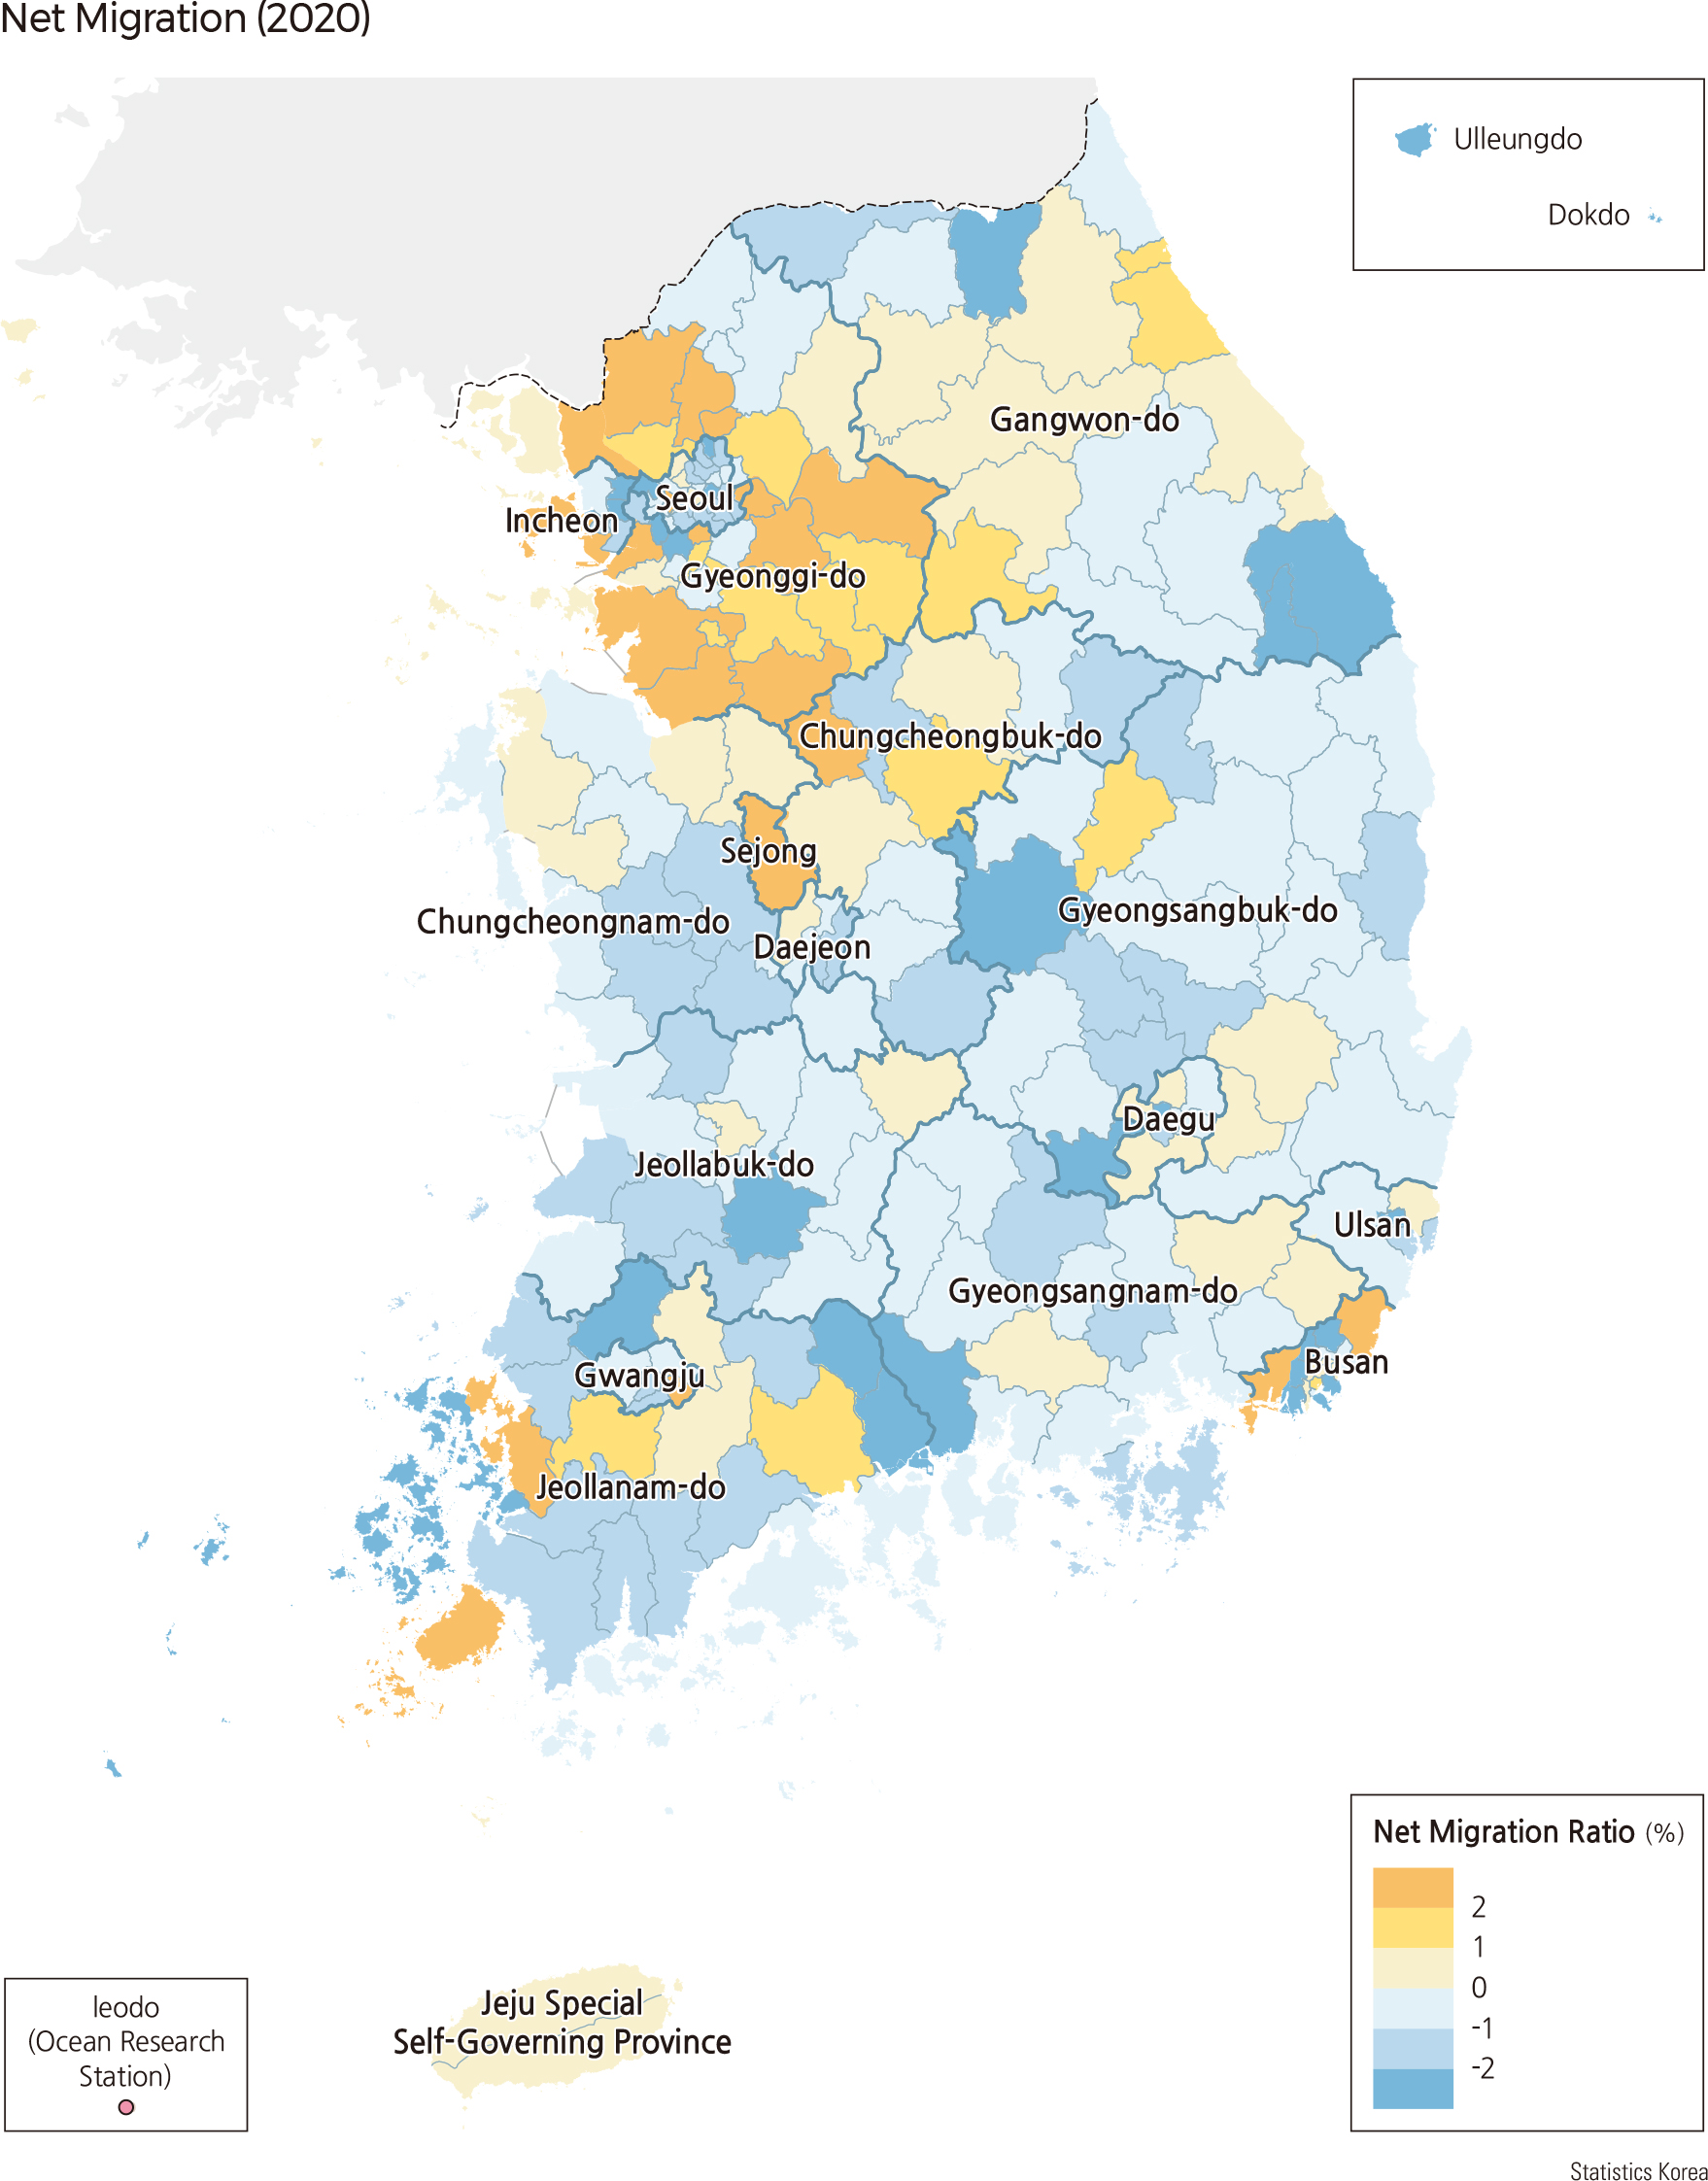
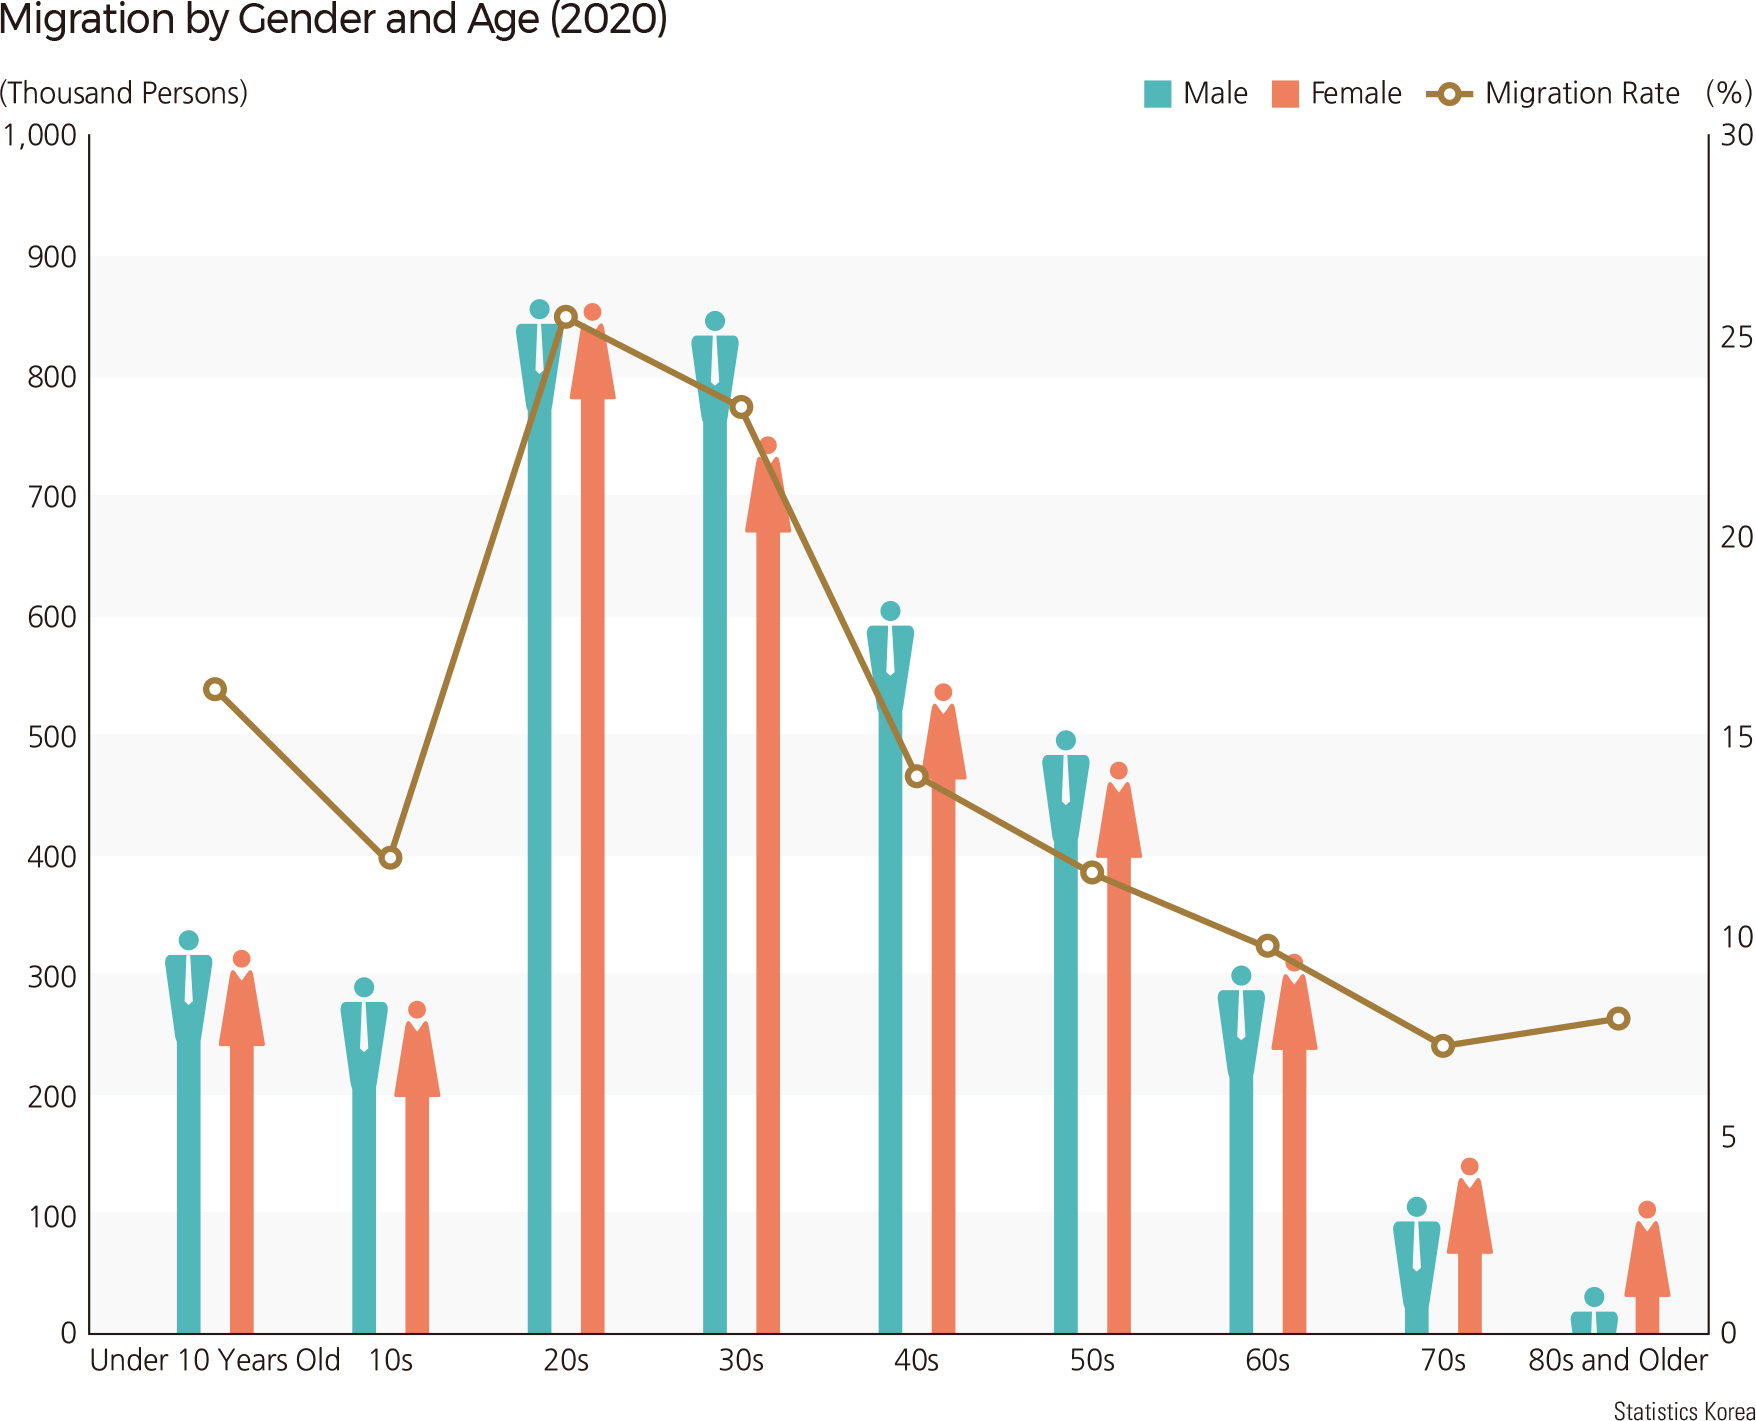
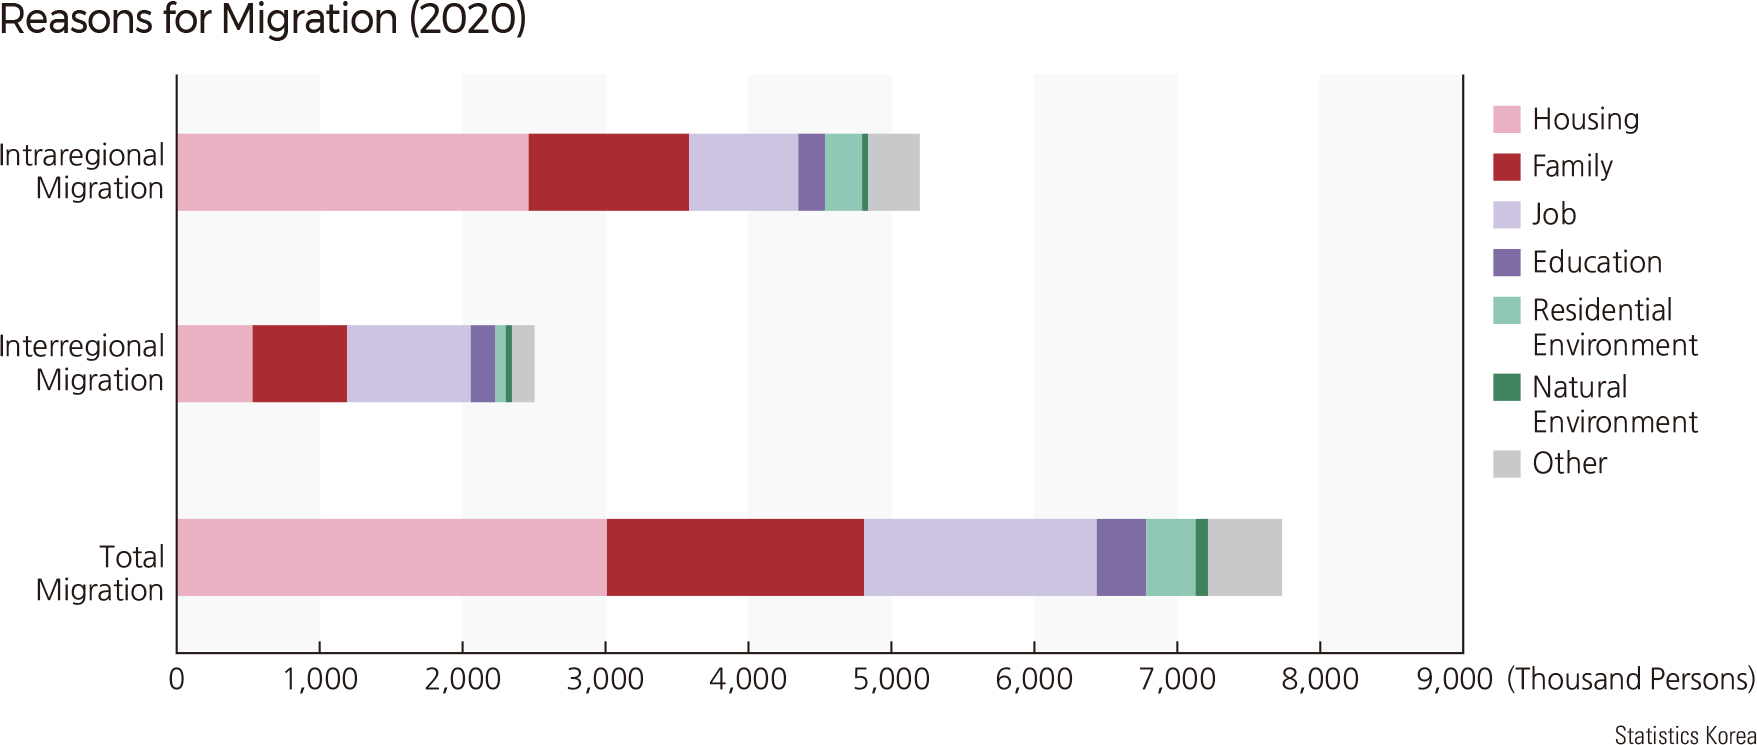
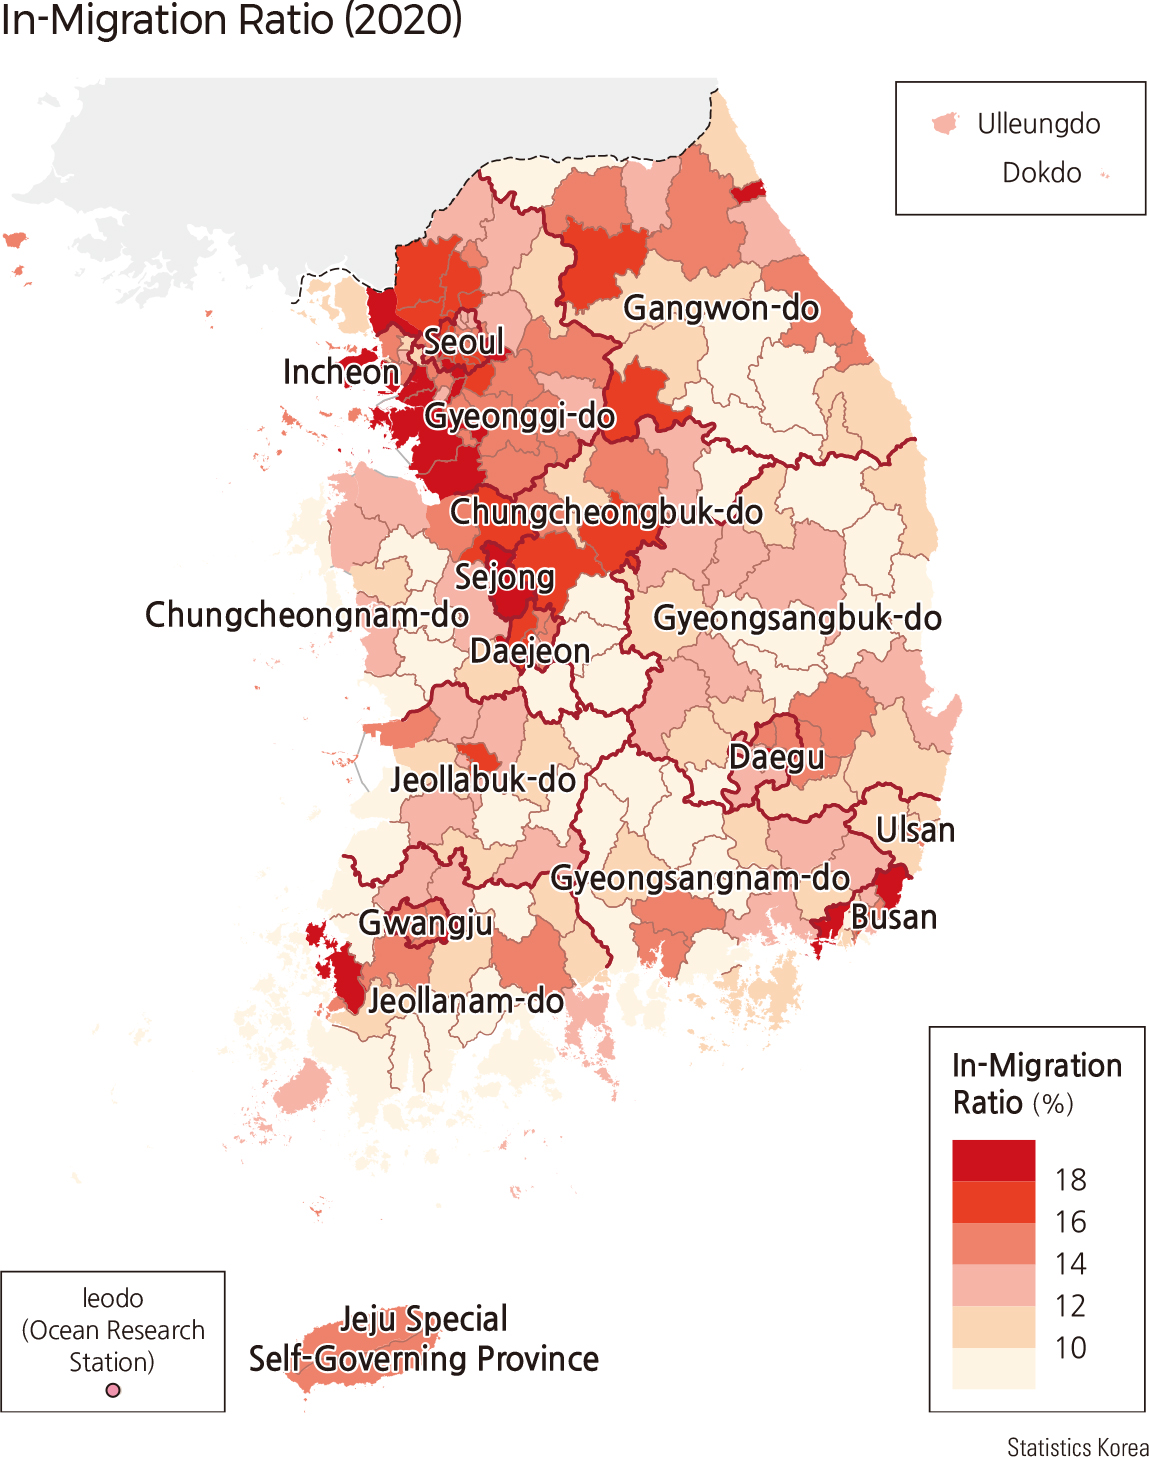
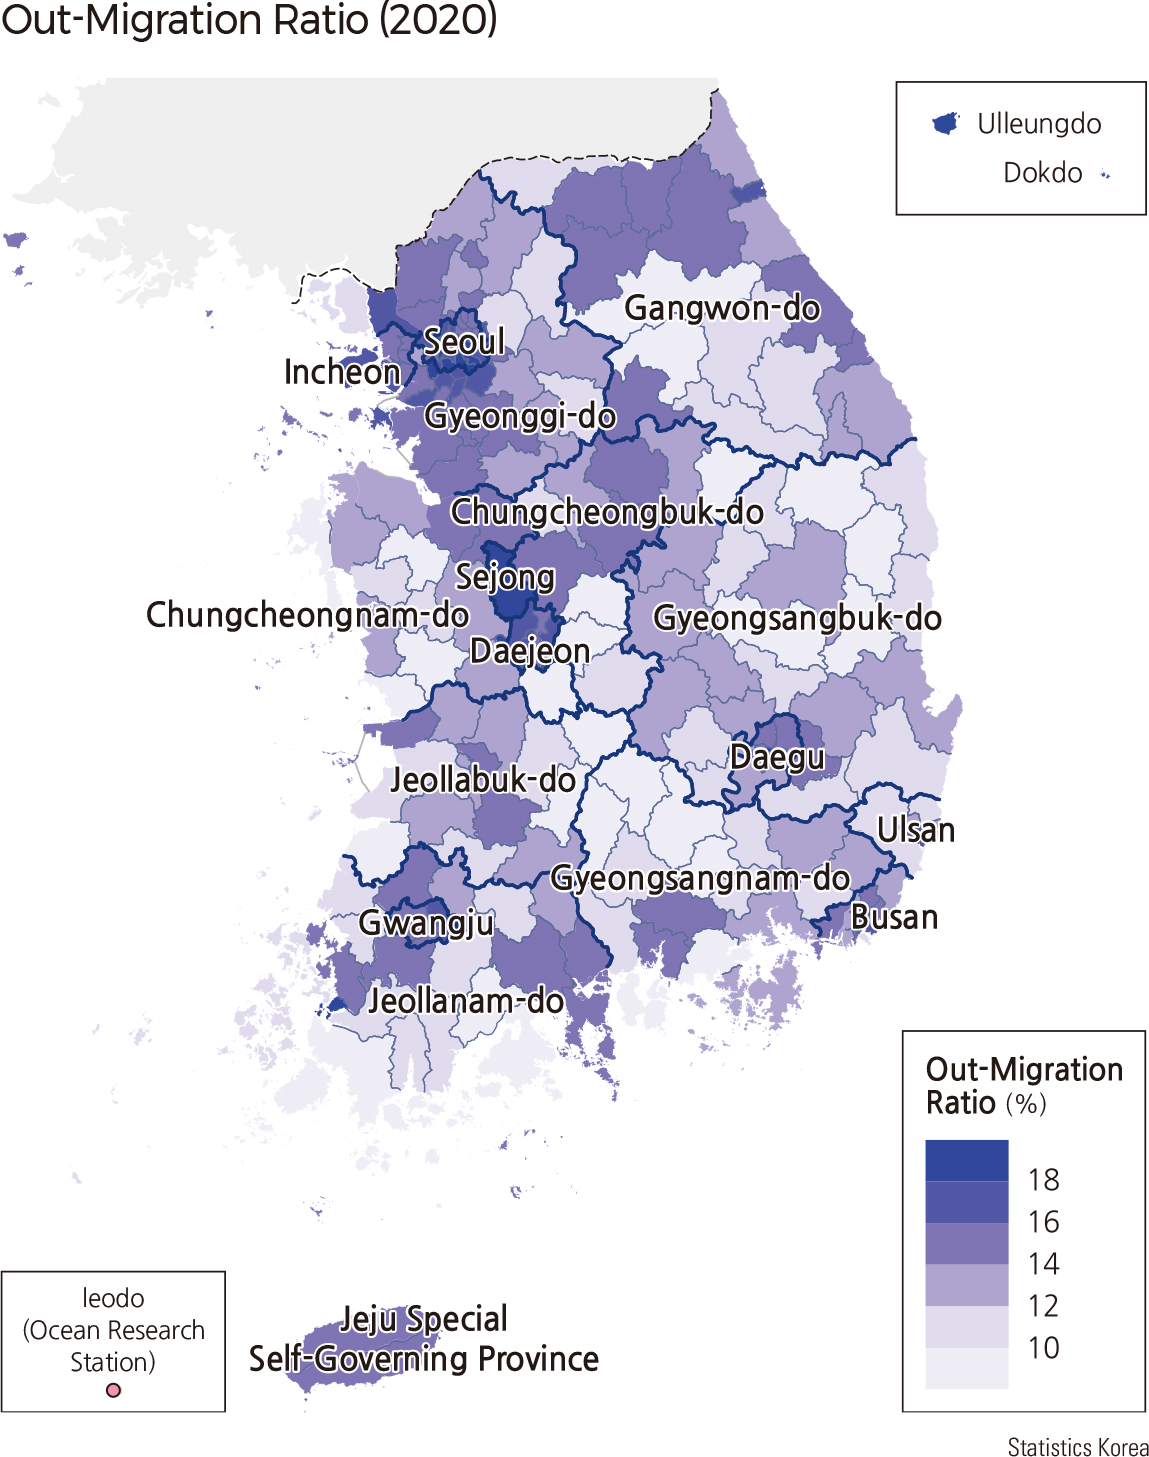
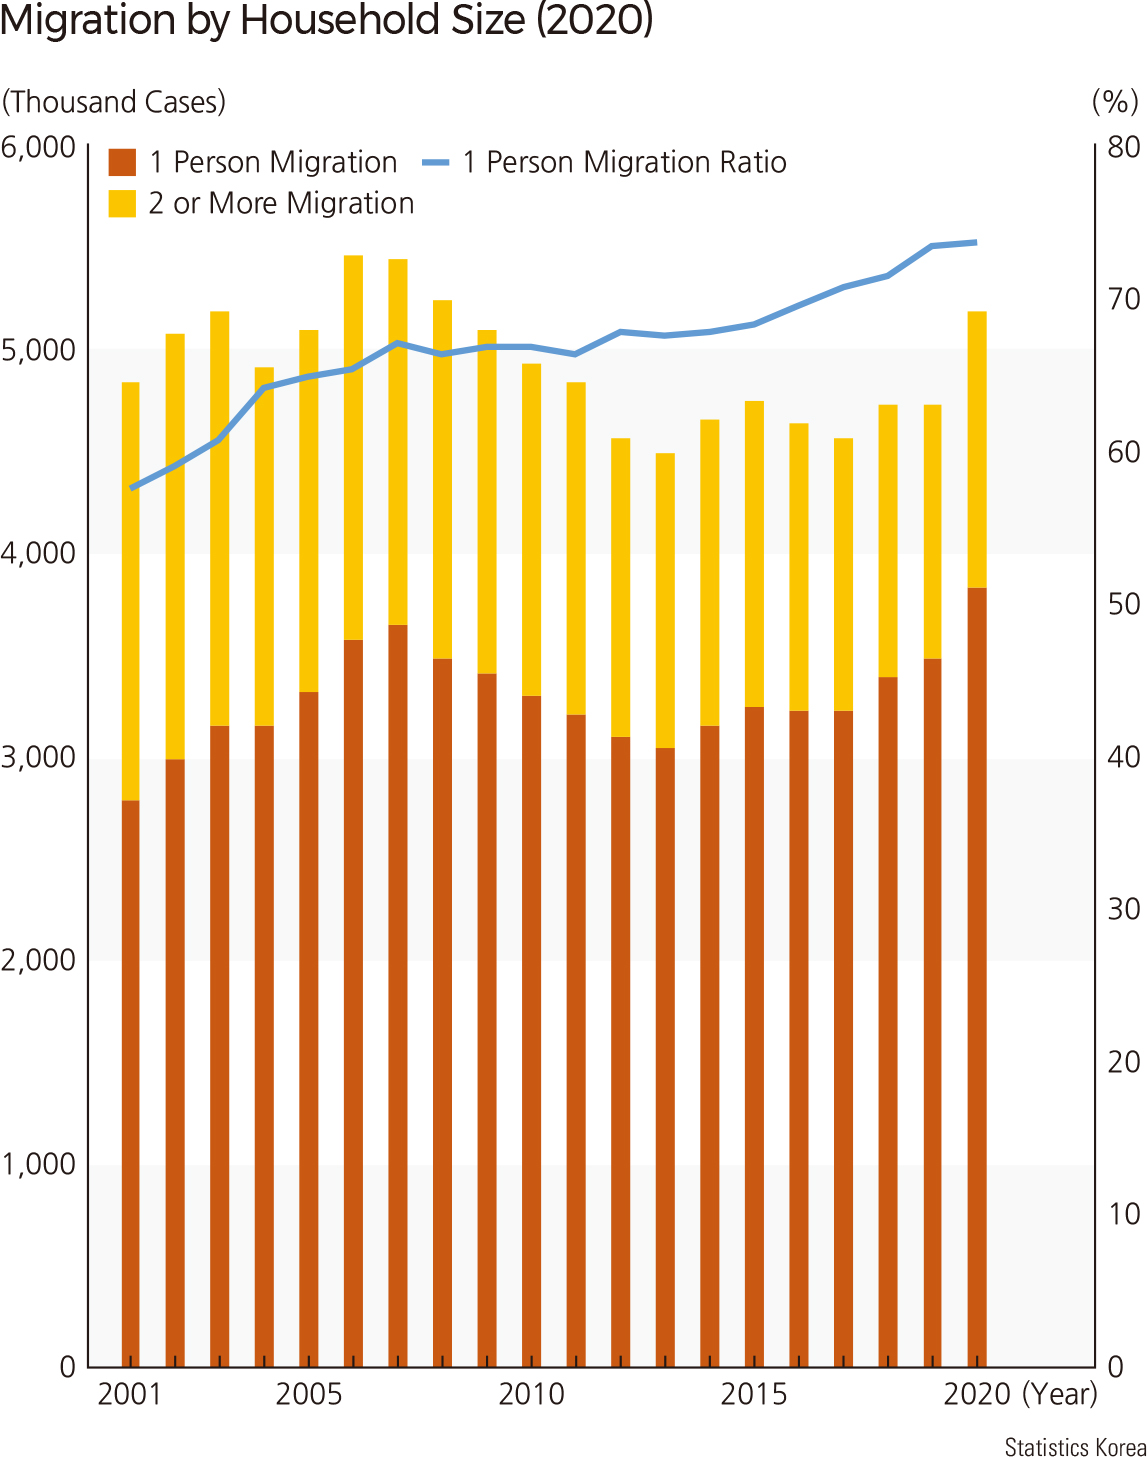
In 2020, the number of annual migrants reached 7.74 million. At the -si/-gun/-gu area levels, the rate of population migration changes due to social and economic issues occurring in the region, as well as in-migration rates, out-migration rates, and net migration rates, vary widely from year to year. In general, in-migration rates and out-migration rates are high in urban areas and low in rural areas. As of 2020, the top five -si/-gun/-gu areas with higher in-migration rates are Gwacheon-si in Gyeonggi-do (25.1%), Gimpo-si in Gyeonggi-do (24.6%), Gangdong-gu in Seoul (23.0%), Sejong (22.7%), and Hanam-si in Gyeonggi-do (22.6%). The top five -si/-gun/-gu areas with lower in-migration rates are Yeongyang-gun in Gyeongsangbuk-do (7.3%), Geochang-gun in Gyeongsangnam-do (7.8%), Danyang-gun in Chungcheongbuk-do (7.8%), Haenam-gun in Jeollanam-do (7.9%), and Bonghwa-gun in Gyeongsangbuk-do (8.1%). The top five -si/-gun/-gu areas with higher out-migration rates are Gwangmyeong-si in Gyeonggi-do (21.4%), Gwanak-gu in Seoul (21.1%), Gyeryong-si in Chungcheongnam-do (20.8%), Jung-gu in Daegu (20.7%), and Ulleung-gun in Gyeongsangbuk-do (19.2%). The top five -si/-gun/-gu areas with lower out-migration rates are Yeongyang-gun in Gyeongsangbuk-do (7.8%), Geochang-gun in Gyeongsangnam-do (8.1%), Okcheon-gun in Chungcheongbuk-do (8.3%), Namhae-gun in Gyeongsangnam-do (8.8%), and Wando-gun in Jeollanam-do (8.9%). On the other hand, the net migration rate is high in new residential areas or industrial development areas and low in old downtown areas and areas experiencing an industrial contraction in large cities. In traditional rural areas, the net migration rate also shows a negative (-) value, and the population continues to flow out. The top five -si/-gun/-gu areas with higher net migration rates are Gwacheon-si in Gyeonggi-do (8.0%), Gimpo-si in Gyeonggi-do (7.8%), Hanam-si in Gyeonggi-do (7.2%), Muan-gun in Jeollanam-do (6.4%), and Gangseo-gu in Busan (5.7%). The top five -si/-gun/-gu areas with lower net migration rates are Bupyeong-gu in Incheon (-3.3%), Gwangyang-si in Jeollanam-do (-3.4%), Imsil-gun in Jeollabuk-do (-4.8%), Ulleung-gun in Gyeongsangbuk-do (-5.6%), and Gwangmyeong-si in Gyeonggi-do (-6.0%). By gender, there are more male migrants than female migrants in all age groups except those in their 60s. By age, the migrant rates of those ages of 20s and 30s are relatively higher than other ages, with 25.5% and 23.2%, respectively, and the number of migrants in the 20s and 30s is 3.34 million, which is 43% of the total migrants. The reasons for the intraregional migration (migration within the province) were in the order of housing, family, and occupation, and the reasons for the interregional migration (migration between provinces) were occupation, family, and housing in that order. However, the most common reason for migration from Seoul to other provinces was housing. The number of migration cases was 5.18 million in 2020, with 1.49 people moving per migration case. As the size of household members decreases, the average number of people of a migration case gets smaller. The proportion of single-person migrations out of the total number of migrations increases. As of 2020, the number of single-person migrations reached 3.83 million, or 74% of the total. |