English III 2021
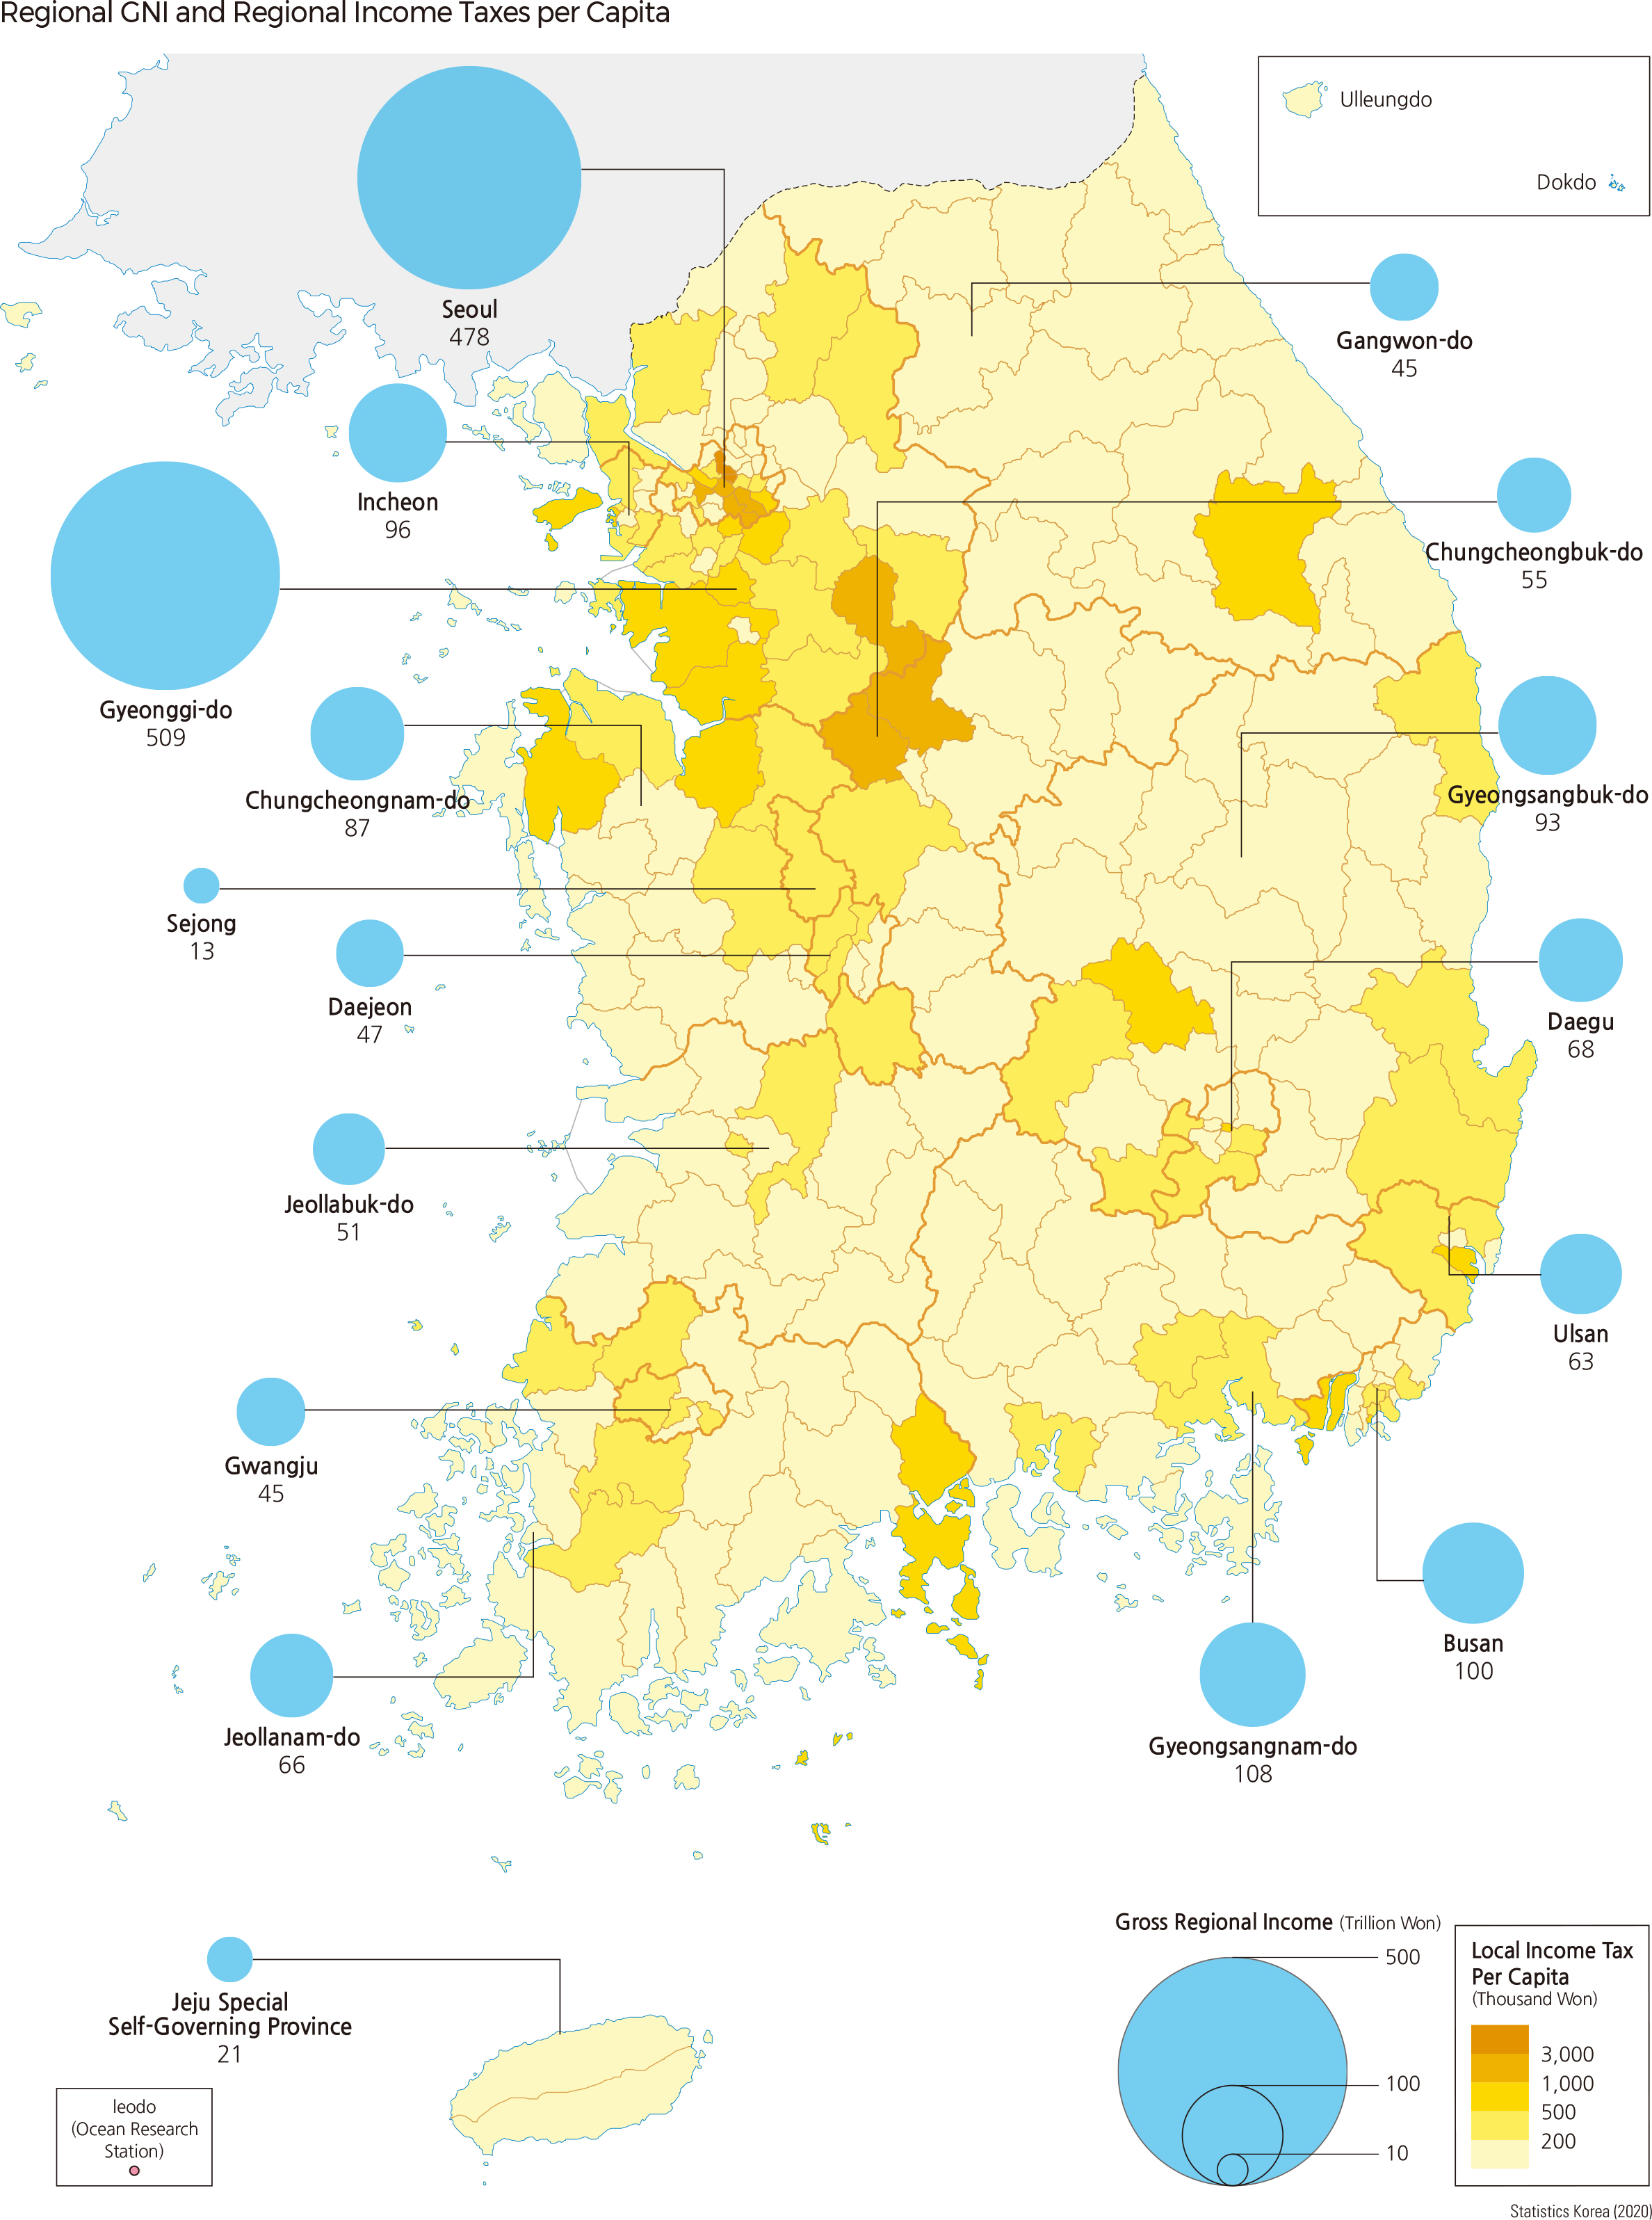
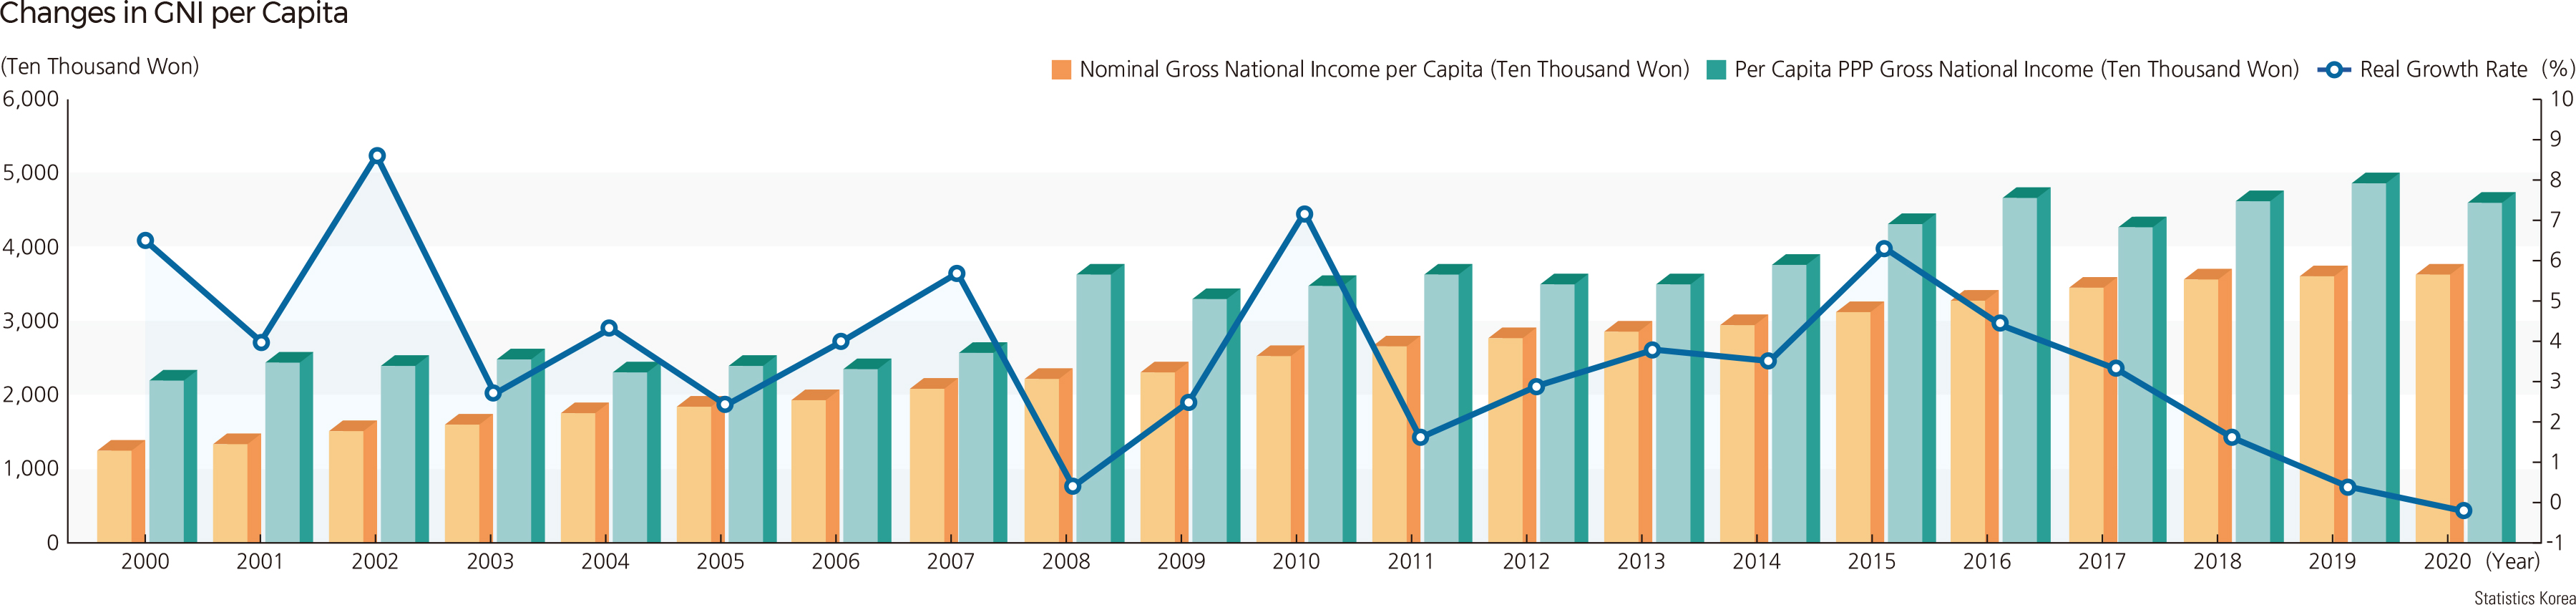
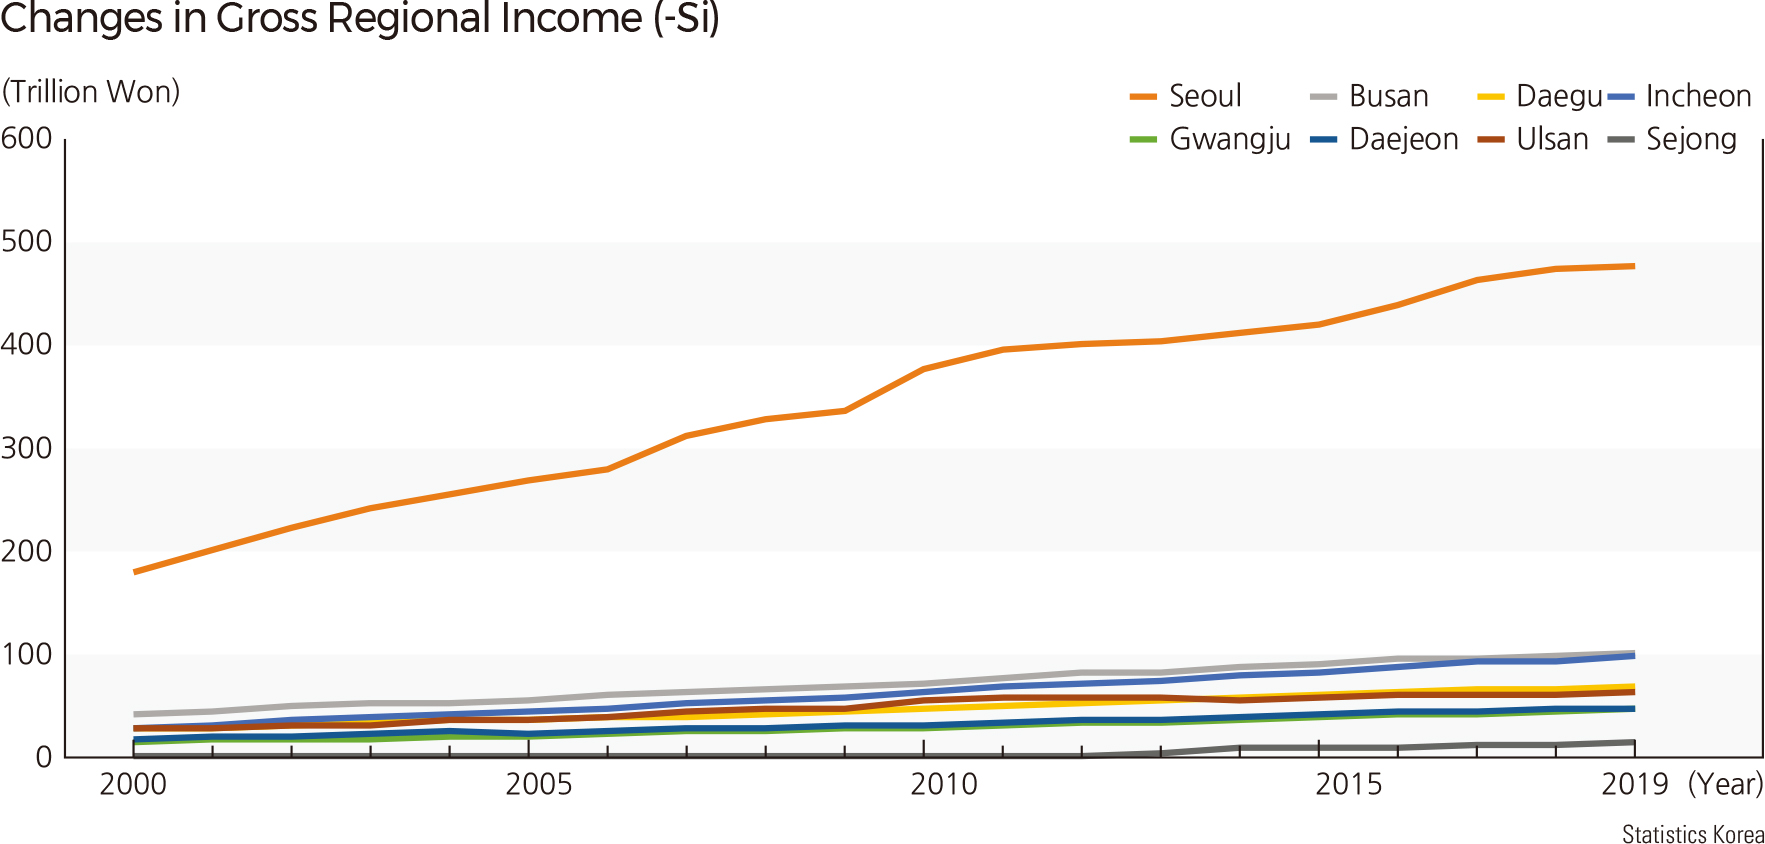
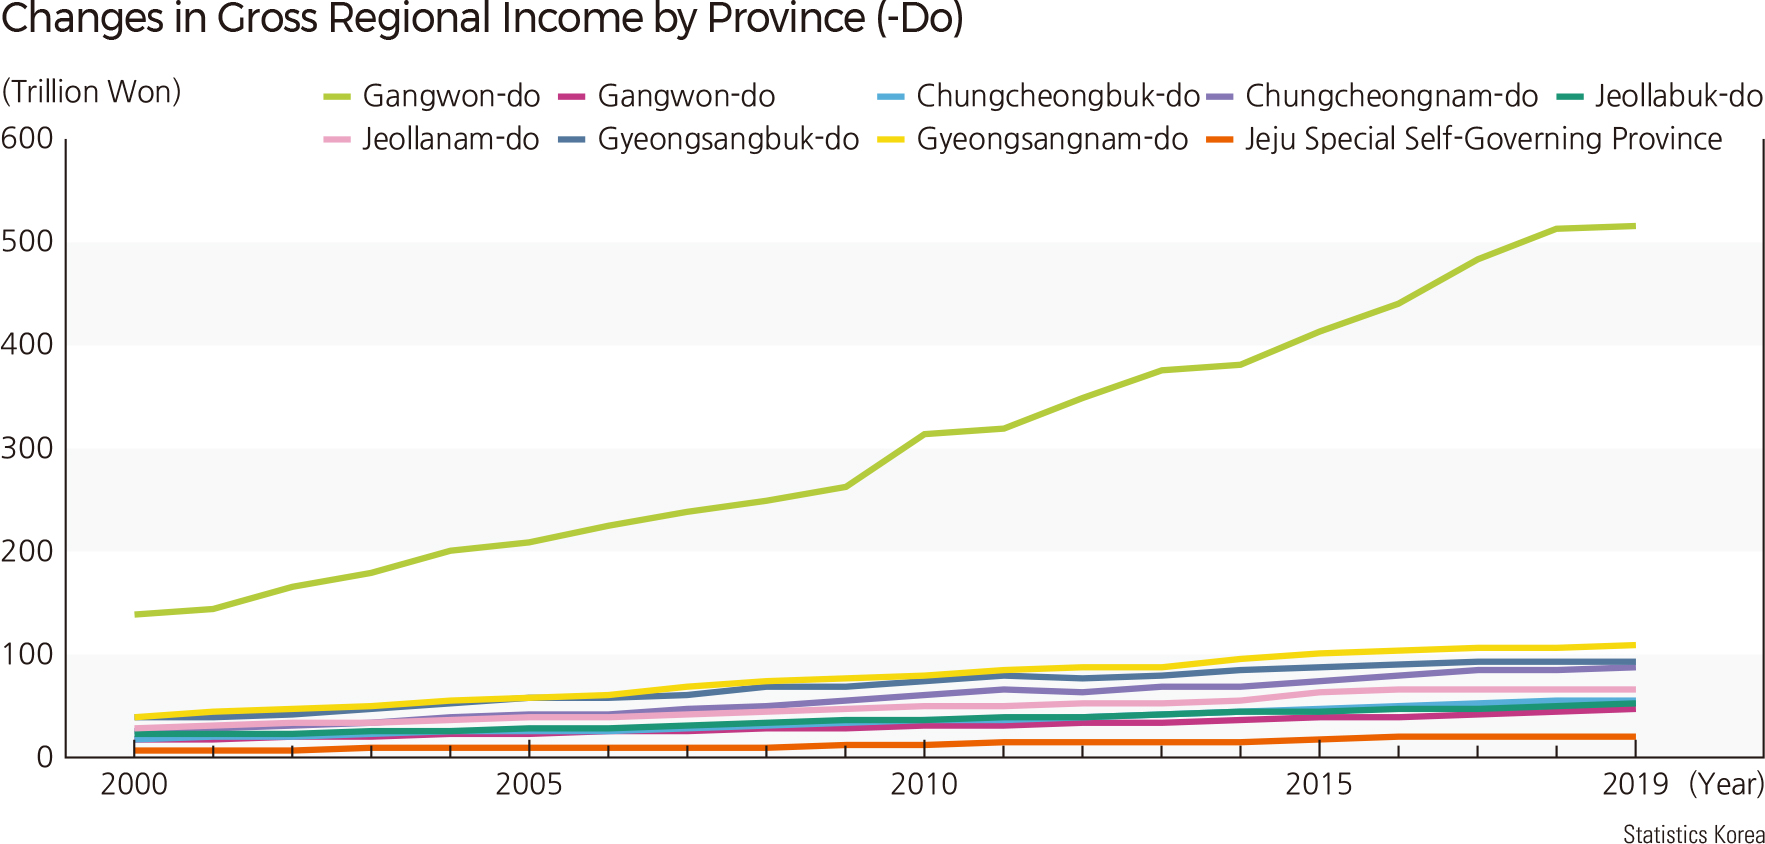
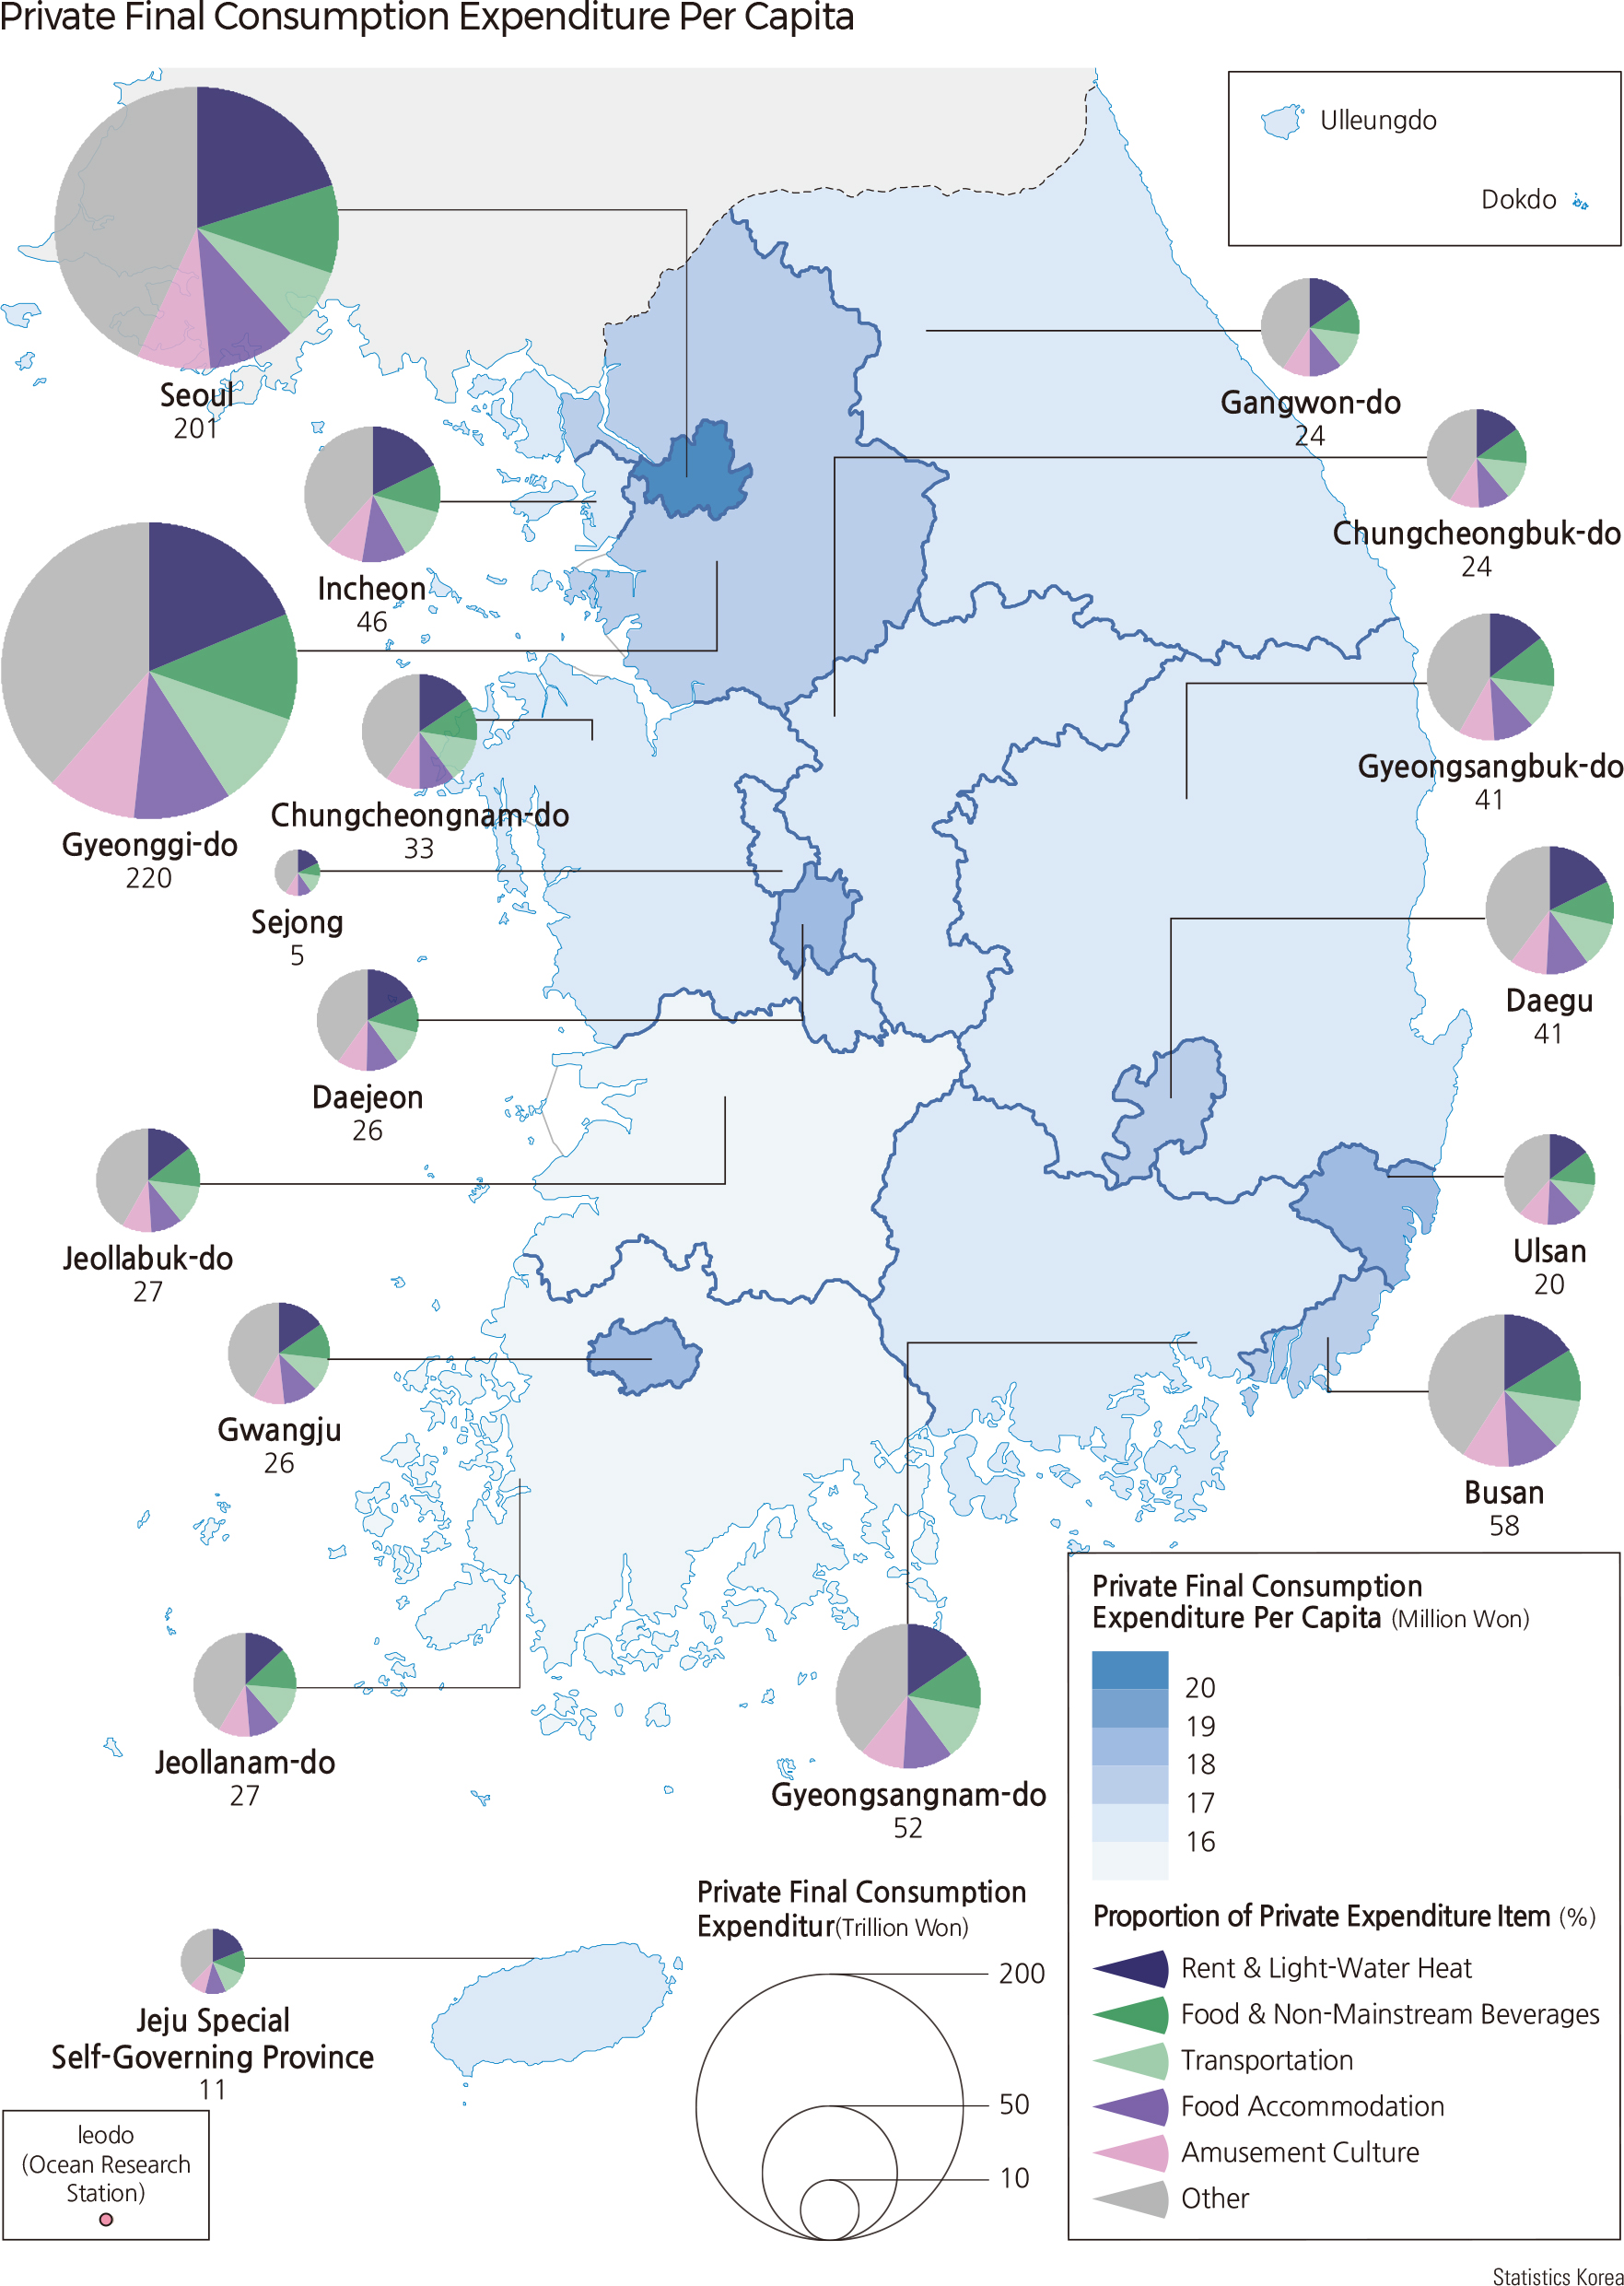
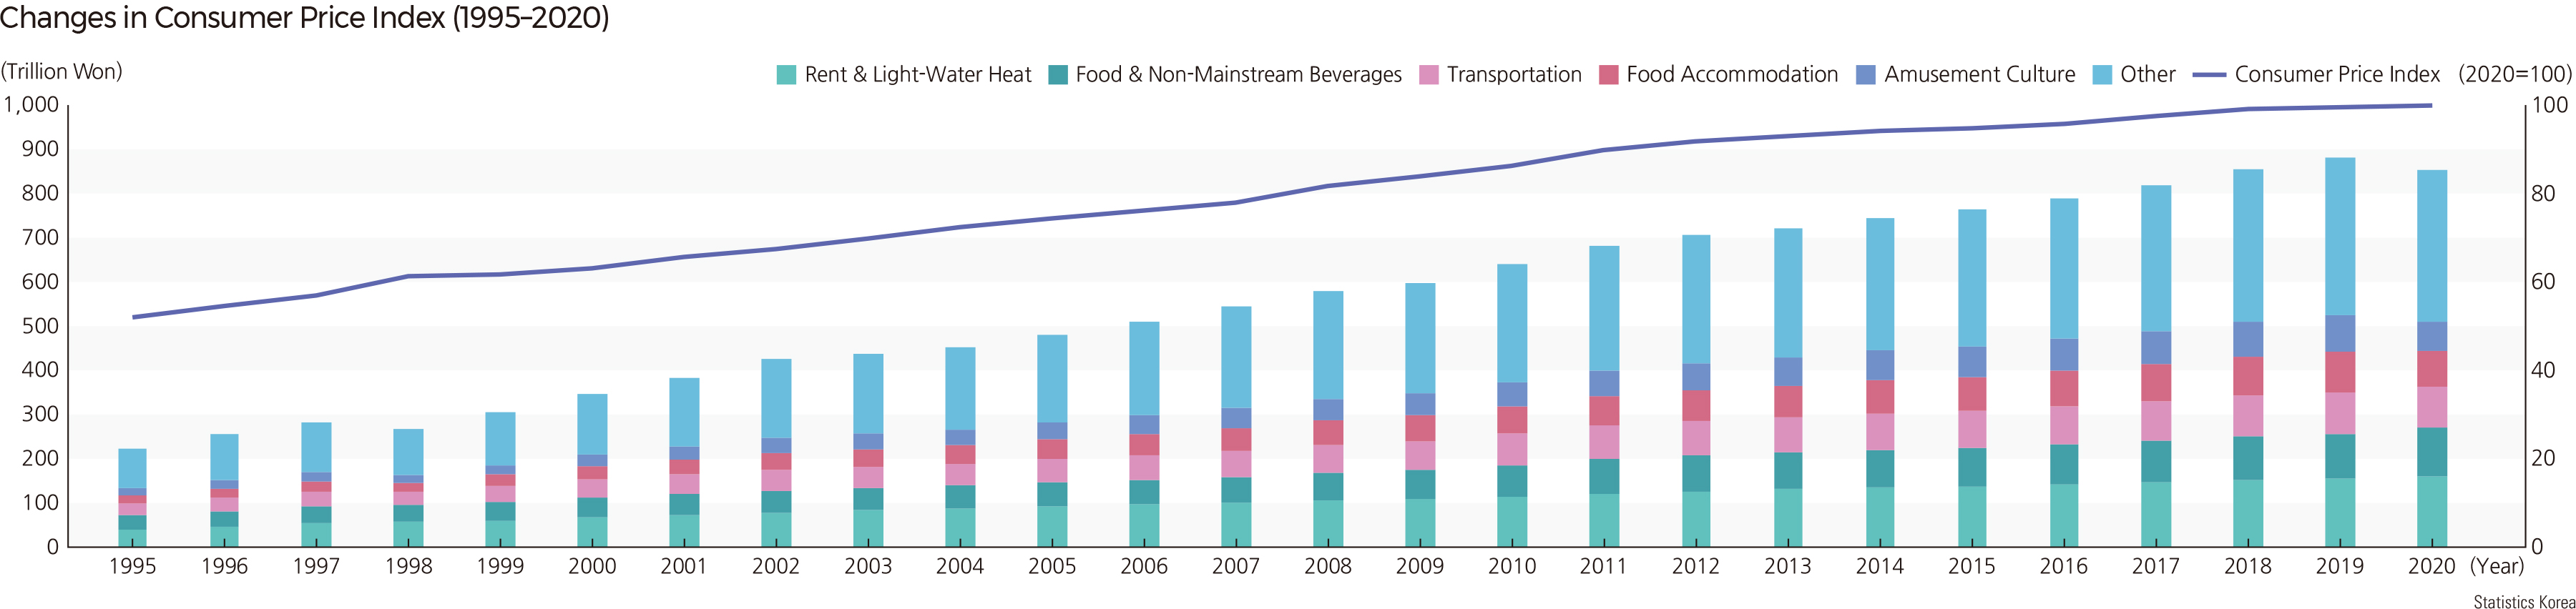
Regional gross domestic product (RGDP) has been regarded as an index that evaluates regional wealth to explain regional inequality and economic differences at the national level. However, it might not include all of the regional incomes. For example, the output produced by a branch factory would be included in the RGDP in the administrative region in which the branch is located, while the surplus yielded by the branch is going to be integrated into the regional income in the administrative region in which the headquarter is located. Therefore, the index of regional income levels should use total regional income rather than RGDP. Nevertheless, it is hard to use regional income at the -si/-gun/-gu area levels because regional income data is only available at the level of metropolitan cities and provinces (-do) in Korea. Instead, regional income tax would be used as a substitute index of regional income at the level of sub-metropolitan cities and provinces. Total regional income has increased from 661 trillion won in 2000 to 1,949 trillion won in 2019, accounting for a 194.7% increase for 19 years. In terms of regional income by the level of metropolitan cities and provinces, higher regions than the national average were as follows: Gyeonggi-do (274.2%), Incheon (259.1%), Chungcheongnam-do (243.9%), Jeju-do (240.6%), Chungcheongbuk-do (216.8%), Gwangju (207.4). In particular, regional income in Gyeonggi-do has overtaken Seoul since 2016 and accounted for 26.4% of national income in 2019. In this same year, the regional income per capita by the level of metropolitan cities and provinces was as follows: Ulsan (54.19 million won), Seoul (48.69 million won), Chungcheongnam-do (41.09 million won), Gyeonggi-do (39.29 million won), Sejong (38.18 million won). The level of regional income tax per capita by the -si/-gun areas in 2019 was as follows: Seoul Jung-gu (6.59 million won), Seoul Jongno-gu (3.13 million won), Gangnam-gu (2.24 million won) in Seoul, Icheon-si (2.07 million won) in Gyeonggi-do, Seocho-gu (1.67 million won) in Seoul, Yeongdeungpo-gu (1.62 million won) in Seoul, Jincheon-si (1.14 million won) in Chungcheongbuk-do, Eumseong-gun (1.06 million won) in Chungcheongbuk-do. On the other hand, the lowest region was Seogwipo-si in Jeju-do, accounting for only 0.02 million won. In terms of total regional consumption expenditure in 2019, the proportion of expenditure by metropolitan cities and provinces was as follows: Gyeonggi-do (23.4%), Seoul (20.7%), Gyeongsangnam-do (6.3%), Busan (6.2%), Incheon (5.2%). Regions higher than the national average of consumption expenditure (24.4 million won) were Sejong (35.6 million won), Gangwon-do (29.5 million won), Seoul (26.9 million won), Jeollanam-do (26.7 million won), and so on whereas regions lower than the national average were Incheon (22.2 million won) and Busan (23.5 million won). Consumption expenditure by item was as follows: food and non-alcoholic beverages (15.9%), restaurants and hotels (13.3%), transportation (12.0%), and housing, bills, gas, and other fuels (11.9%) |