English III 2021
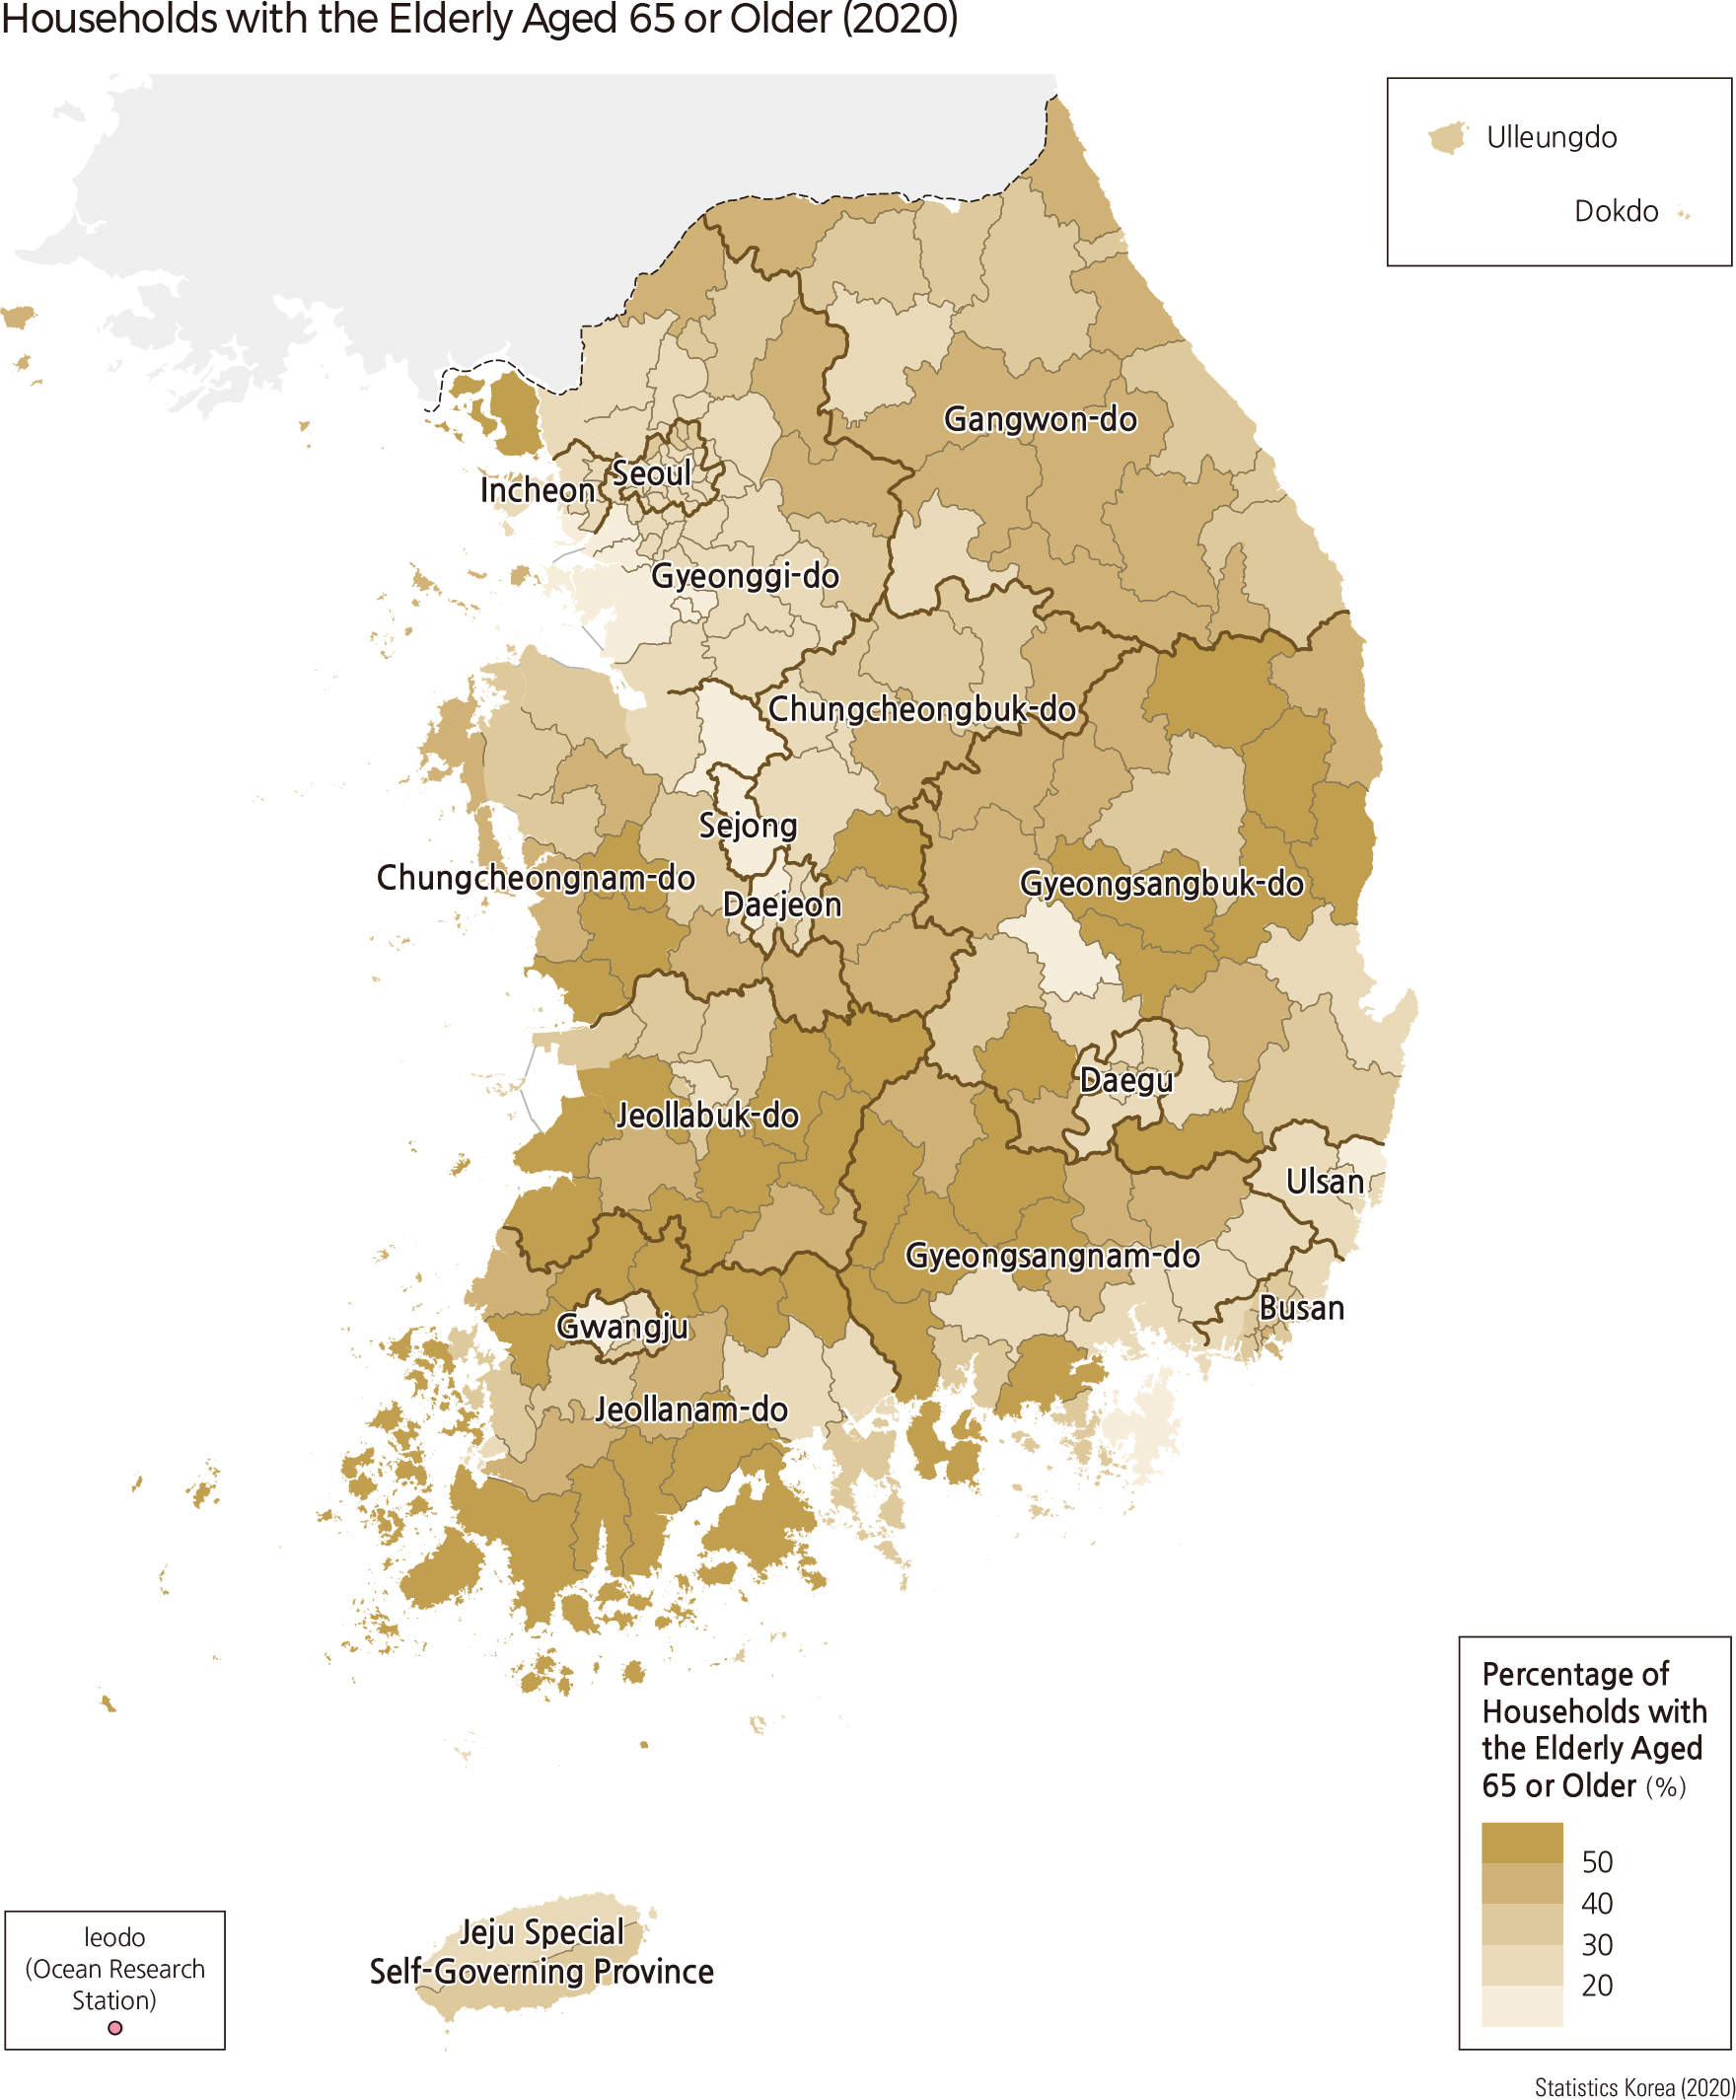
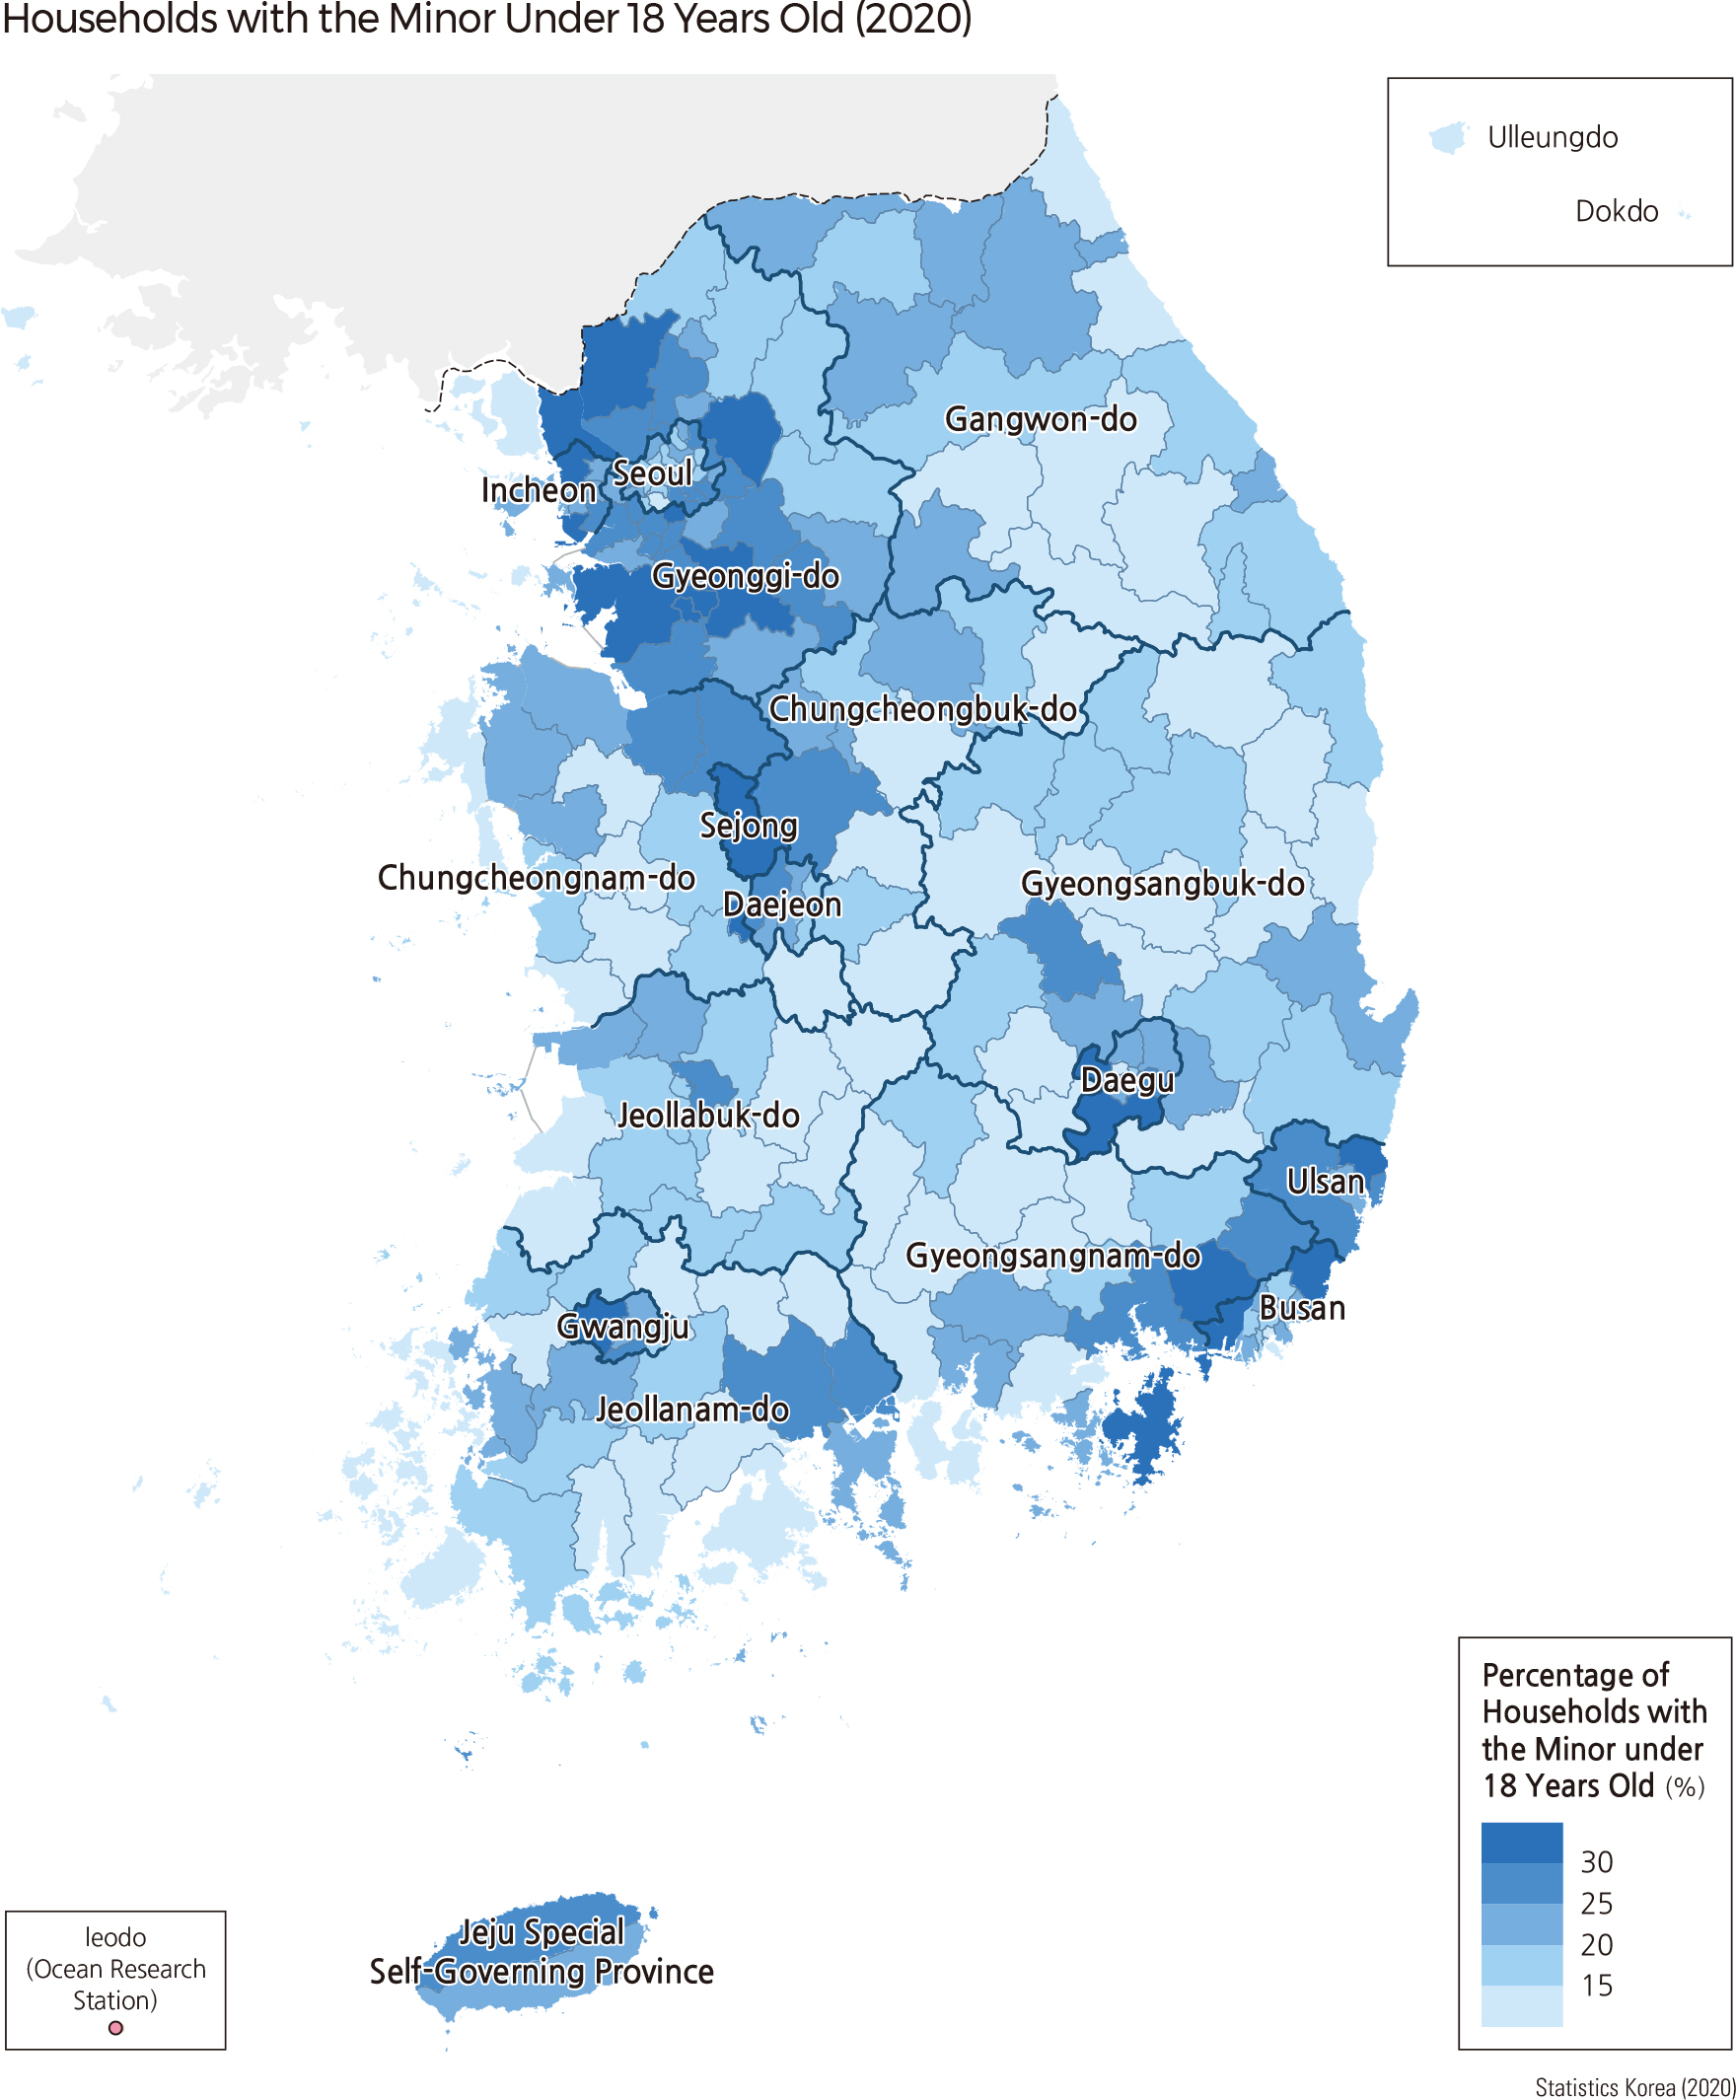
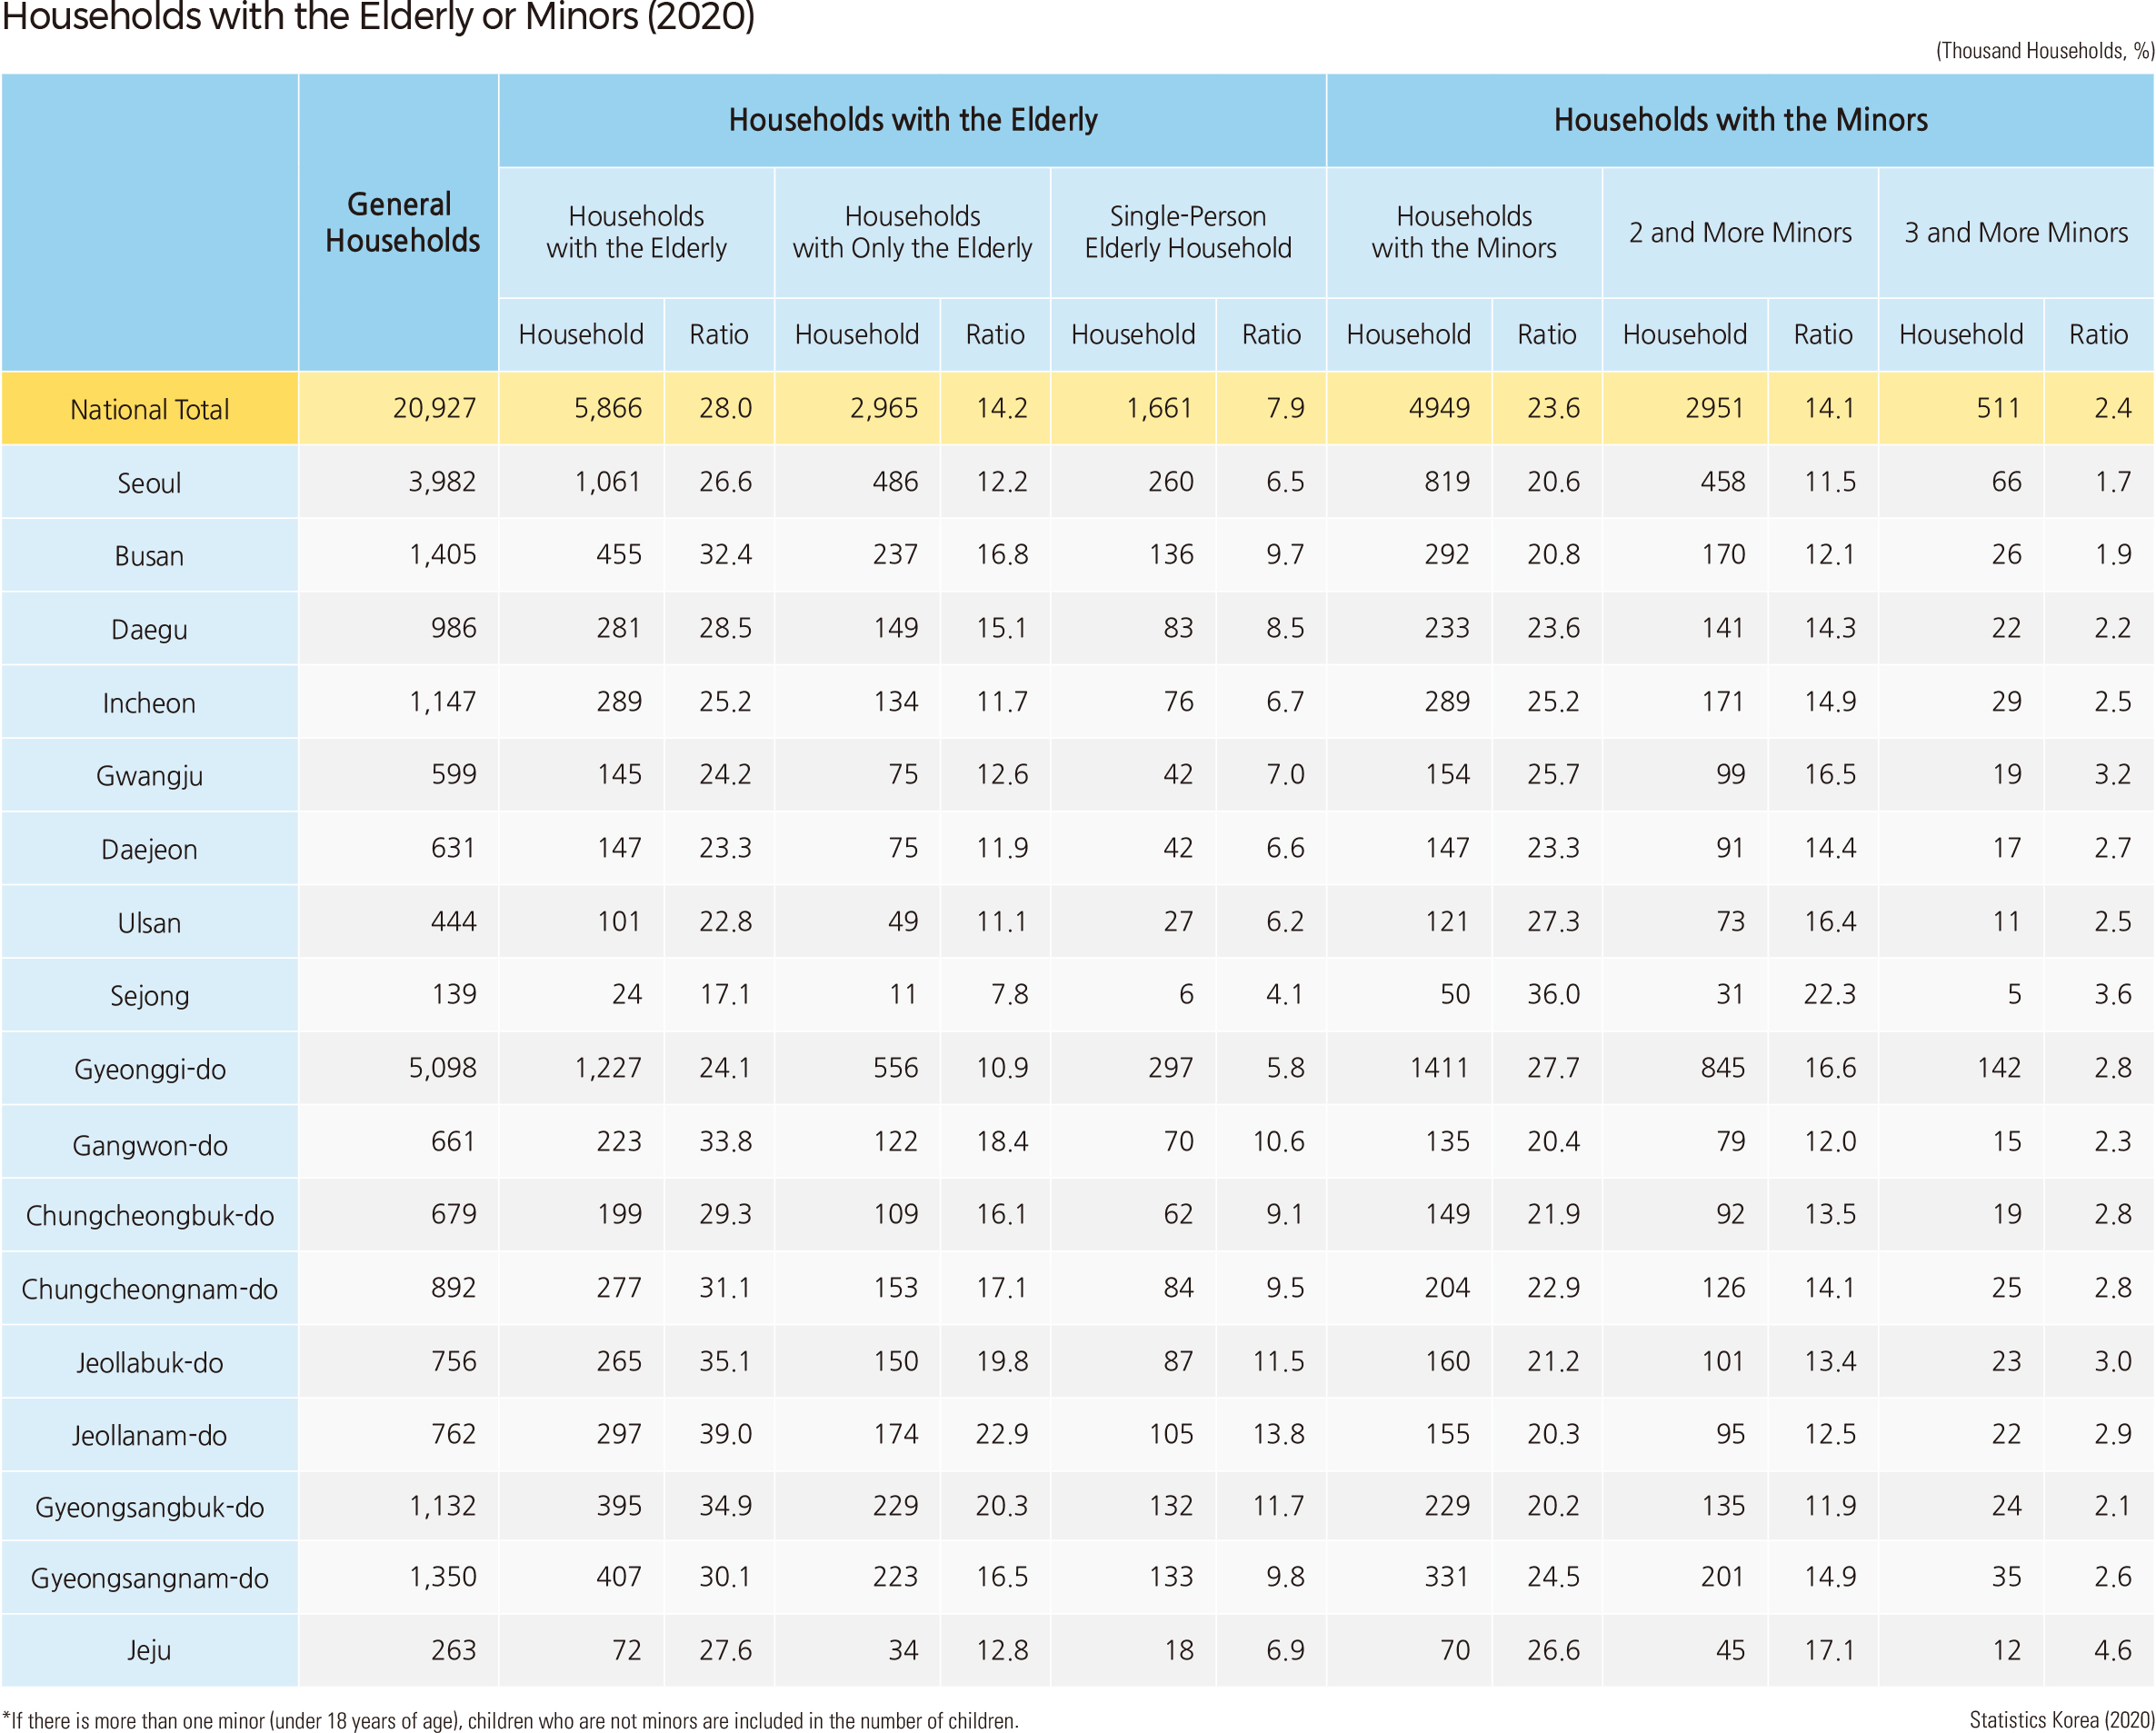
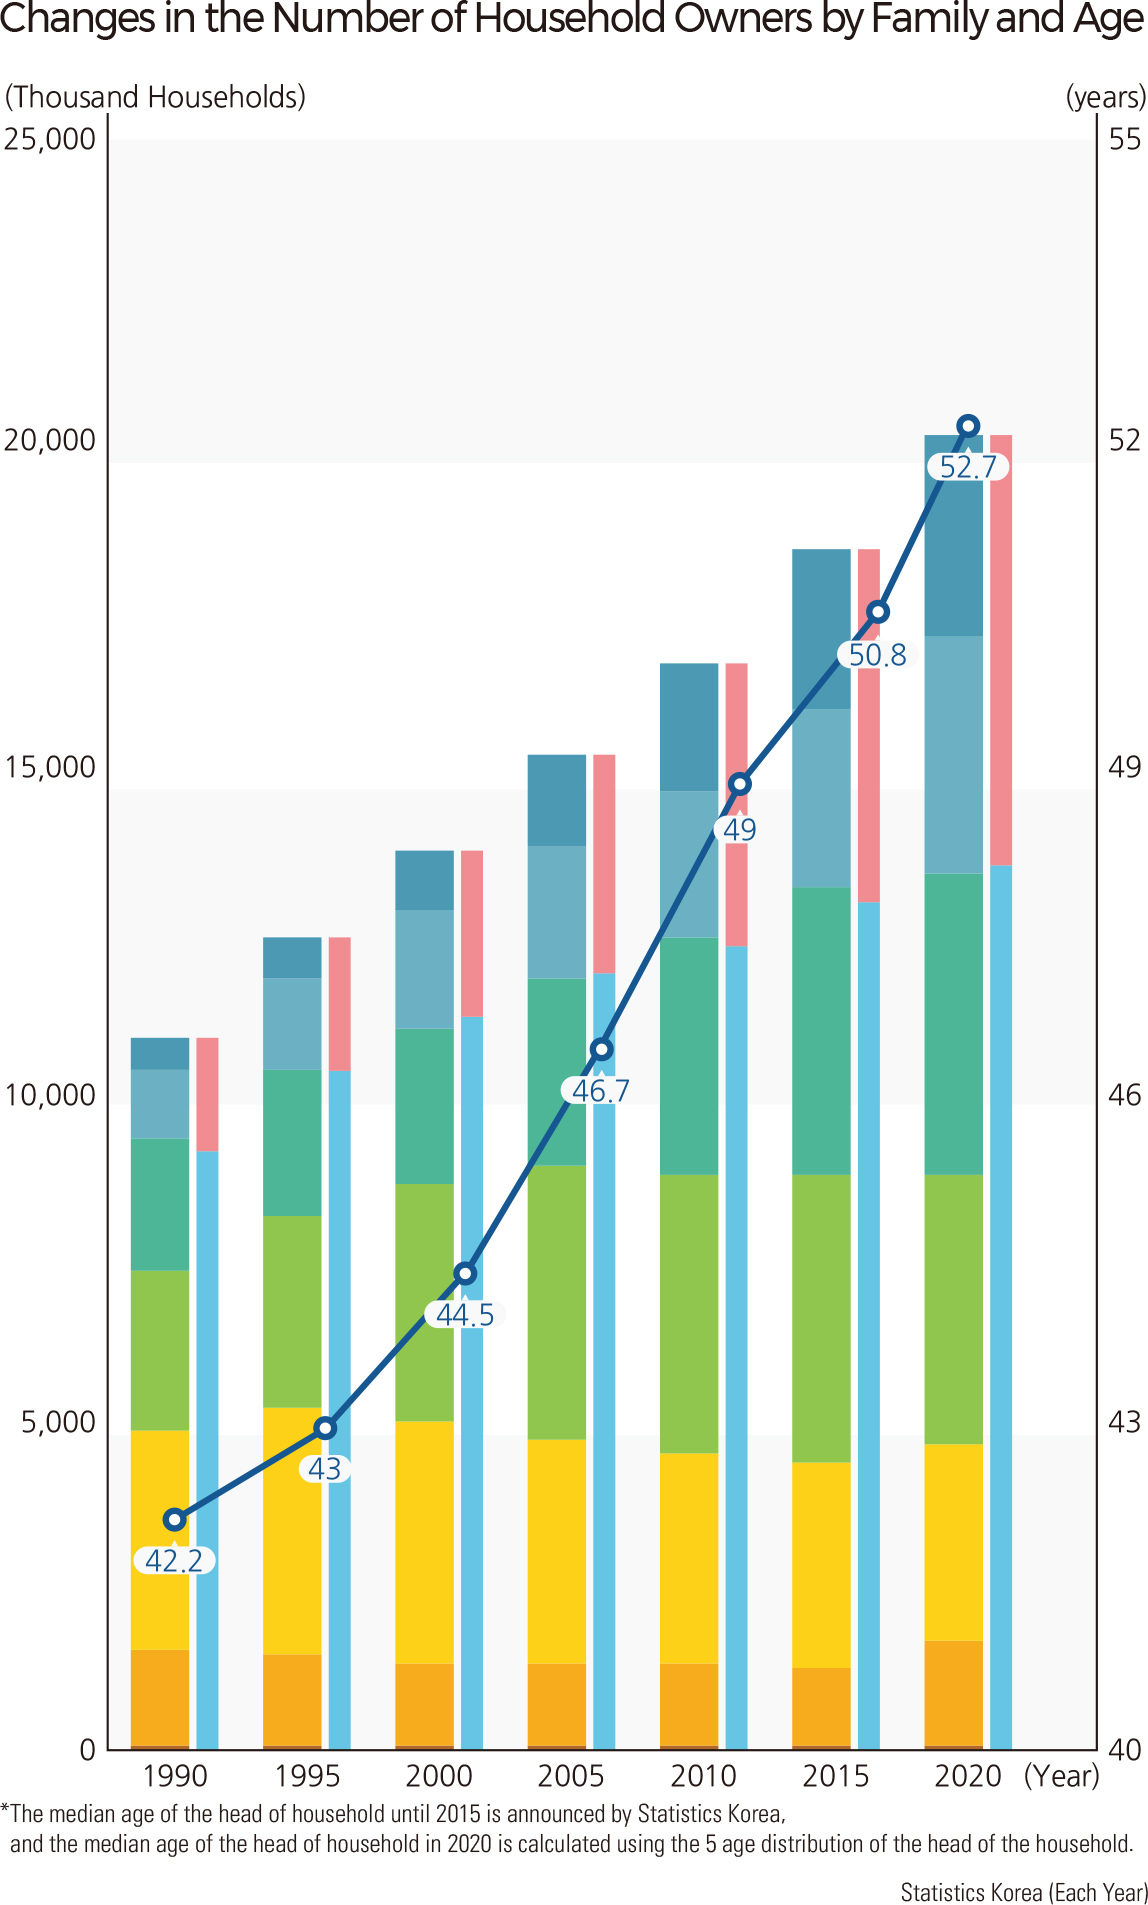
The numbers of single-person households and elderly households have increased, while the number of households with minors has decreased. The number of households with elderly people aged 65 and up increased from 4.07 million in 2010 to 5.87 million in 2020, accounting for 44 percent of all households. The proportion of elderly households rose from 23.5 percent in 2010 to 28.0 percent in 2020. As of 2020, the proportion of elderly households in Jeollanam-do had risen to 39 percent. In addition, the proportion of households with only the elderly and households with elderly singles reached 14.2 percent and 7.9 percent, respectively, necessitating the development of systems supporting elderly households. Of the 229 municipalities nationwide, 41 -si/-gun/-gu areas account for more than 50 percent of the elderly households, and the proportion of elderly households is low in large cities and the Seoul Metropolitan Areas. However, the proportion of elderly households is expected to increase rapidly in these urban areas. The number of households with minors under the age of 18 decreased by 11 percent, from 5.57 million households in 2016 to 4.95 million households in 2020, and the proportion of households with minors dropped from 28.7 percent in 2016 to 23.6 percent in 2020. Households with children under the age of five experienced the greatest decline, falling 18 percent from 2.06 million in 2016 to 1.69 million in 2020. Although policies to encourage childbirth have been implemented, the number of births is expected to decrease due to various social and economic factors. Accordingly, the number of households and household members is also expected to decrease. However, the proportion of households with minors generally shows the opposite trend of change to the proportion of elderly households. As of 2020, in 117 out of 229 -si/-gun/-gu areas, the proportion of households with minors was less than 20 percent. On the other hand, there are only 18 -si/-gun/-gu areas where the proportion of households with minors was greater than 30 percent. Heads of households were in their 30s, 40s, and 50s in order in 1990. However, as of 2020, heads of households were in their 50s, 40s, and 60s in order, and there were more heads of households aged 70 and over than those in their 30s. This change results from longer life expectancy and increased social activities of the elderly. In addition, the proportion of female heads of households increased from 15.7 percent in 1990 to 32.7 percent in 2020, representing the increase in women's social activities. |