THE NATIONAL ATLAS OF KOREA 2024
|
International Trade and Investment
|
.png)


Although global trade stagnated during 2019–2020 due to the COVID-19 pandemic, Korea was able to respond quickly to the downturn, thanks to its excellent quarantine system and competitive manufacturing industry. As of 2023, Korea’s export value is USD 632.2 billion, and its import value is USD 642.6 billion, resulting in an annual trade volume of about USD 1.3 trillion.
From 1998 to 2021, Korea has consistently maintained a trade surplus. While the country experienced a brief deficit in 2008 due to the sharp rise in raw material prices such as oil, Korea continued to achieve a trade surplus even during the global economic slowdown in 2012. Although the country recorded surpluses during 2020 and 2021 despite the impact of COVID-19, it has experienced a trade deficit since 2022.
Korea’s export value has been steadily increasing. In 2003, the export value was approximately USD 190 billion, but by 2023, it had significantly risen to USD 630 billion. Korea’s main export items include electrical and electronic products, machinery, and chemical products. In particular, electrical and electronic products, along with machinery, account for more than half of the total export value. Following these are minerals, steel and metal products, plastic, rubber, leather goods, textiles, agricultural and fishery products, daily necessities, and miscellaneous goods.
Korea’s import value has also been on the rise. In 2003, the import value was approximately USD 180 billion, but by 2023, it had increased to USD 640 billion, roughly 3.6 times higher. Korea’s main import items include minerals, electrical and electronic products, and machinery. The import value of minerals and electrical and electronic products accounts for more than half of the total imports. Following these are chemical products, steel and metal products, agricultural and fishery products, daily necessities, textiles, and miscellaneous goods.
As of 2023, the ranking of annual export amounts by region in Korea is as follows: Gyeonggi, Ulsan, Chungnam, Seoul, Incheon, Jeonnam, Gyeongnam, Gyeongbuk, Chungbuk, Gwangju, Busan, Daegu, Jeonbuk, Daejeon, Gangwon, Sejong, and Jeju. Notably, Gyeonggi accounts for about 20% of the country’s total export value. The combined export value of Gyeonggi, Ulsan, Chungnam, and Seoul makes up approximately 55% of the total exports. Gyeonggi, Ulsan, Seoul, and Chungnam have consistently ranked among the top four regions in export value from 2000 to 2023.
Most of Korea’s exports and imports are conducted through ports. As of 2023, 71% of export value and 73% of import value occurred at ports. Among the major ports, Busan Port handles the largest share, with USD 153.1 billion, accounting for about 34% of the total port export value. Following Busan Port are Ulsan Port (USD 52.8 billion, 12%), Busan New Port (USD 47.1 billion, 11%), Incheon Port (USD 44.5 billion, 10%), and Pyeongtaek Port (USD 31.2 billion, 7%). In terms of import value, Incheon Port leads with USD 86.2 billion, representing about 18% of the total. It is followed by Busan Port (USD 76.5 billion, 16%), Busan New Port (USD 72.1 billion, 15%), Pyeongtaek Port (USD 47.4 billion, 10%), and Ulsan Port (USD 42.4 billion, 9%).
Airports account for about 29% of export value and 27% of import value. Incheon Airport is the dominant player, handling 99.6% of the total airport export value with USD 182.8 billion, and 99.3% of the total airport import value with USD 175.2 billion. Gimhae Airport records 0.3% of the total with USD 5.2 billion in exports and USD 6.1 billion in imports. Overall, Incheon Airport holds an absolute share in exports and imports, while other airports remain at a minimal level.
Global Exports and Imports
As of 2023, the global trade volume is approximately USD 47.2 trillion. The largest trading countries are China, the United States, and Germany, with China accounting for about 12% of the total and the United States for about 10%. Korea maintains the eighth position in global trade rankings, accounting for 3% of the total trade volume.
Korea maintains trade relations with approximately 250 countries. As of 2023, the top countries for Korean exports are China, the United States, Vietnam, Japan, Hong Kong, Taiwan, Singapore, India, Australia, and Mexico, in that order. China and the United States, with the highest export amounts, each account for about 20% of Korea’s total export value in 2023.
As of 2023, Korea exported approximately USD 124.8 billion worth of goods to China. The largest export item was semiconductors, valued at about USD 11.7 billion. Following semiconductors, significant exports included wireless communication devices (USD 6.1 billion) and synthetic resins (USD 6.0 billion). Key export items to China are semiconductors and computers. China’s top three export partners are the United States, Hong Kong, and Japan, while its top three import partners are Taiwan, Korea, and the United States.
As of 2023, Korea exported approximately USD 115.7 billion worth of goods to the United States. The largest export items were automobiles and automotive parts. Automobiles accounted for about USD 22.3 billion in exports, while automotive parts were valued at USD 7.3 billion. Key export items with positive trends include automobiles and general machinery, while textiles and semiconductors have experienced weaker export performance. The top three export partners of the United States are Canada, Mexico, and China, while its top three import partners are Canada, Mexico, and China.
As of 2023, Korea achieved approximately USD 29 billion in exports to Japan. The largest export items were petroleum products and steel plates. Petroleum products accounted for about USD 3 billion in exports, while steel plates were valued at USD 2.5 billion. Major export items to Japan include petroleum products and petrochemicals, whereas textiles and computers have experienced weaker export performance. Japan’s top three export partners are China, the United States, and Australia, while its top three import partners are the United States, China, and Korea.
Korea’s mport value is highest from the following countries: China, the United States, Japan, Australia, Saudi Arabia, Vietnam, Taiwan, Germany, the United Arab Emirates, and Malaysia. China, with the highest import value, accounts for about 20% of the total annual import value, while the United States accounts for approximately 10%. When examining by continent, Asia accounts for half of Korea’s export and import values, followed by North America, Europe, Central and South America, Oceania, the Middle East, Africa, and other regions.
Korea is actively engaged in technology trade with other countries. Technology trade refers to the international export and import of technology through various means such as technology sales and licensing, provision of technology services, and more. This includes the international transfer and sale of technology or patents, knowledge transfer, technology consulting, and engineering services.
Technology trade is an important indicator of international technology exchange and reflects changes in technology and industrial structures among countries. The technology trade balance, which is the ratio of technology export value to import value, serves as a benchmark for assessing a country’s technological competitiveness. Korea’s technology trade volume surpassed USD 10 billion in 2009 and reached approximately USD 34.9 billion in 2022. This includes technology exports valued at USD 15.2 billion and technology imports valued at USD 19.6 billion.
As of 2022, Korea engaged in technology trade with approximately 110 countries. The top countries for technology exports were the United States (USD 4.48 billion), China (USD 2.60 billion), and Vietnam (USD 1.84 billion). The leading countries for technology imports were the United States (USD 6.82 billion), China (USD 1.79 billion), and the United Kingdom (USD 1.68 billion). The largest technology trade volumes were with the United States, China, and the United Kingdom.
In 2022, industries with high technology export and import volumes include information and communication technology (ICT) and electronics. The technology export volume in the ICT sector increased by 2.8% compared to the previous year. However, the technology import volume decreased by 19.7%, resulting in a shift from a deficit of USD 540 million to a surplus of USD 930 million.
Direct Investment
Overseas direct investment occurs when a country’s businesses invest capital in another country by establishing subsidiaries or branches, acquiring existing local companies, or setting up joint ventures.
As of 2023, the total investment amounted to USD 63.38 billion, with the largest scale reaching USD 81.50 billion in 2022. Despite a slight decrease in overseas direct investment in 2023 due to the ongoing high-interest rate environment globally, investments continue to be strong, particularly in advanced industries such as semiconductors and batteries, with a focus on the United States.
The top 10 countries for foreign direct investment are the United States (USD 27.72 billion), the Cayman Islands (USD 6.17 billion), Luxembourg (USD 4.95. billion), Canada (USD 3.60 billion), Vietnam (USD 2.64 billion), Indonesia (USD 2.09 billion), China (USD 1.87 billion), Singapore (USD 1.24 billion), Brazil (USD 1.18 billion), and Ireland (USD 870 million).
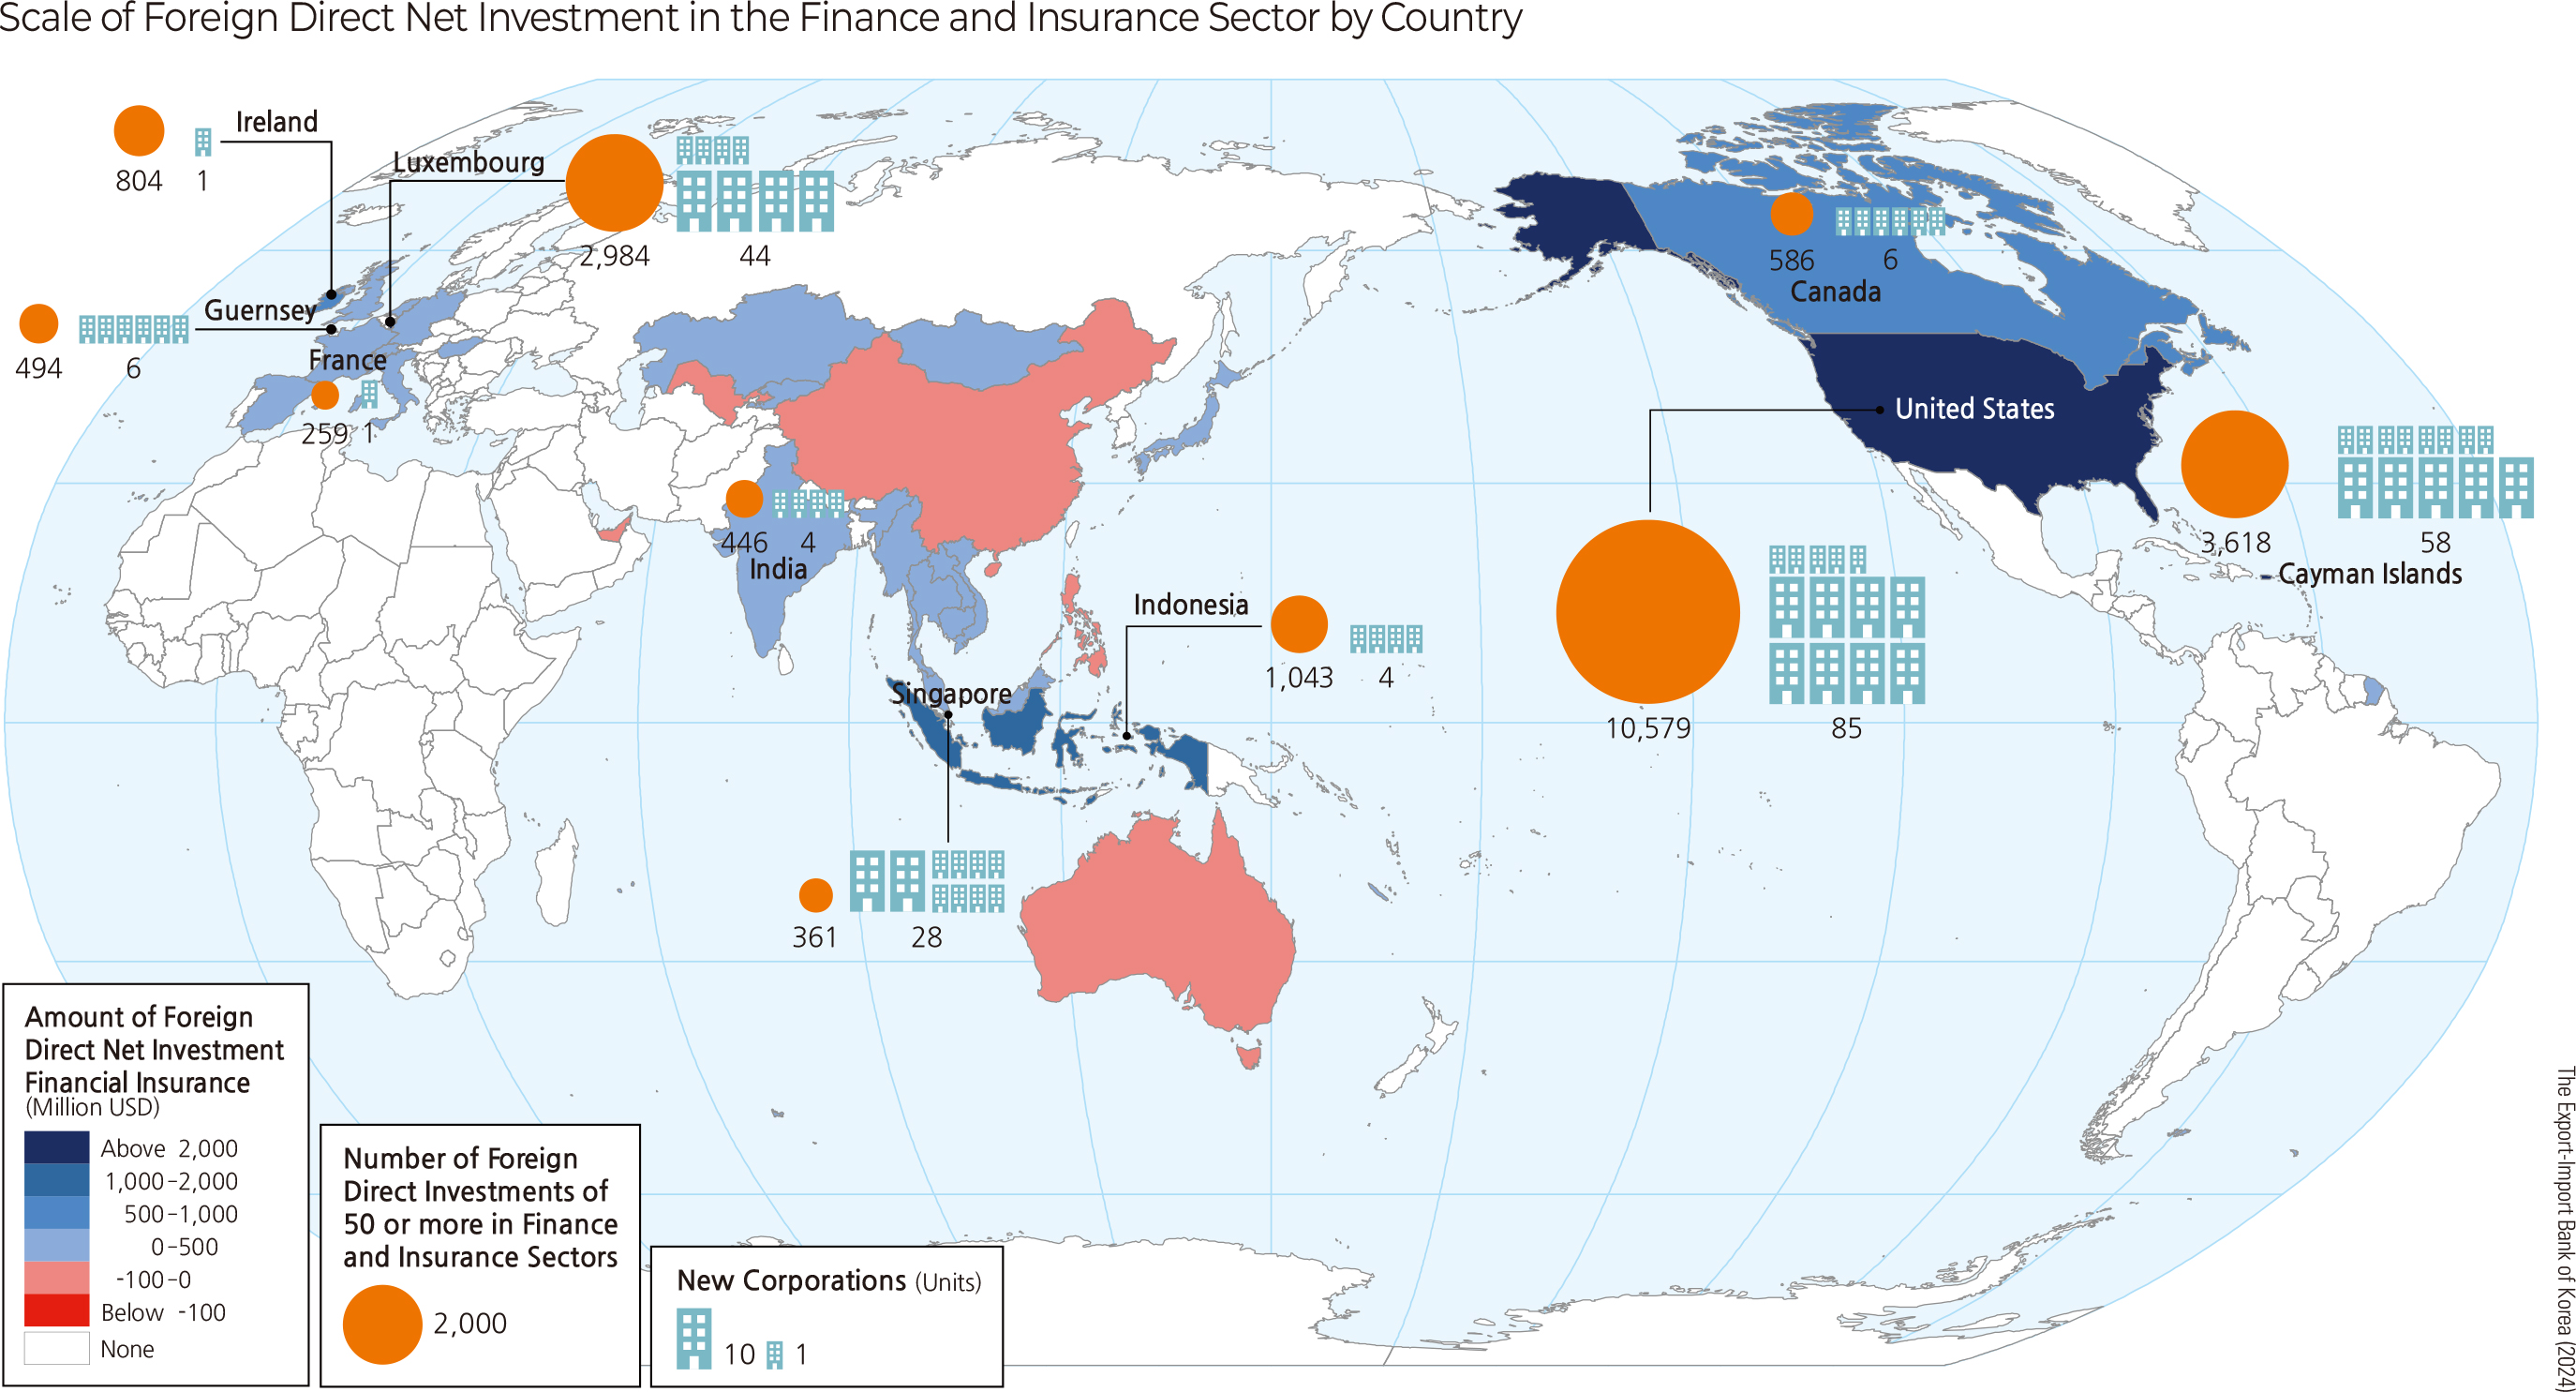
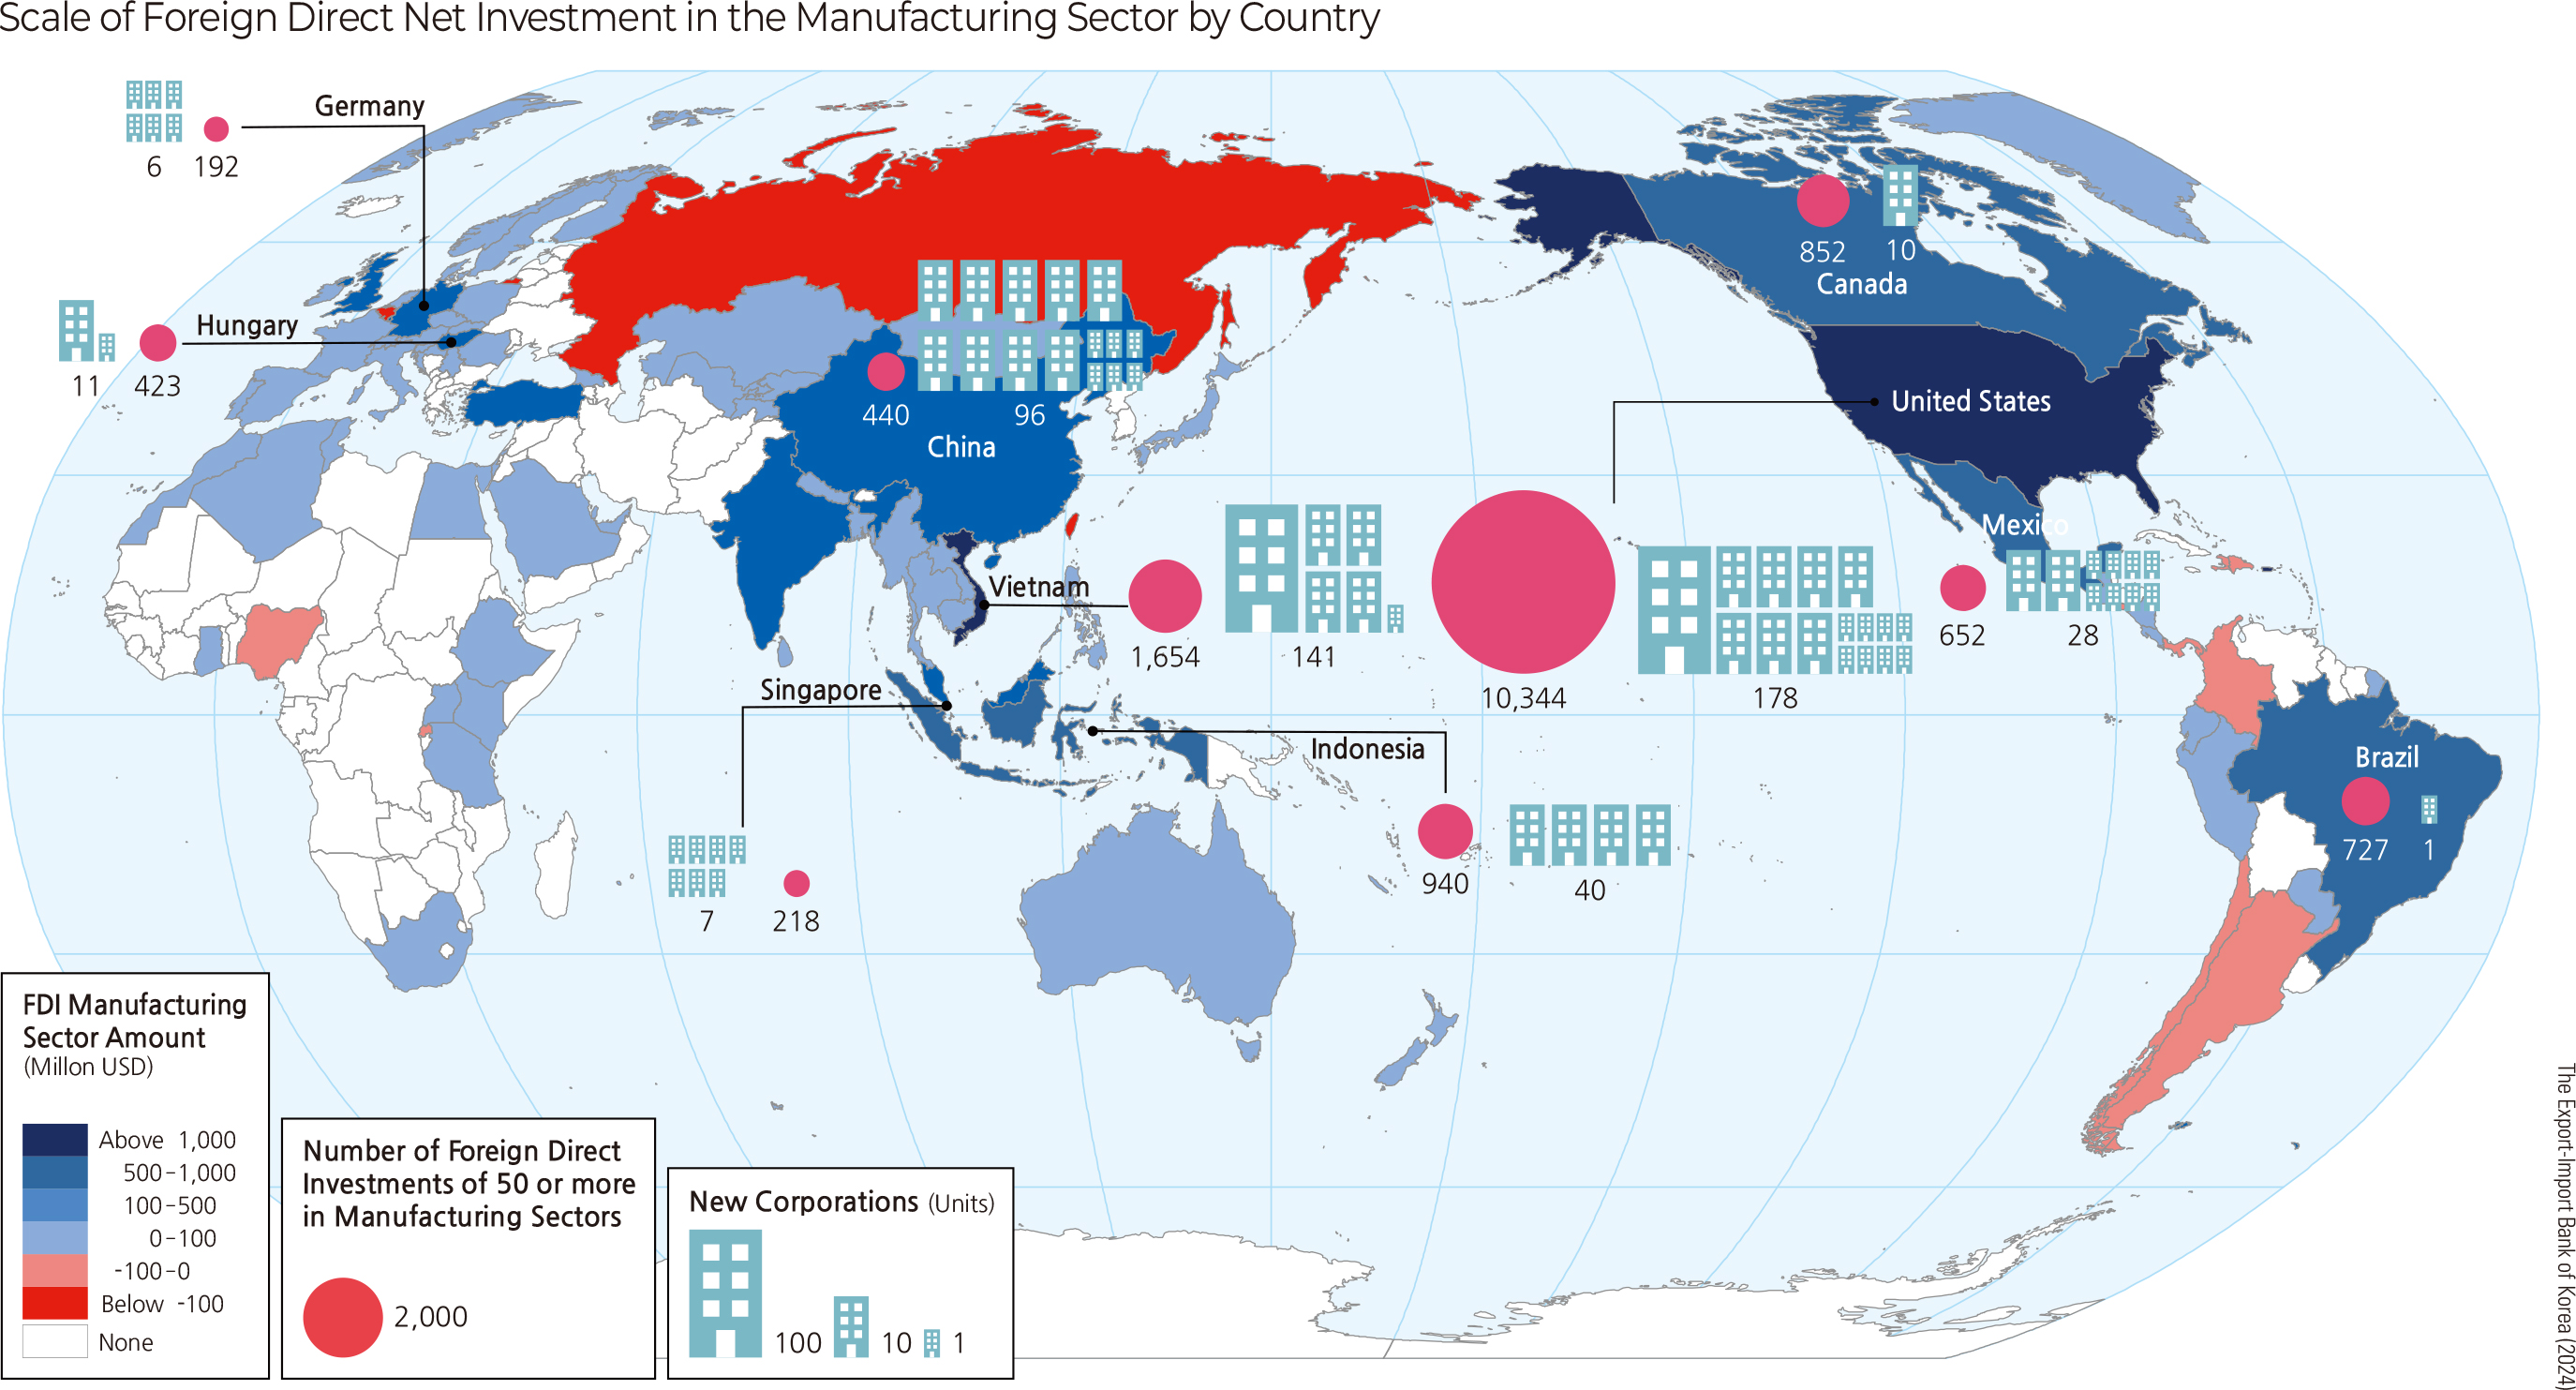
Since 1980, the industry with the highest cumulative foreign direct investment has been manufacturing. In 2023, the amount of foreign direct investment in manufacturing reached USD 20.25 billion, accounting for approximately 32% of the total foreign direct investment for the year. Since 2007, investment in finance and insurance has significantly increased, and by 2023, it constitutes the largest share, representing about 41% of total investment.
As of 2023, the countries with the highest foreign direct investment in the finance and insurance sector are the United States with approximately USD 12 billion and 426 filings; followed by the Cayman Islands (USD 5.3 billion, 518 filings), Luxembourg (USD 3.6 billion, 310 filings), and Indonesia (USD 1 billion, 17 filings).
For the manufacturing sector, the leading countries in terms of foreign direct investment are the United States (USD 10 billion, 744 filings), Vietnam (USD 2 billion, 930 filings), China (USD 1.4 billion, 393 filings), Brazil (USD 1.2 billion, 13 filings), and Indonesia (USD 1 billion, 206 filings.
Inward Foreign Direct Investment occurs when companies from other countries invest capital in our country by establishing subsidiaries or branches, acquiring existing companies, or forming joint ventures. In September 1998, the Korean government revised the Foreign Investment and Foreign Capital Introduction Act to introduce the Foreign Investment Promotion Act, simplifying the reporting system and converting it from a notification system to a simple reporting system, while offering various incentives to foreign-invested companies. In 2010, the Foreign Investment Promotion Act was further amended to establish a system allowing local governments and central administrative agencies to attract foreign investment. Externally, improvements in the investment environment, such as upgrades in national credit ratings and the signing of free trade agreements (FTAs), have increased Korea’s investment attractiveness.
As of 2023, the total amount of Inward Foreign Direct Investment into Korea is USD 19.1 billion, with a total of 2,480 investing companies. The top countries by Inward Foreign Direct Investment, based on the amount received, are the Cayman Islands (USD 3.88 billion), the United States (USD 2.39 billion), Singapore (USD 2.10 billion), Malta (USD 1.65 billion), the United Kingdom (USD 1.64 billion), Luxembourg (USD 1.28 billion), the Netherlands (USD 980 million), France (USD 930 million), Japan (USD 860 million), and Saudi Arabia (USD 450 million).
According to the Ministry of Trade, Industry, and Energy, as of June 2024, there are approximately 18,000 foreign-invested companies registered. Of these, 50% or around 9,000 companies are located in Seoul, with 3,697 in Gyeonggi-do, 1,817 in Incheon, and 654 in Busan.
By industry, the largest number of companies is in general wholesale trade, with 2,684 companies. This is followed by used car sales (1,203 companies), management consulting (544 companies), system software development and supply (456 companies), general brokerage (349 companies), and wholesale of cosmetics and personal care products (321 companies).
|
National Geography Information Institute (NGII) Copyright, |
 |
Ministry of Land Infrastructure and Transport 국토교통부 국토지리정보원 |
|---|