Comprehensive Edition 2022
Although connected to the mainland of Asia, Korea is ecologically isolated from the continent because of the high mountain terrain of Baekdusan and two large rivers that act as barriers to limit the movement of animals. As a result, Korea has many endemic species—those that are native to a particular geographic area and found nowhere else in the world. Scientists estimate that around ten percent of Korean species are endemic. A number of these are endangered or protected.
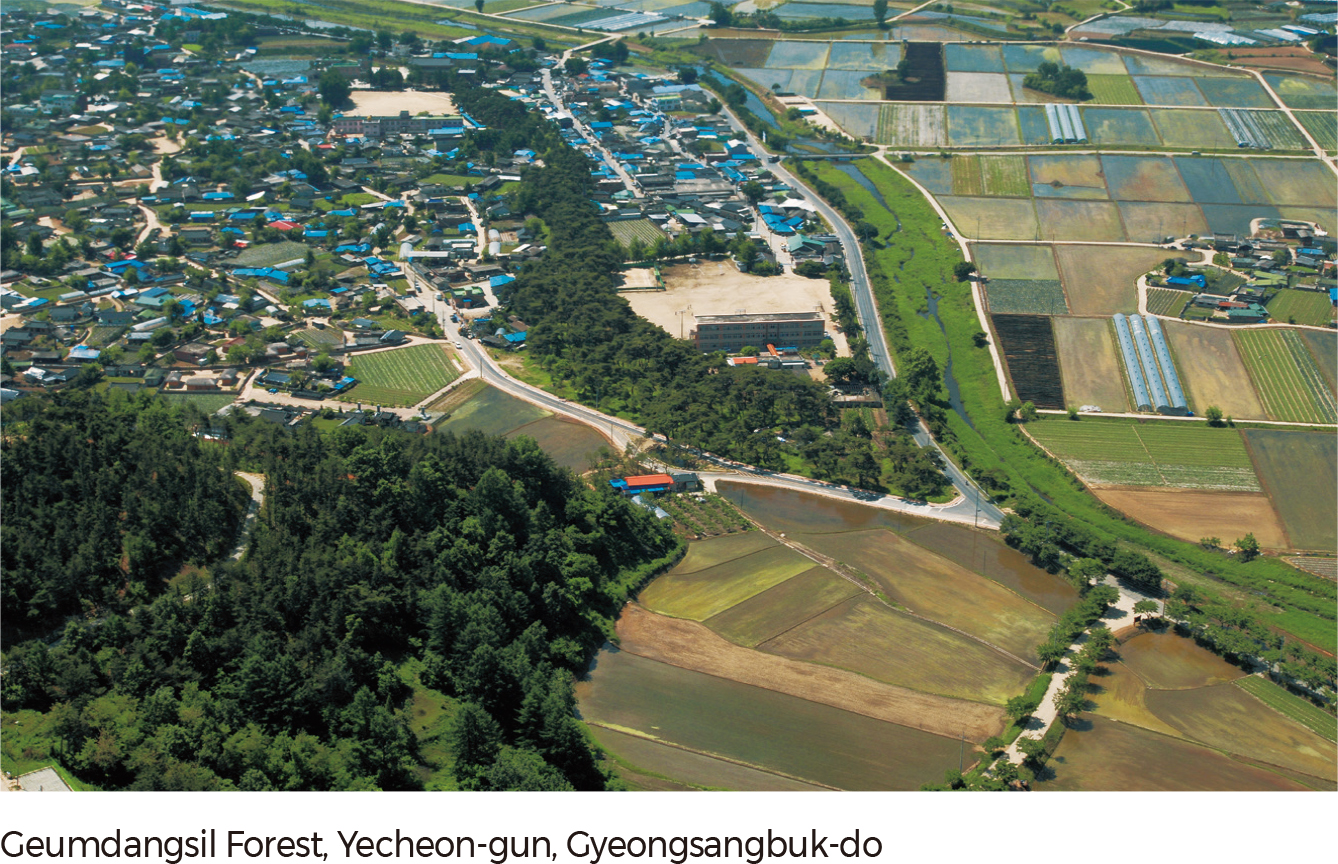
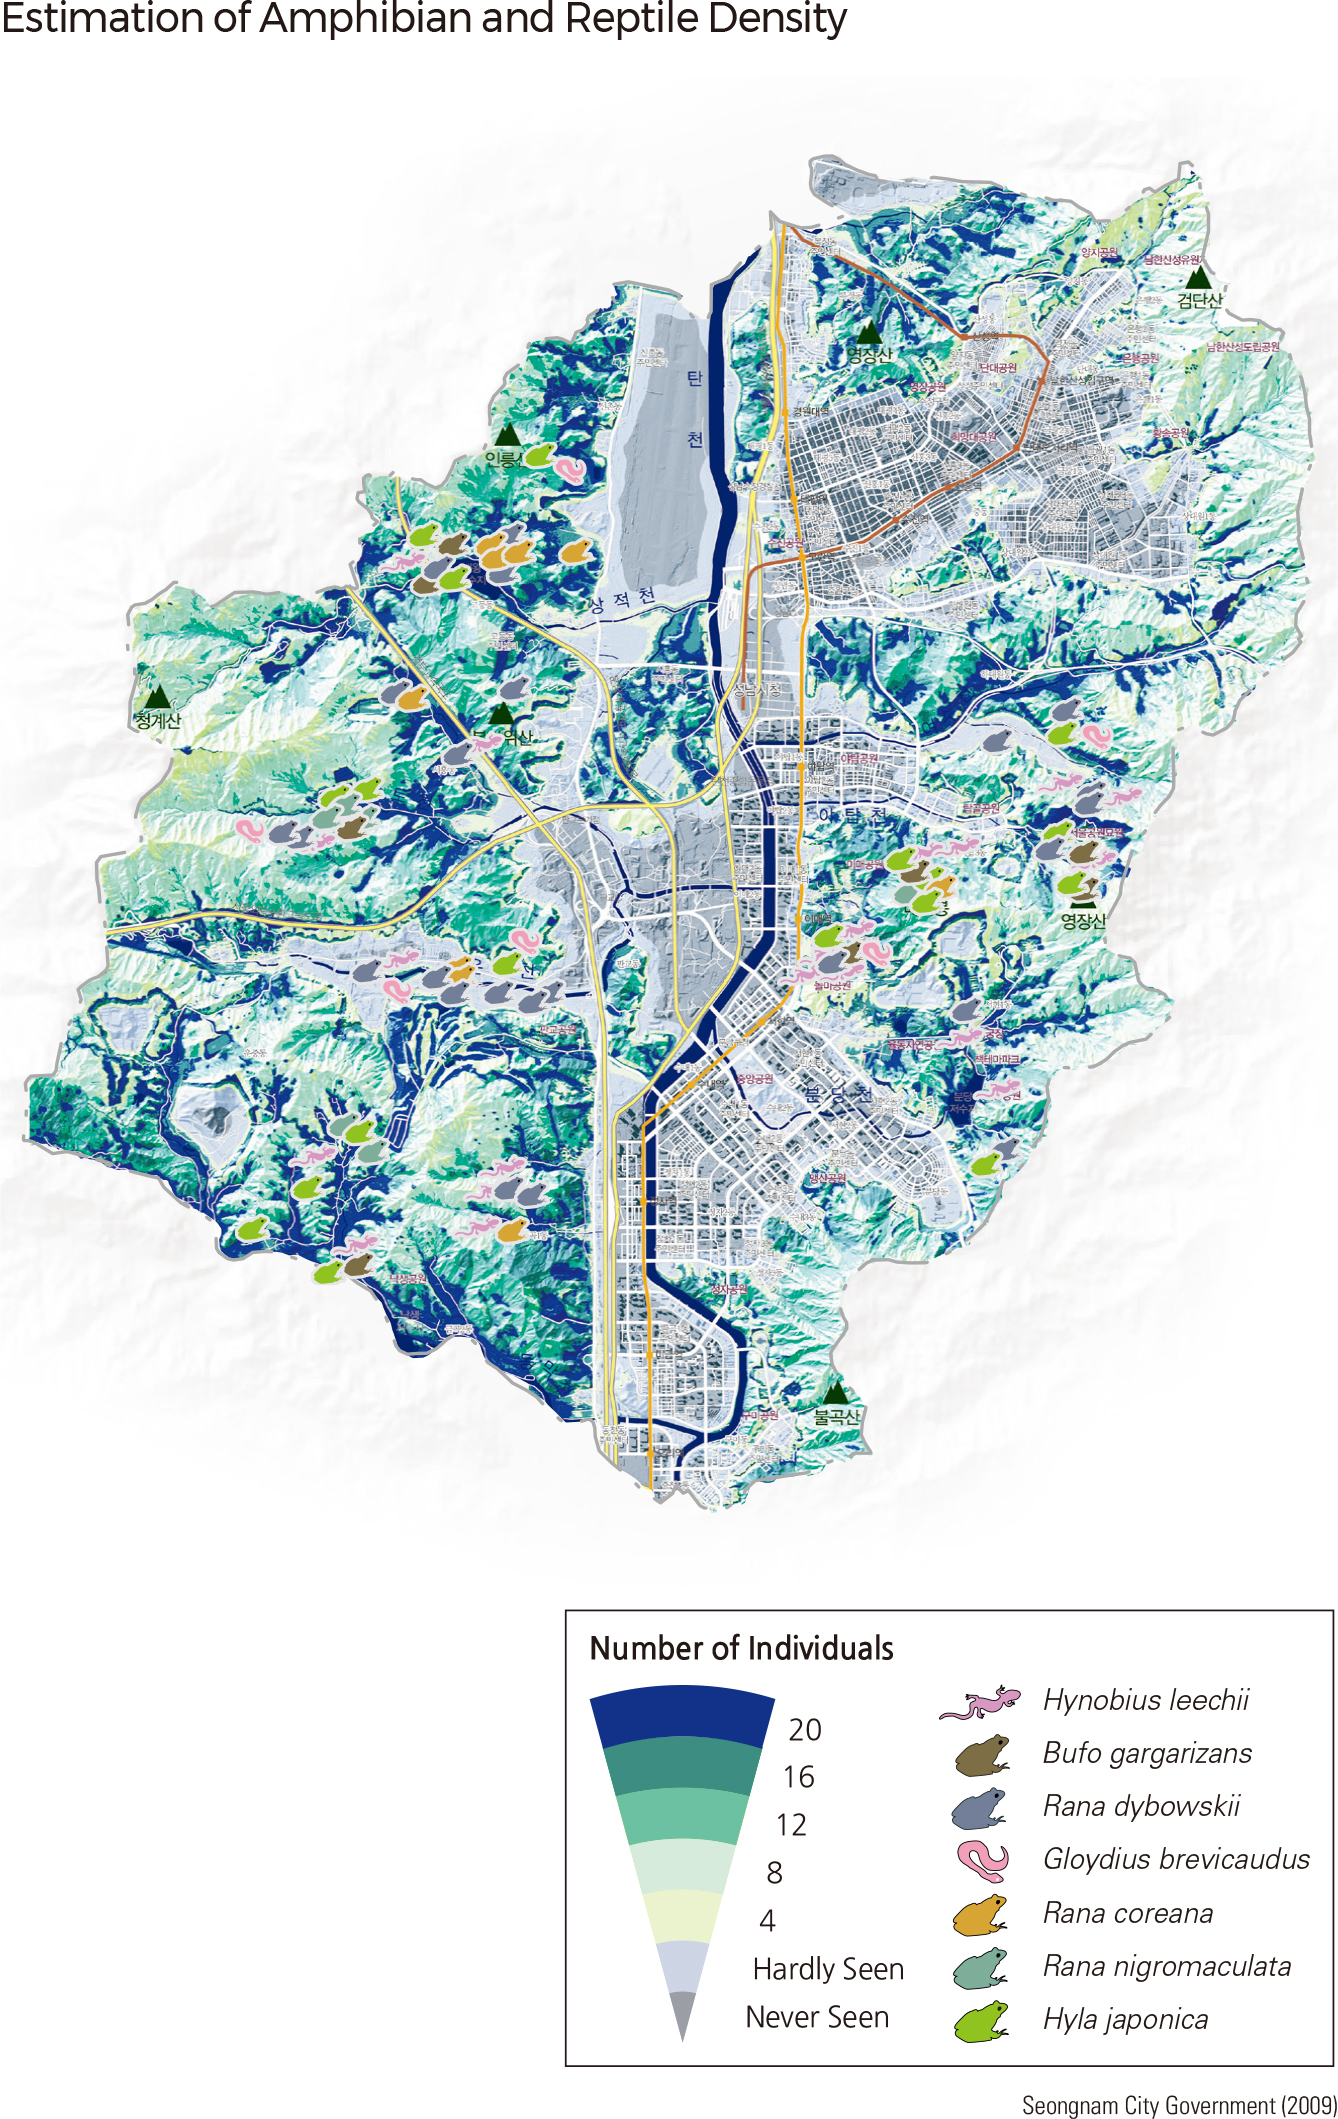
Globally, amphibian populations have been in sharp decline, partly as a result of habitat destruction, especially the loss of wetlands. Because amphibians are very sensitive to environmental pollutants, they are sometimes used as indicator species; the presence of healthy amphibians is an indicator of a clean environment. An important part of the efforts to protect these animals involves maintaining updated maps of their distribution in order to determine the effects of development, wetland loss, climate change, and pollution. The four amphibians pictured and mapped here are endemic to South Korea.
In a densely populated country such as Korea, habitat destruction threatens to reduce the area available for many plant and animal species to live. In many places, there is a complicated patchwork of developed areas in close proximity to threatened or endangered plant and animal communities.
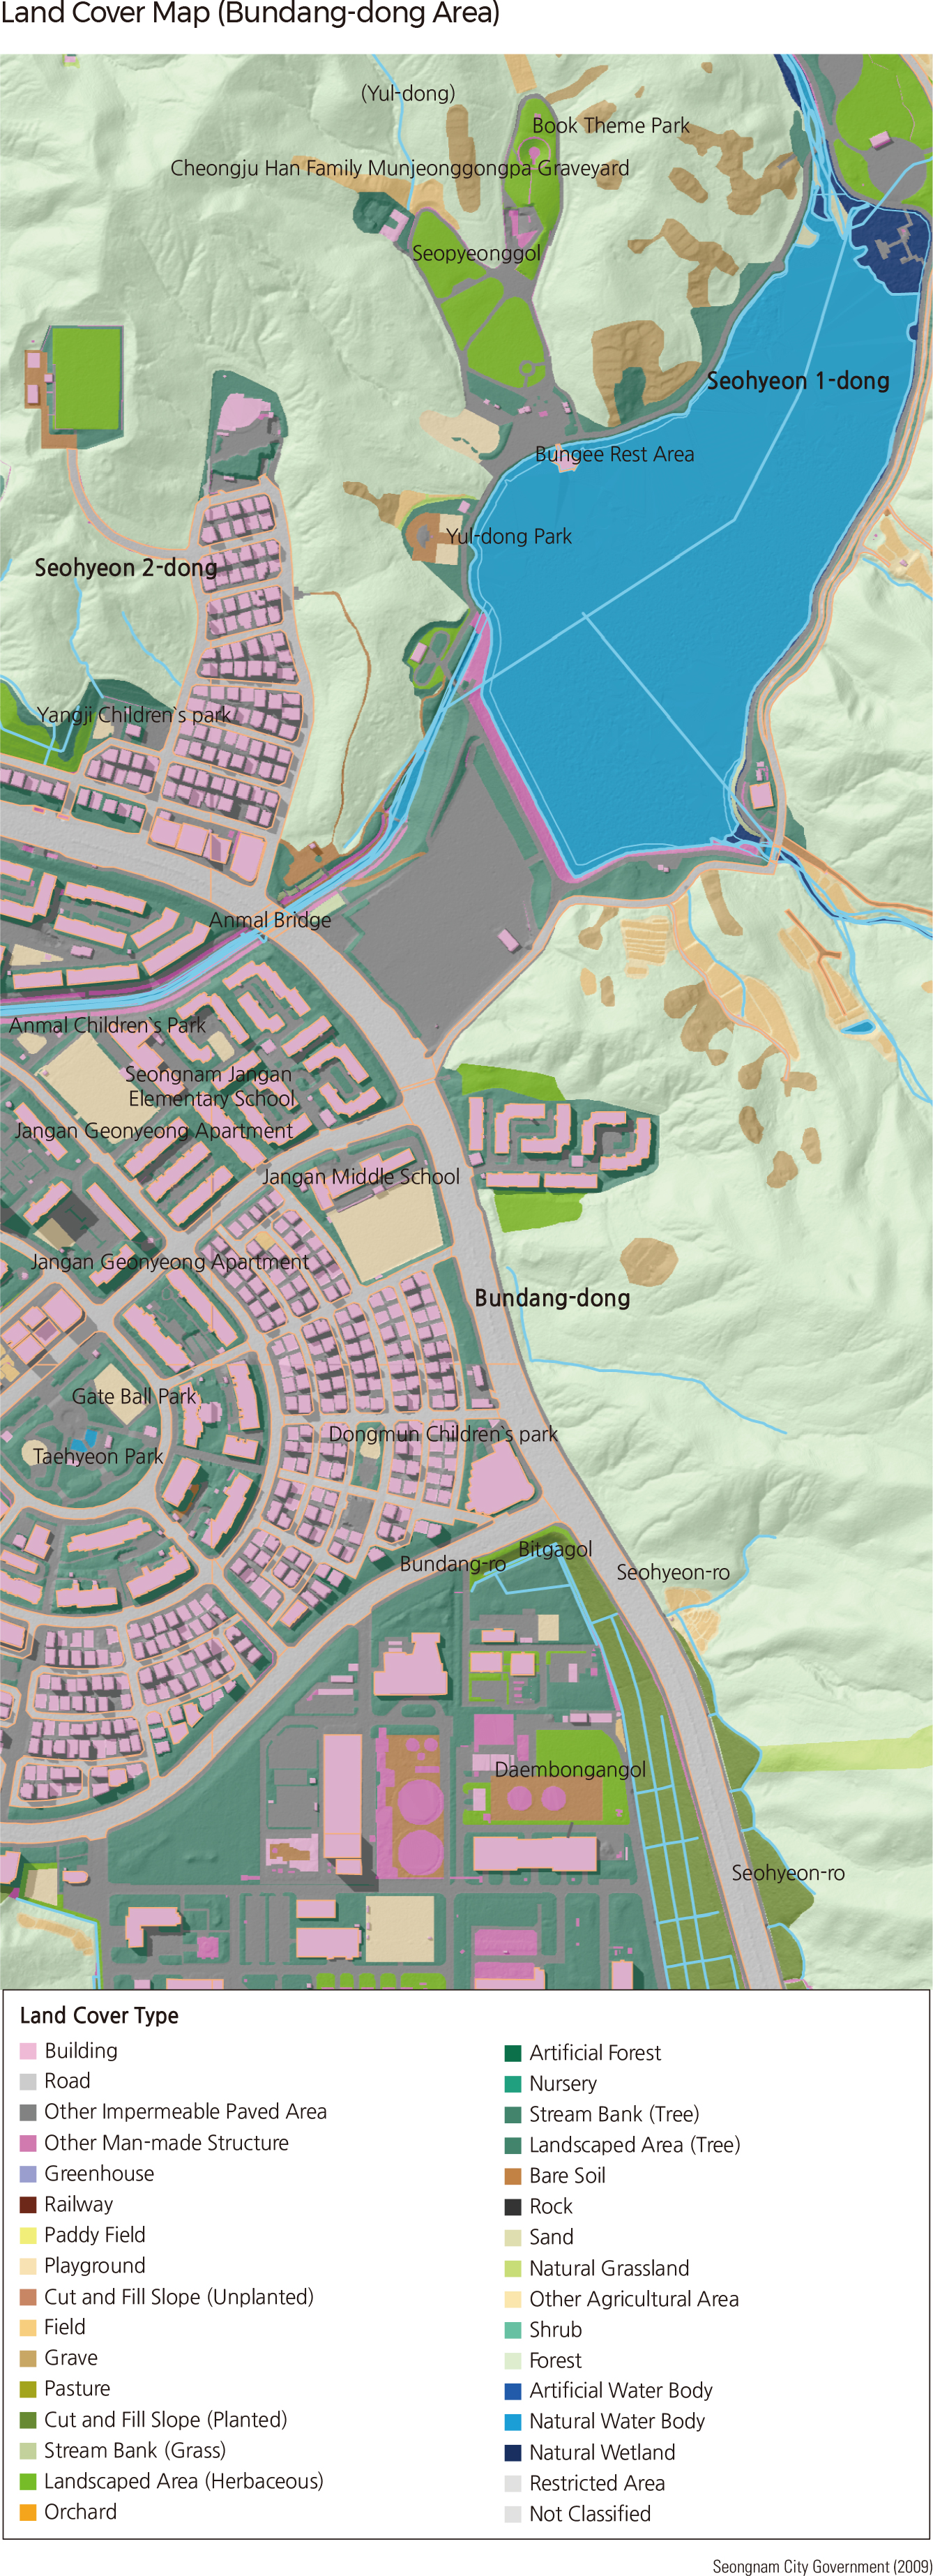
A land cover map, such as the one to the right depicting a section of Seongnam-si, is sometimes called a biotope map when used for ecological purposes. Such maps are useful for monitoring, planning, or evaluating risks to local wildlife and plants. Biotope maps are used for conservation projects, restoration of natural environments, and development of sustainable urban management plans. Local governments often use these maps for environmental assessment, development permits, and ecosystem management.
Mapping and other forms of geospatial analysis, such as Geographic Information Systems (GIS), are also used to display survey data or to make estimates of animal populations. As an example, the map below can be used to evaluate potential sources of pollution affecting amphibians in a particular watershed. |