Comprehensive Edition 2022
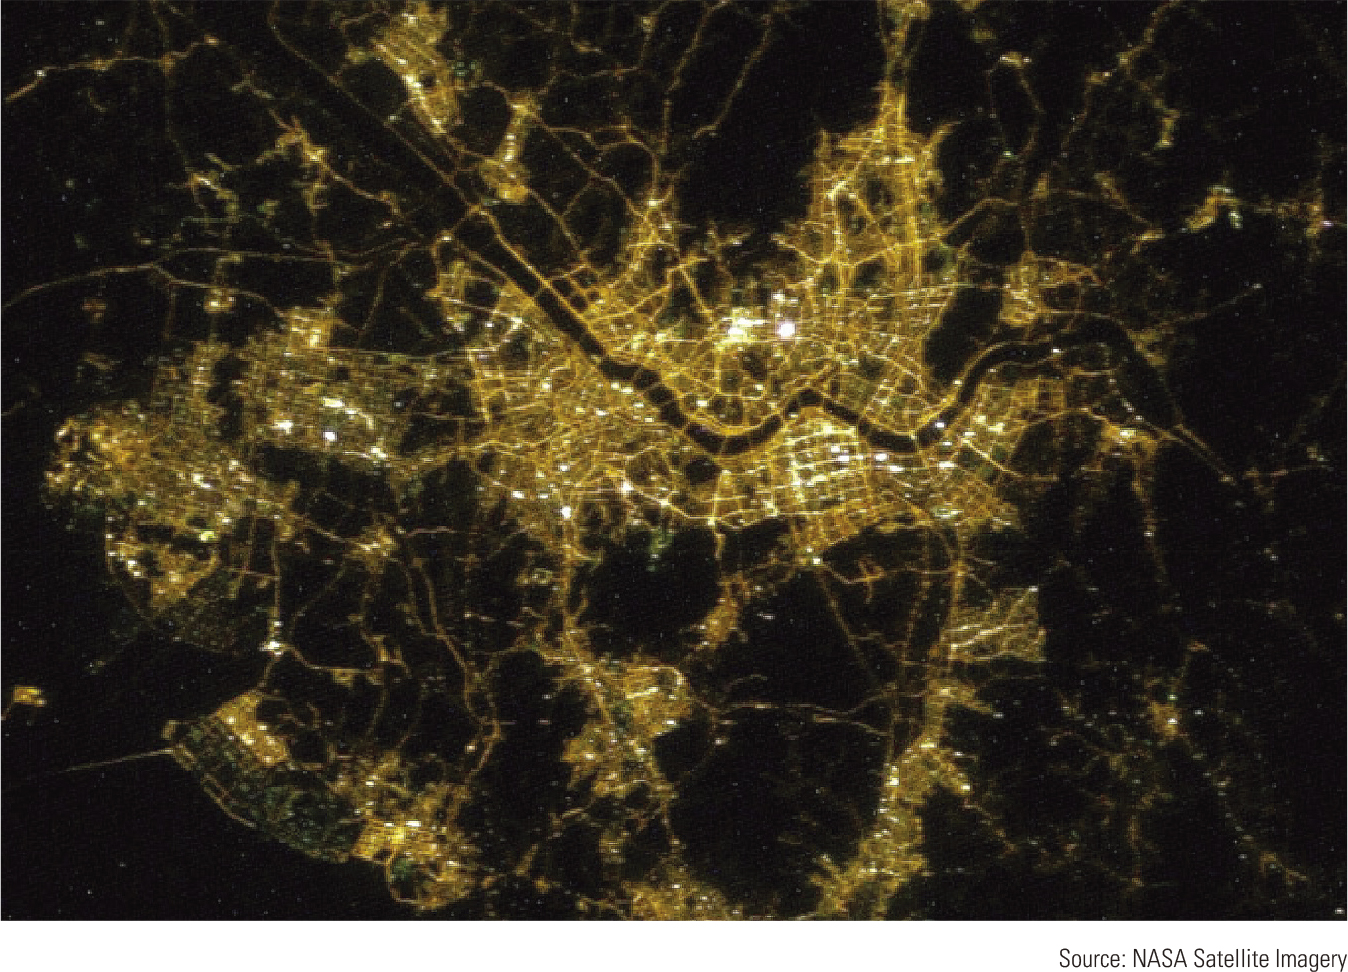
New technologies in satellite remote sensing and aerial imaging allow the collection of a variety of measurements of the earth’s surface at high resolution. Above is a visible-light image of the region, including Seoul, the capital of South Korea. The river Han features prominently in the image as the dark blue, wavy line. The blue area at left is the Yellow Sea.
When interpreting a remotely-sensed image, it helps to be familiar with the area from experience, but you can also use various other clues to interpret the features and land cover categories represented. This image has colors very similar to those that you would see with the unaided eye from an airplane; green areas represent forested or vegetated areas, whereas gray areas represent urbanized regions with many buildings. Some information about topography can also be deduced from the image. Subtle shading of the mountains indicates peaks, ridge lines, and slope aspect (direction of slope). A sharp boundary separates dark green, mountainous areas from heavily urbanized regions.
The image at right shows a similar aerial view of Seoul taken at night. Again, the River Han is prominent. The lights indicate the density of urbanization and clearly highlight the network of streets and roads throughout the city. Compare these images to the oblique air photo shown below, taken from an airplane looking across the river. When interpreting aerial or satellite imagery, it helps to have ground-based data for comparison and verification.
The image above is collected by a sensor that detects thermal infrared emissions, with colors corresponding to the temperature of objects at the earth’s surface. Cooler surfaces appear as blue or green, and warmer surfaces are as red or white. The Han River appears as dark blue and is the coolest surface indicated. Tributaries to the Han have a slightly warmer temperature and a lighter color blue. This warmer water from can be traced some distance downstream of the confluences before mixing reduces the temperature contrast.
Dense urban areas with many buildings, paved surfaces, and less vegetation appear as white or red. Streets and roads appear as red. Such an image can be useful to document the extent of an urban heat island effect, with elevated temperatures in city centers.
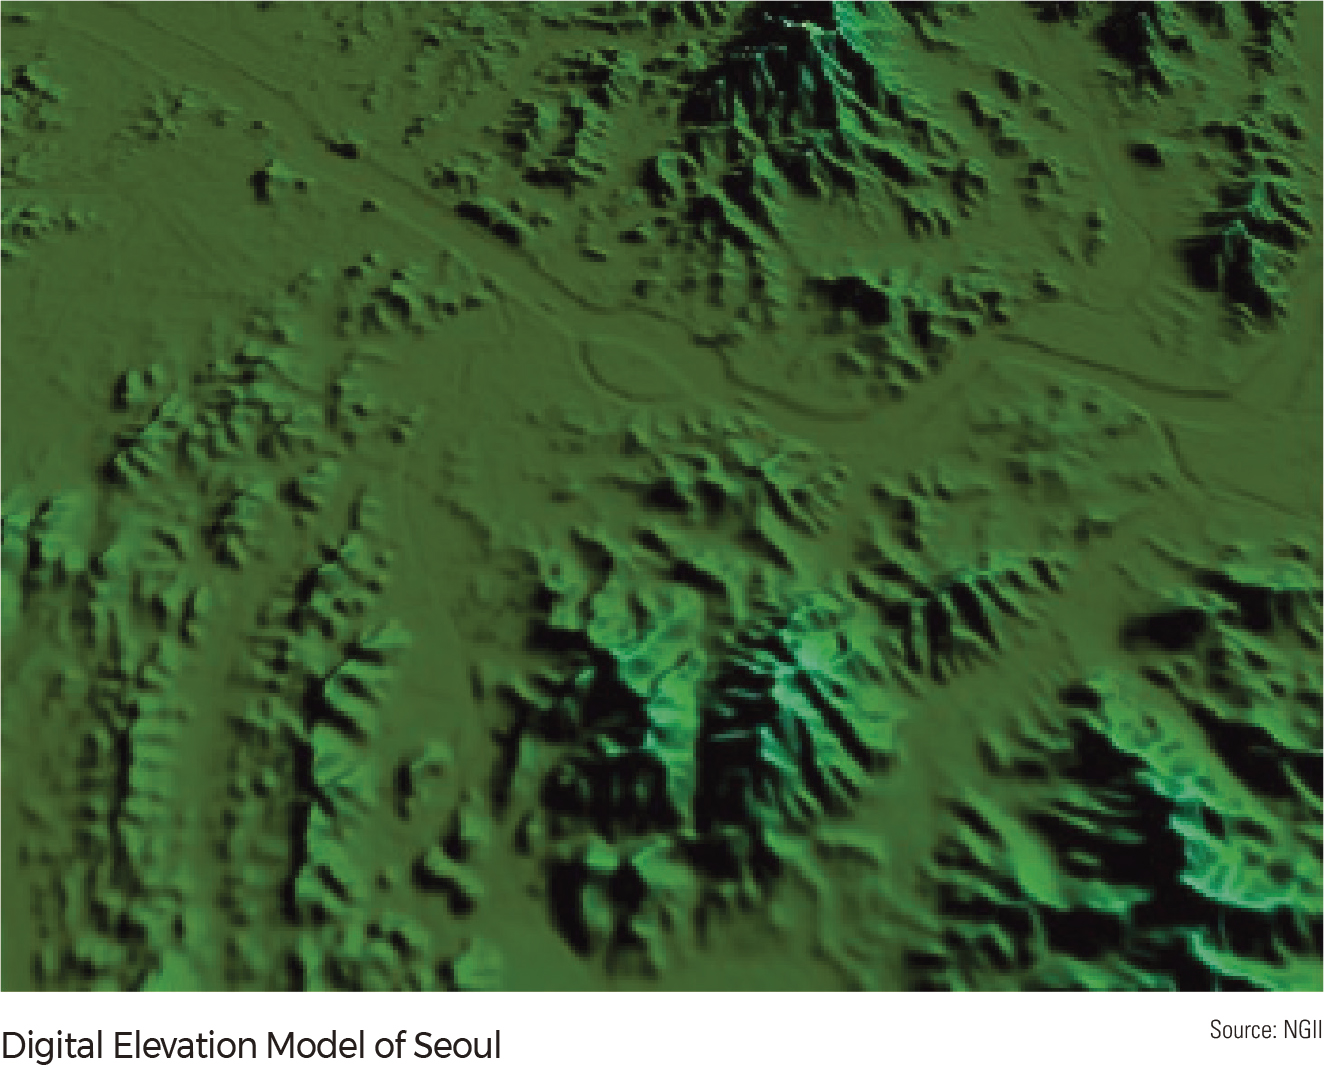
Raw imagery collected by remote sensing equipment can be further processed to create derived imagery for various purposes. The green image below is a three-dimensional digital elevation model that indicates the topography around Seoul. Below at right is a vectorized image showing street networks across the city. In creating map products that present remotely sensed data, geographers apply the principles of cartography to generate images and maps that are not only functional as tools for analysis, but are also beautiful and can be considered works of art themselves. |